
In the field of mechanical transmission, gear drives offer the advantages of a small center distance and a high transmission ratio, and they are widely used in many manufacturing industries. However, during dry gear machining of contour bevel gears, high cutting forces and cutting temperatures are generated, which can easily lead to poor machined surface quality and low machining efficiency. At the same time, the workpiece material undergoes plastic deformation, resulting in an uneven distribution of the metamorphic layer. Therefore, studying the machined surface quality and metamorphic layer of contour bevel gears is of great significance. Based on the gear machining principle of contour bevel gears, I investigated the machined surface quality and metamorphic layer through finite element simulation and experimental exploration. The research results not only provide a basis for optimizing the surface quality and process parameters of contour bevel gears, but also have reference value for the study of gear machining accuracy and transmission efficiency.
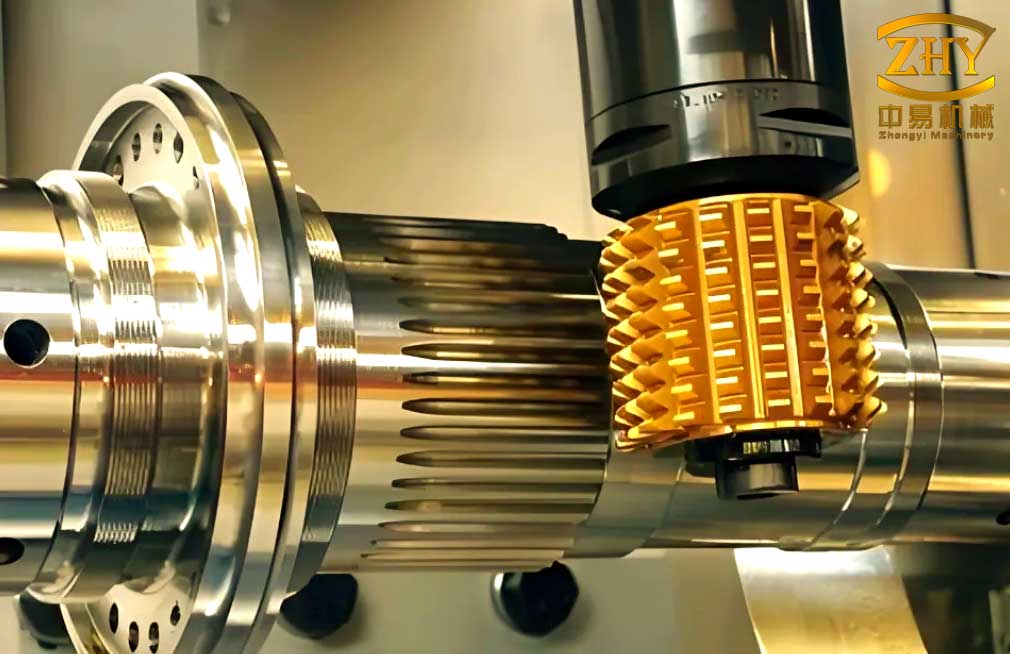
Gear machining is a complex process, especially for contour bevel gears, which are an important branch of spiral bevel gears. Their advantages include low noise and good stability, so the gear machining process for contour bevel gears has been extensively studied. The quality of the tooth surface strongly affects the transmission accuracy of the gear. Moreover, during gear machining, the workpiece material is prone to plastic deformation, leading to an uneven distribution of the metamorphic layer. Therefore, it is necessary to study the machined surface quality and metamorphic layer characteristics of contour bevel gears, so as to provide theoretical and technical support for the maturity and improvement of the gear machining process.
In this study, I first discussed the meshing principle of contour bevel gears and analyzed the gear machining process. I established an analytical relationship between the residual height of the tooth surface and the cutting parameters, and then performed a simulation analysis. I found that the residual height decreases with increasing cutting speed and increases with increasing feed rate. This provides a method for predicting the tooth surface roughness of spiral bevel gears. Then, through the single-tooth cutting process of contour bevel gears and the study of finite element analysis theory, I conducted a single-tooth finite element cutting simulation of contour bevel gears. I extracted and analyzed the main cutting force and the temperature field, strain field, and strain rate of the metamorphic layer at different depths from the machined surface. I optimized the gear machining cutting parameters using a genetic algorithm and obtained the final optimized result of \(v = 257.63\,\text{m/min}\) and \(f = 0.12\,\text{mm/r}\). This provided a parameter optimization scheme for the subsequent gear machining experiments. I then conducted dry gear machining experiments on contour bevel gears and found that with increasing cutting speed, the tool marks on the machined surface become denser and the residual height becomes smaller. With increasing feed rate, the residual height of the cutting surface morphology gradually increases, and defects such as feed marks, surface adhesion, surface coating, and surface pits appear on the machined surface. I also analyzed the work hardening of the machined surface. Therefore, within a reasonable range, appropriately increasing the cutting speed and reducing the feed rate is beneficial for improving the machined surface quality of contour bevel gears. Finally, I performed XRD diffraction analysis on the machined metamorphic layer and found that with increasing cutting speed, the diffraction intensity and width continuously increase, and the grain size in the metamorphic layer gradually decreases. When the cutting speed increased to \(200\,\text{m/min}\), the diffraction peak was close to that at \(v = 230\,\text{m/min}\). Through work hardening tests on the machined metamorphic layer, I found that when the depth from the machined surface is from \(0\) to \(40\,\mu\text{m}\), the microhardness of the metamorphic layer changes greatly, while from \(40\) to \(90\,\mu\text{m}\), the change tends to be gentle and gradually approaches the matrix hardness. I then observed the metamorphic layer thickness under different cutting parameters and found that the machined metamorphic layer thickness increases with increasing cutting speed and shows an upward trend with increasing feed rate. Therefore, when the cutting speed is \(200\) to \(230\,\text{m/min}\) and the feed rate is \(0.1\) to \(0.2\,\text{mm/r}\), gear machining can help control the formation of the machined metamorphic layer and produce better workpiece surface quality.
The gear machining of contour bevel gears is a complex process. In this study, I mainly used a combination of experiments and simulations to study the machined surface quality and metamorphic layer of contour bevel gears, while the theoretical analysis of the generating gear machining process was less involved. Therefore, I will conduct further research on the above content in future work.
To describe the gear machining process more precisely, I established the meshing relationship of contour bevel gears. In gear machining, the two conjugate surfaces \(S_1\) and \(S_2\) contact each other during transmission. At a contact point, the common normal vector and the relative velocity satisfy the meshing condition:
$$ \mathbf{n}_1 \cdot \mathbf{v}_{12} = 0 $$
where \(\mathbf{n}_1\) is the unit normal vector of the tooth surface and \(\mathbf{v}_{12}\) is the relative velocity between the two surfaces. For the local conjugate condition, the principal curvatures and directions must also satisfy the equation of motion. I established the gear machining coordinate system for the contour bevel gear, as summarized in Table 1.
| Coordinate axis | Description |
|---|---|
| A axis | Linear motion axis of the workpiece spindle |
| B axis | Rotary motion axis of the workpiece spindle |
| C axis | Adjustment motion axis of the gear blank |
| D axis | Rotary motion axis of the cutter spindle |
In the gear machining of contour bevel gears, the cutter and the workpiece perform a generating motion. The tooth surface mathematical model can be expressed through a series of coordinate transformations. For the cutting edge model, the coordinate vector in the cutter coordinate system is:
$$ \mathbf{r}_p = \begin{bmatrix} (R_p + S_p \sin \alpha_p)\cos \theta_p \\ (R_p + S_p \sin \alpha_p)\sin \theta_p \\ S_p \cos \alpha_p \\ 1 \end{bmatrix} $$
and the normal vector is:
$$ \mathbf{n}_p = \begin{bmatrix} \cos \alpha_p \cos \theta_p \\ \cos \alpha_p \sin \theta_p \\ \sin \alpha_p \end{bmatrix} $$
where \(R_p\) is the cutter radius, \(S_p\) is the distance along the cutting edge, \(\alpha_p\) is the pressure angle, and \(\theta_p\) is the angular position. The transformation matrices \(M_1\) through \(M_5\) and \(L_1\) through \(L_5\) are used to convert the cutter coordinates to the workpiece coordinates. The tooth surface equation becomes:
$$ \mathbf{r}_1 = M_1 M_2 M_3 M_4 M_5 \mathbf{r}_p $$
$$ \mathbf{n}_1 = L_1 L_2 L_3 L_4 L_5 \mathbf{n}_p $$
The formation of the residual height on the machined surface is related to the successive cutting edges. The residual area is formed between two adjacent cutting edges. The residual height \(h\) can be calculated from the intersection points of the cutting traces. For two adjacent cutting edges, the midpoint coordinates are:
$$ Y_{M0} = \frac{Y_1 + Y_2}{2} $$
$$ Z_{M0} = \frac{Z_1 + Z_2}{2} $$
The residual height is then:
$$ h = \sqrt{(Z_{M1} – Z_{M0})^2 + (Y_{M1} – Y_{M0})^2} $$
I simulated the relationship between the average residual height and the cutting parameters. The results showed that the average residual height decreases as the cutting speed increases and increases as the feed rate increases. This is consistent with the theoretical expectation that higher cutting speeds produce smaller scallops and lower feed rates produce denser tool marks.
For the finite element simulation of gear machining, I used the Johnson-Cook constitutive model to describe the material behavior of 20CrMnTi. The flow stress is given by:
$$ \sigma = \left( A + B \varepsilon_p^n \right) \left[ 1 + C \ln \left( \frac{\dot{\varepsilon}}{\dot{\varepsilon}_0} \right) \right] \left[ 1 – \left( \frac{T – T_r}{T_m – T_r} \right)^m \right] $$
where \(A\) is the yield strength, \(B\) is the hardening modulus, \(n\) is the hardening exponent, \(C\) is the strain rate sensitivity, \(m\) is the thermal softening coefficient, \(T_r\) is the reference temperature, and \(T_m\) is the melting temperature. The Johnson-Cook parameters for 20CrMnTi are listed in Table 2.
| Parameter | Value |
|---|---|
| \(A\) (MPa) | 1241 |
| \(B\) (MPa) | 622 |
| \(n\) | 0.6522 |
| \(C\) | 0.0134 |
| \(m\) | 1.3 |
The basic physical properties of 20CrMnTi are listed in Table 3.
| Property | Value |
|---|---|
| Density \(\rho\) (kg/m\(^3\)) | 8270 |
| Elastic modulus \(E\) (GPa) | 205 |
| Poisson’s ratio \(\mu\) | 0.3 |
| Hardness (HB) | 348 |
For the tool-chip friction condition, I adopted a modified Coulomb friction model. The friction stress is:
$$ \tau = \begin{cases} \mu \sigma_n, & \mu \sigma_n \leq \tau_s \\ \tau_s, & \mu \sigma_n > \tau_s \end{cases} $$
where \(\mu\) is the friction coefficient, \(\sigma_n\) is the normal stress on the rake face, and \(\tau_s\) is the shear yield stress of the material. The failure separation criterion is based on the equivalent plastic strain at fracture:
$$ \varepsilon_f = \int_0^{\varepsilon_f} \frac{d\varepsilon}{\sigma_1} $$
where \(\sigma_1\) is the maximum principal stress. In the simulation, the tool was set as a rigid body, and the workpiece was simplified to a single tooth slot. The mesh was locally refined to ensure accuracy. The workpiece had 100,000 elements, and the tool had 32,000 elements. The boundary conditions constrained the workpiece bottom in the \(x\), \(y\), and \(z\) directions.
Based on the residual height simulation and the actual gear machining environment, I selected the simulation parameters shown in Table 4.
| Simulation case | Cutting speed \(v\) (m/min) | Feed rate \(f\) (mm/r) |
|---|---|---|
| 1 | 200 | 0.1, 0.2, 0.3, 0.4 |
| 2 | 170, 200, 230, 260 | 0.1 |
I analyzed the cutting force under different feed rates at \(v = 200\,\text{m/min}\). The results showed that as the feed rate increases, the cutting force increases because the cutting area and chip thickness increase. However, when the feed rate reached \(0.3\,\text{mm/r}\) and \(0.4\,\text{mm/r}\), the cutting force curves became close. I also analyzed the cutting force under different cutting speeds at \(f = 0.1\,\text{mm/r}\). As the cutting speed increases, the single-tooth cutting time decreases and the cutting force tends to decrease. This is because the friction coefficient decreases at higher cutting speeds.
I extracted the temperature field, strain field, and strain rate at different depths from the machined surface. Figure 1 in my analysis showed the extraction path perpendicular to the cutting cross-section. The results indicated that as the depth from the machined surface increases, both the cutting temperature and strain decrease. However, the strain curve has a steeper slope than the temperature curve, indicating that strain changes more significantly than temperature.
For the effect of feed rate, I found that as the feed rate increases, the temperature field on the machined surface increases, and the thickness of the temperature-affected layer becomes larger. The strain and strain rate also tend to increase. For the effect of cutting speed, the temperature field increases with cutting speed, and the highest temperature appeared at \(v = 200\,\text{m/min}\), after which it gradually decreased. The strain and strain rate gradually increased, but the variation amplitude was smaller than that caused by the feed rate.
I then optimized the gear machining parameters using a genetic algorithm. The optimization variables were the cutting speed \(v_c\) and the feed rate \(f\). The objective functions were the cutting force \(F_c\) and the cutting temperature \(T_c\), both of which should be minimized. The regression models were:
$$ T_c = A v_c^{x_1} f^{y_1} $$
$$ F_c = B v_c^{x_2} f^{y_2} $$
The fitted coefficients are listed in Table 5.
| Model | \(A\) or \(B\) | \(x_1\) or \(x_2\) | \(y_1\) or \(y_2\) |
|---|---|---|---|
| Temperature | 6391 | -5.44 | 1011 |
| Force | 7.88 | -6.57 | 433 |
The constraints were:
$$ 170 \leq v_c \leq 260 $$
$$ 0.1 \leq f \leq 0.4 $$
The genetic algorithm used a population size of 100, 80 generations, a crossover probability of 0.8, and a mutation probability of 0.05. The optimization result was \(v_c = 257.63\,\text{m/min}\), \(f = 0.12\,\text{mm/r}\), with a cutting force of \(853.51\,\text{N}\) and a cutting temperature of \(520.71\,^\circ\text{C}\). This provided a parameter preference for the subsequent gear machining experiments.
For the experimental study on machined surface quality, I conducted dry gear machining experiments on a Gleason 175HC CNC gear milling machine. The workpiece material was 20CrMnTi, and the chemical composition and performance parameters are listed in Table 6 and Table 7.
| Element | C | Si | Mn | Cr | S | P | Ni | Ti |
|---|---|---|---|---|---|---|---|---|
| Content (%) | 0.18 | 0.28 | 0.93 | 1.12 | 0.007 | 0.010 | 0.0045 | 0.0650 |
| Property | Value |
|---|---|
| Density (kg/m\(^3\)) | 7800 |
| Elastic modulus (GPa) | 207 |
| Thermal expansion coefficient (1/\(^\circ\)C) | \(5 \times 10^{-6}\) |
| Poisson’s ratio | 0.25 |
| Room temperature hardness (HB) | \(\leq 217\) |
The cutting parameters were designed using a single-factor method, as shown in Table 8.
| Case | Cutter speed \(v\) (m/min) | Feed rate \(f\) (mm/r) |
|---|---|---|
| 1 | 260 | 0.1, 0.2, 0.3 |
| 2 | 170, 200, 230 | 0.1 |
After gear machining, each gear was wire-cut to obtain metallographic specimens with a length of 10 mm and a maximum width and height of 5 mm. One convex specimen and one concave specimen were prepared for each gear. The specimens were mounted, ground, polished, and etched with a 4% nitric acid alcohol solution for about 30 s. The microstructure was observed using an ultra-depth-of-field microscope and a scanning electron microscope.
I measured the tooth surface error using a Klingelnberg P40 gear measuring center. The measured data points showed that the experimental gears met the qualified requirements, so the selected cutting parameters were reasonable in actual gear machining.
I analyzed the surface roughness using a Zygo NewView8200 white light interferometer with a 10X lens. For each specimen, three relatively flat positions on the convex and concave surfaces were measured. The three-dimensional and two-dimensional surface morphologies were obtained. The surface roughness parameters \(S_a\), \(S_q\), and \(S_z\) were calculated as:
$$ S_a = \frac{1}{mn} \sum_{i=1}^{m} \sum_{j=1}^{n} |\eta_{ij}| $$
$$ S_q = \sqrt{ \frac{1}{mn} \sum_{i=1}^{m} \sum_{j=1}^{n} \eta_{ij}^2 } $$
$$ S_z = \frac{ \sum_{i=1}^{5} \eta_{pi} – \sum_{j=1}^{5} \eta_{vj} }{5} $$
The measured surface roughness data are listed in Table 9 and Table 10.
| Cutting parameter | \(v=170\,\text{m/min}\) | \(v=200\,\text{m/min}\) | \(v=230\,\text{m/min}\) | |||
|---|---|---|---|---|---|---|
| Convex | Concave | Convex | Concave | Convex | Concave | |
| \(S_a\) (\(\mu\)m) | 2.047 | 1.849 | 1.673 | 1.739 | 1.404 | 1.437 |
| \(S_q\) (\(\mu\)m) | 2.545 | 2.250 | 2.016 | 2.103 | 1.766 | 1.751 |
| \(S_z\) (\(\mu\)m) | 15.208 | 13.452 | 20.993 | 15.473 | 14.991 | 11.944 |
| Cutting parameter | \(f=0.1\,\text{mm/r}\) | \(f=0.2\,\text{mm/r}\) | \(f=0.3\,\text{mm/r}\) | |||
|---|---|---|---|---|---|---|
| Convex | Concave | Convex | Concave | Convex | Concave | |
| \(S_a\) (\(\mu\)m) | 1.307 | 1.222 | 1.755 | 1.589 | 1.967 | 1.806 |
| \(S_q\) (\(\mu\)m) | 1.589 | 1.511 | 2.146 | 1.985 | 2.510 | 2.476 |
| \(S_z\) (\(\mu\)m) | 10.905 | 10.787 | 14.290 | 13.604 | 16.933 | 15.692 |
From Table 9, when the feed rate is fixed and the cutting speed increases from 170 to 230 m/min, the surface roughness \(S_a\) on the convex surface decreases from 2.047 to 1.404 \(\mu\)m, and on the concave surface it decreases from 1.849 to 1.437 \(\mu\)m. From Table 10, when the cutting speed is fixed at \(260\,\text{m/min}\) and the feed rate increases, the surface roughness \(S_a\) on the convex surface increases from 1.307 to 1.967 \(\mu\)m, and on the concave surface it increases from 1.222 to 1.806 \(\mu\)m.
I observed the surface morphology using a scanning electron microscope. The results showed that increasing the cutting speed reduces the surface roughness and produces a better surface quality. As the feed rate increases, the surface roughness gradually increases, leading to surface tearing and microcracks. The surface defects included feed marks, surface adhesion, surface coating, and surface pits. I used EDS to analyze the composition of these defects. The results showed that the adhesion points mainly contained O, Fe, and Mn, indicating that oxidation reactions occurred at high cutting temperatures. The surface coating was caused by the extrusion of the cutting edge, which caused the workpiece material to pile up and then locally peel off, forming pits.
I performed XRD analysis on the machined surface and the matrix material. The diffraction peak of the machined surface was higher than that of the matrix, because the plastic deformation during gear machining introduced microstrain into the grains. I also measured the microhardness using a DHV-1000 Vickers hardness tester with a load of 0.98 N and a dwell time of 15 s. The matrix hardness was 165.9 HV. The microhardness of the machined surface was higher than that of the matrix. The microhardness values under different cutting speeds are listed in Table 11, and under different feed rates in Table 12.
| Cutting speed (m/min) | 170 | 200 | 230 |
|---|---|---|---|
| Microhardness (HV) | 179.3 | 184.7 | 177.3 |
| Feed rate (mm/r) | 0.1 | 0.2 | 0.3 |
|---|---|---|---|
| Microhardness (HV) | 175.3 | 179.7 | 183.3 |
The results show that the microhardness first increases and then decreases with increasing cutting speed. This is because the cutting temperature and plastic deformation increase with cutting speed, but when the speed is too high, the cutting force and plastic deformation decrease, weakening the hardening effect. With increasing feed rate, the plastic deformation intensifies, the lattice distortion increases, and the deformation resistance increases, so the work hardening degree increases. Therefore, within a reasonable range, increasing the cutting speed and reducing the feed rate is beneficial for reducing the work hardening of the gear surface.
For the metamorphic layer study, I prepared metallographic specimens by wire cutting, mounting, grinding, polishing, and etching with a 4% nitric acid alcohol solution for about 40 s. I used XRD to analyze the machined metamorphic layer. The diffraction peaks were mainly concentrated in the range of \(43^\circ\) to \(46^\circ\). The effect of cutting speed on the diffraction peak is shown in Table 13.
| Cutting speed (m/min) | Diffraction peak intensity | Peak width |
|---|---|---|
| 170 | Low | Narrow |
| 200 | Medium | Medium |
| 230 | High | Wide |
As the cutting speed increases, the diffraction intensity and width increase, indicating grain refinement and transformation within the metamorphic layer. When the cutting speed reached \(230\,\text{m/min}\), the diffraction peak was close to that at \(200\,\text{m/min}\). This is because the temperature field at different depths from the machined surface generally increases with the cutter speed, causing the workpiece material to reach the phase transformation temperature. However, with a further increase in cutter speed, the change in cutting temperature is not obvious, so the diffraction peak only slightly increases.
The effect of feed rate on the diffraction peak of the metamorphic layer showed that as the feed rate increases, the diffraction peak gradually increases, leading to grain refinement and an increase in the hardness of the metamorphic layer, which verifies the work hardening test results.
I observed the metallographic microstructure of the machined metamorphic layer. The matrix material was ferrite and pearlite. Due to the high temperature and strain in the cutting zone, part of the ferrite and pearlite transformed into austenite, and grain refinement occurred, resulting in work hardening of the machined metamorphic layer. This affects the machined surface quality.
I measured the microhardness along the depth direction from the machined surface. At each depth, three points were measured at the same interval, and the average value was taken as the hardness at that depth. The matrix microhardness of 20CrMnTi was 165.9 HV. The variation of work hardening with cutting speed at \(f = 0.1\,\text{mm/r}\) is shown in Table 14.
| Depth (\(\mu\)m) | Hardness at \(v=170\) (HV) | Hardness at \(v=200\) (HV) | Hardness at \(v=230\) (HV) |
|---|---|---|---|
| 0-10 | 180.2 | 186.5 | 178.9 |
| 10-20 | 177.8 | 183.2 | 176.4 |
| 20-40 | 173.5 | 178.9 | 172.8 |
| 40-60 | 169.2 | 172.3 | 168.7 |
| 60-90 | 166.5 | 168.1 | 166.2 |
The variation of work hardening with feed rate at \(v = 260\,\text{m/min}\) is shown in Table 15.
| Depth (\(\mu\)m) | Hardness at \(f=0.1\) (HV) | Hardness at \(f=0.2\) (HV) | Hardness at \(f=0.3\) (HV) |
|---|---|---|---|
| 0-10 | 175.3 | 179.7 | 183.3 |
| 10-20 | 172.6 | 176.8 | 180.2 |
| 20-40 | 169.8 | 173.5 | 176.9 |
| 40-60 | 167.1 | 169.9 | 172.4 |
| 60-90 | 165.9 | 166.8 | 168.1 |
The results show that when the depth from the machined surface is from 0 to 40 \(\mu\)m, the microhardness of the metamorphic layer changes greatly, while from 40 to 90 \(\mu\)m, the change tends to be gentle and gradually approaches the matrix hardness. The work hardening degree increases with increasing feed rate. The effect of cutting speed on work hardening is not strictly proportional. Within a certain range, the cutting speed has a bidirectional effect on the increase of work hardening due to the influence of plastic deformation and the material’s own hardness.
I analyzed the different regions of the machined metamorphic layer using EDS. The machined cross-section can be divided into three regions: the metamorphic layer region, the transition region, and the matrix region. The EDS results showed that Fe and Cr elements exist in all three regions, but their contents are different. The closer to the metamorphic layer, the lower the Fe content. Combined with the XRD phase analysis, this indicates that as gear machining proceeds, the temperature in the cutting zone gradually increases, and the local microstructure of the matrix material undergoes phase transformation, forming the metamorphic layer. The metamorphic layer region is likely to contact N in the air and react, while the transition region is the contact area between the metamorphic layer and the matrix.
I measured the metamorphic layer thickness under different cutting parameters. The variation of the metamorphic layer thickness with feed rate at \(f = 0.1\,\text{mm/r}\) is shown in Table 16.
| Cutting speed (m/min) | Metamorphic layer thickness (\(\mu\)m) |
|---|---|
| 170 | 12.5 |
| 200 | 18.3 |
| 230 | 24.7 |
| 260 | 28.9 |
The variation of the metamorphic layer thickness with cutting speed at \(v = 260\,\text{m/min}\) is shown in Table 17.
| Feed rate (mm/r) | Metamorphic layer thickness (\(\mu\)m) |
|---|---|
| 0.1 | 15.2 |
| 0.2 | 21.6 |
| 0.3 | 27.8 |
| 0.4 | 33.5 |
The results show that the machined metamorphic layer thickness increases with increasing cutting speed and shows an upward trend with increasing feed rate. When the cutting speed is in the range of 200 to 230 m/min and the feed rate is in the range of 0.1 to 0.2 mm/r, the change in metamorphic layer thickness is relatively small. Therefore, gear machining within this parameter range can effectively control the thickness of the metamorphic layer and improve the gear surface quality.
In summary, I studied the machined surface quality and metamorphic layer of contour bevel gears through theoretical analysis, finite element simulation, and gear machining experiments. The main conclusions are as follows. First, based on the meshing principle and generating gear machining principle, I established the analytical relationship between the residual height and cutting parameters and found that the residual height decreases with increasing cutting speed and increases with increasing feed rate. This provides a method for predicting the tooth surface roughness of spiral bevel gears. Second, through single-tooth finite element cutting simulation, I extracted the main cutting force and the temperature field, strain field, and strain rate at different depths. The optimized gear machining parameters were \(v = 257.63\,\text{m/min}\) and \(f = 0.12\,\text{mm/r}\). Third, the gear machining experiments showed that increasing the cutting speed makes the tool marks denser and reduces the residual height, while increasing the feed rate increases the residual height and causes surface defects such as feed marks, adhesion, coating, and pits. Work hardening analysis showed that appropriately increasing the cutting speed and reducing the feed rate is beneficial for improving the machined surface quality. Fourth, XRD analysis of the metamorphic layer showed that with increasing cutting speed, the diffraction intensity and width increase, and the grain size decreases. The work hardening test showed that the microhardness changes greatly from 0 to 40 \(\mu\)m and tends to be gentle from 40 to 90 \(\mu\)m. The metamorphic layer thickness increases with increasing cutting speed and feed rate. When the cutting speed is 200 to 230 m/min and the feed rate is 0.1 to 0.2 mm/r, gear machining can help control the formation of the metamorphic layer and produce better surface quality.
Gear machining of contour bevel gears is a complex process. In this study, I mainly combined experiments and simulations to study the machined surface quality and metamorphic layer, while the theoretical analysis of the generating gear machining process was less involved. Therefore, I will conduct further research on the above content in future work.