
In the field of precision machinery and robotics, the rotary vector reducer stands as a critical component due to its compact design, high load-bearing capacity, large transmission ratio, and superior accuracy. However, transmission error remains a primary source of vibration and noise in these devices, directly impacting their performance and longevity. In this study, I investigate the transmission error of a rotary vector reducer under varying operational conditions, aiming to elucidate the effects of input speed and load on error dynamics. By comparing results with industry standards and commercial products, this work provides insights into the performance gaps and optimization strategies for rotary vector reducers.
The transmission error in a rotary vector reducer is defined as the deviation between the actual output rotation angle and the theoretically expected output angle based on the input and transmission ratio. It arises from manufacturing inaccuracies, assembly errors, and elastic deformations under load. Mathematically, the transmission error \( E \) is expressed as:
$$E = \frac{\theta_{in}}{R} – \theta_{out}$$
where \( \theta_{in} \) is the measured input rotation angle, \( \theta_{out} \) is the measured output rotation angle, and \( R \) is the transmission ratio of the rotary vector reducer. This formula serves as the foundation for our experimental measurements and analysis.
To conduct this study, I utilized an RV-40E rotary vector reducer with a transmission ratio of 121. The experimental setup comprised a dedicated test platform capable of handling input power up to 1.8 kW, output torque up to 1000 N·m, and speeds ranging from 10 to 40 r/min. The system included drive motors, torque sensors, angular encoders at both input and output ends, and a loading mechanism to simulate operational conditions. All tests were performed in a controlled environment at 21°C and 64% relative humidity to ensure consistency.
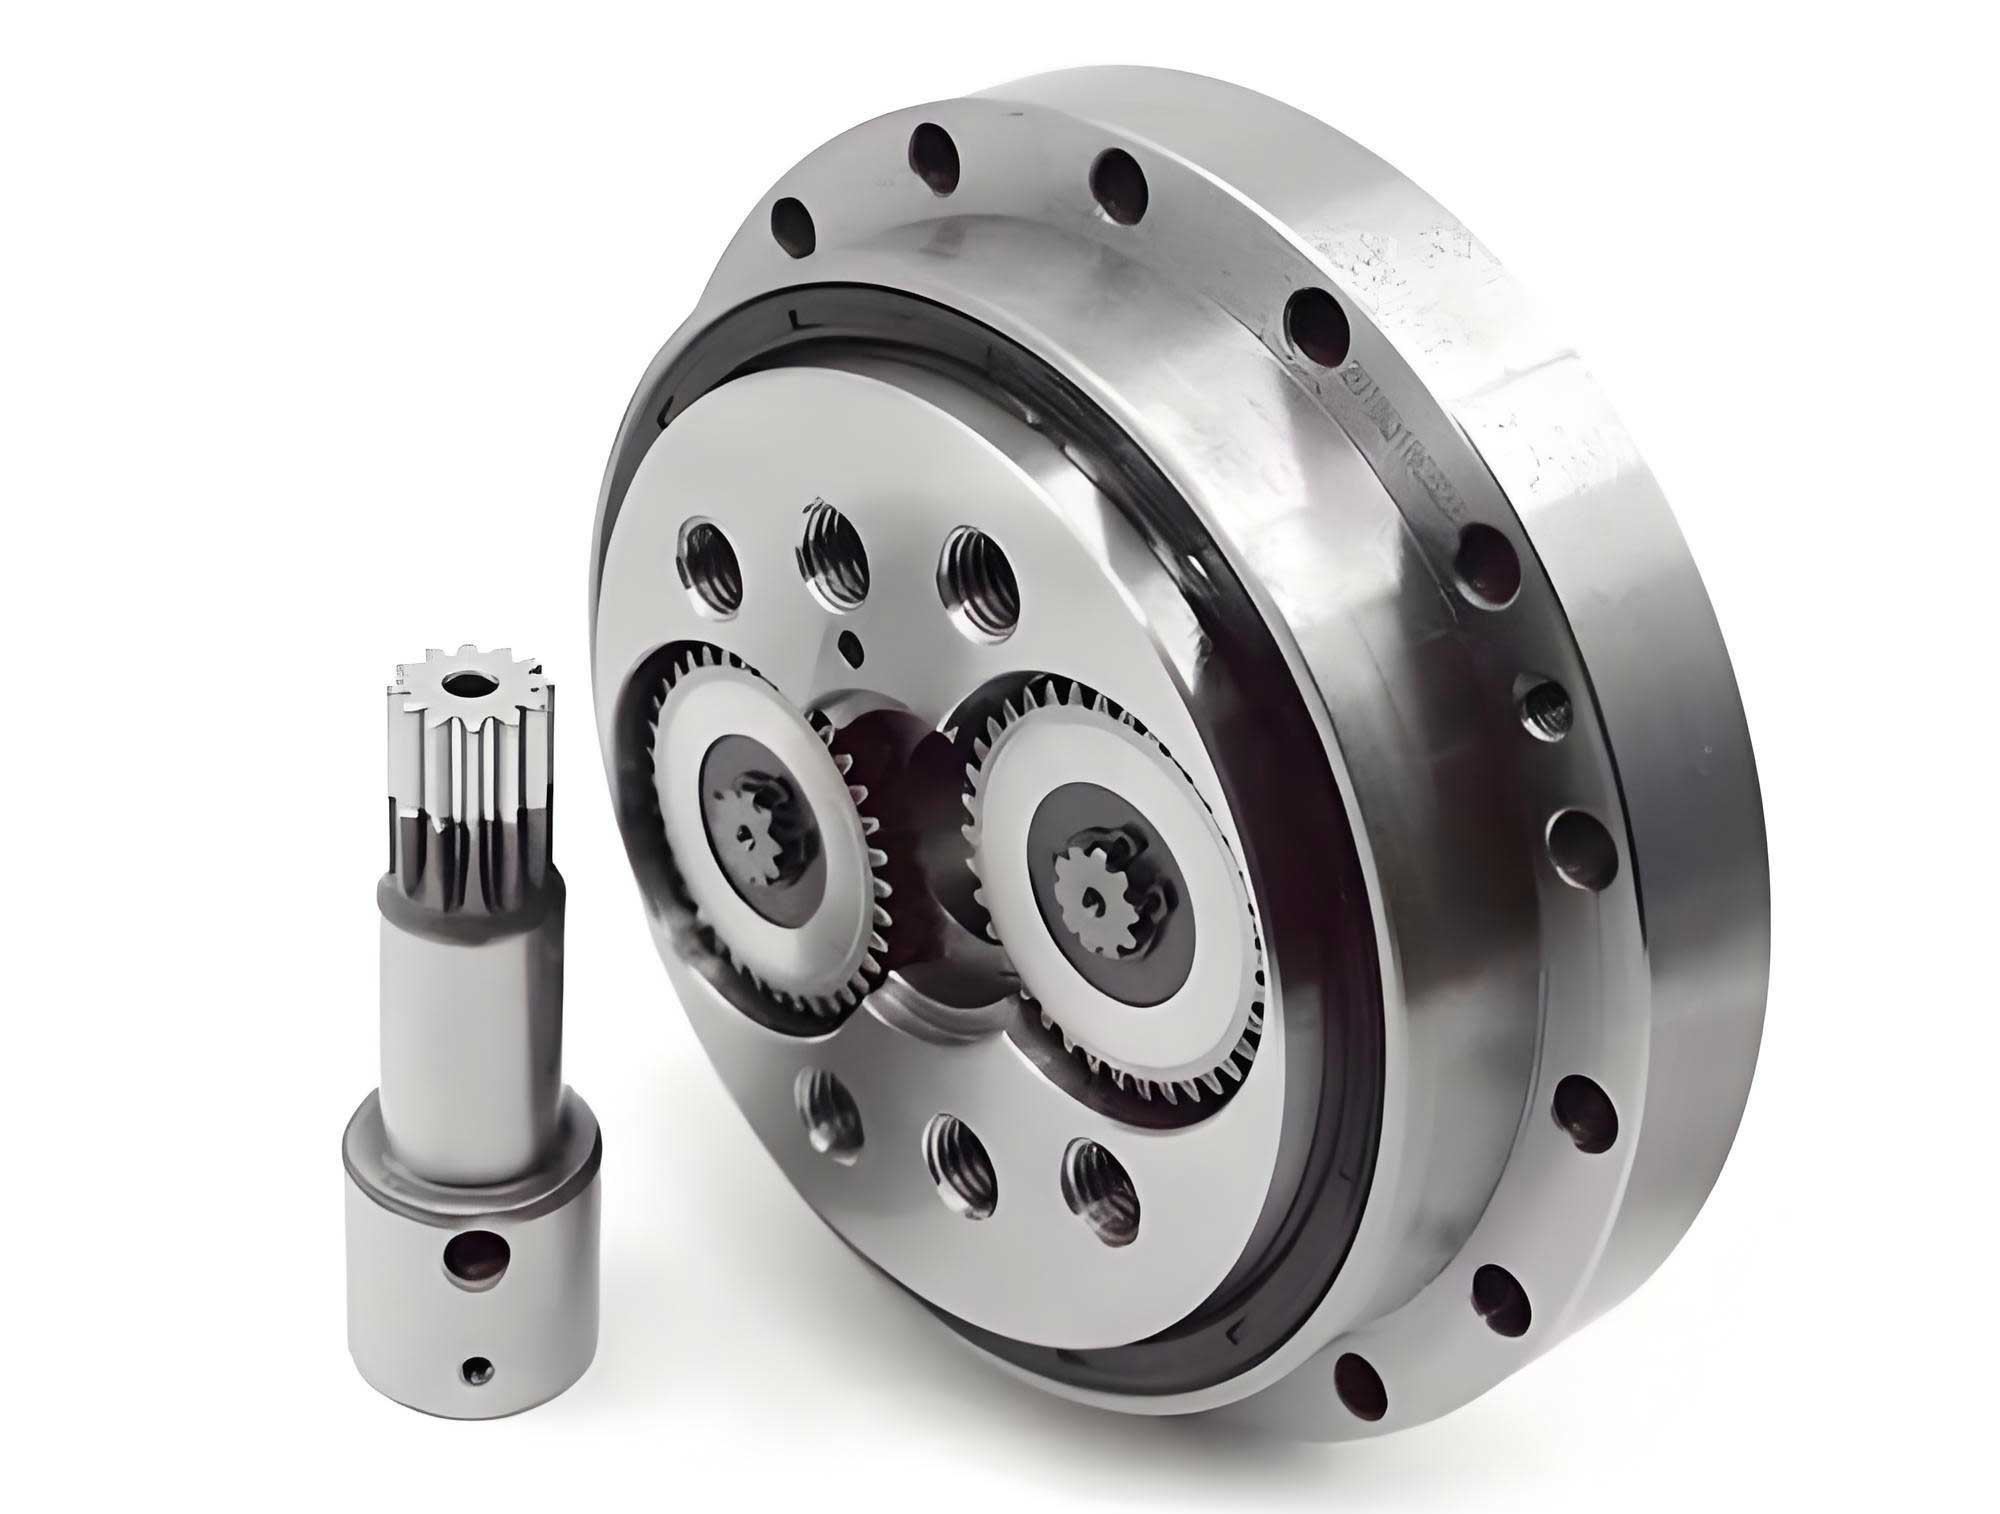
The rotary vector reducer operates on a two-stage planetary mechanism, combining a cycloidal drive with a traditional gear train. This design enhances torque density and precision, but it also introduces complexities in error propagation. The schematic illustrates the interplay between components such as the input shaft, planetary gears, cycloidal disks, needle bearings, and output shaft. Understanding this structure is essential for analyzing how transmission error accumulates and manifests during operation.
I first measured the transmission error under no-load conditions at input speeds of 10, 20, 30, and 40 r/min. For each speed, data were collected over a full rotation cycle, and the error values were computed using the formula above. The results are summarized in Table 1, which presents the minimum error, maximum error, and total error range for each speed setting.
| Input Speed (r/min) | Minimum Error (arcseconds) | Maximum Error (arcseconds) | Total Error Range (arcseconds) |
|---|---|---|---|
| 10 | -25 | 14 | 39 |
| 20 | -13 | 27 | 40 |
| 30 | -10 | 29 | 39 |
| 40 | -13 | 28 | 41 |
From Table 1, it is evident that the total error range remains relatively constant across different speeds, averaging around 40 arcseconds. However, the mean error tends to increase slightly with speed, likely due to heightened torsional forces and gear deformations. This suggests that while speed influences instantaneous error magnitudes, the overall error bandwidth is dominated by inherent factors like gear backlash and manufacturing tolerances in the rotary vector reducer.
Next, I evaluated the transmission error under loaded conditions, applying a nominal load to simulate real-world operation. The same input speeds were tested, and the results are compiled in Table 2. The load stabilizes the system by reducing vibrations, leading to slightly lower error ranges compared to no-load scenarios.
| Input Speed (r/min) | Minimum Error (arcseconds) | Maximum Error (arcseconds) | Total Error Range (arcseconds) |
|---|---|---|---|
| 10 | -23 | 13 | 36 |
| 20 | -13 | 26 | 39 |
| 30 | -8 | 28 | 36 |
| 40 | -12 | 27 | 39 |
Comparing Tables 1 and 2, the loaded condition generally yields smaller error ranges, indicating improved performance under stress. This is attributed to the damping effect of the load, which mitigates transient oscillations in the rotary vector reducer. Nonetheless, as speed increases, the error tends to rise, reflecting the impact of dynamic forces on gear meshing and alignment. The relationship between error \( E \), speed \( n \), and load \( L \) can be modeled empirically as:
$$E(n, L) = E_0 + \alpha n + \beta L^{-1}$$
where \( E_0 \) is the baseline error, and \( \alpha \) and \( \beta \) are coefficients derived from experimental data. This model highlights the trade-offs in optimizing a rotary vector reducer for different operational regimes.
To put these findings into context, I compared the performance of the tested rotary vector reducer with other commercially available models, including domestic products and the industry-leading Nabtesco rotary vector reducer. The results are presented in Table 3, focusing on the total transmission error range as a key metric. National standards often specify an error limit of 60 arcseconds for such devices, making this comparison crucial for assessing compliance and competitiveness.
| Manufacturer | Total Transmission Error Range (arcseconds) |
|---|---|
| Domestic Brand A | 47 |
| Domestic Brand B | 70 |
| Domestic Brand C | 59 |
| Nabtesco | 42 |
| Tested RV-40E (This Study) | 36-41 |
Table 3 reveals significant variability in the performance of rotary vector reducers. While some domestic products exceed the 60-arcsecond threshold, others approach or even surpass the Nabtesco benchmark. The tested RV-40E rotary vector reducer demonstrates error ranges between 36 and 41 arcseconds, indicating superior precision that aligns with international standards. This underscores the advancements in manufacturing and design for high-performance rotary vector reducers.
Delving deeper into the error mechanisms, I analyzed the contributions of individual components within the rotary vector reducer. The cycloidal disk and needle bearing assembly are particularly sensitive to errors due to their complex contact dynamics. The transmission error can be decomposed into geometric and elastic components:
$$E_{total} = E_{geo} + E_{elastic}$$
where \( E_{geo} \) stems from tooth profile deviations and assembly misalignments, and \( E_{elastic} \) arises from deformations under load. For a rotary vector reducer, \( E_{geo} \) often dominates, especially in low-load scenarios. Using statistical methods, the probable error can be estimated as:
$$E_{geo} = \sqrt{\sum_{i=1}^{n} \left( \frac{\partial E}{\partial x_i} \sigma_{x_i} \right)^2}$$
where \( x_i \) represents error sources like cycloidal tooth error or bearing clearance, and \( \sigma_{x_i} \) their standard deviations. This approach helps in pinpointing critical areas for quality control in rotary vector reducer production.
In addition to static error analysis, I examined the dynamic behavior of the rotary vector reducer by monitoring error fluctuations over time. At higher speeds, the error signal exhibits periodic patterns corresponding to gear rotation cycles. These patterns can be characterized using Fourier analysis, where the error \( E(t) \) is expressed as a sum of harmonic components:
$$E(t) = \sum_{k=1}^{N} A_k \sin(2\pi f_k t + \phi_k)$$
Here, \( A_k \), \( f_k \), and \( \phi_k \) represent the amplitude, frequency, and phase of each harmonic, respectively. For the rotary vector reducer, dominant frequencies often align with the meshing frequencies of the planetary and cycloidal stages. This analysis aids in diagnosing specific faults, such as worn teeth or imbalanced components, which are common in aging rotary vector reducers.
The experimental setup also allowed for efficiency measurements, which correlate with transmission error. Energy losses in a rotary vector reducer primarily result from friction and elastic hysteresis, both exacerbated by misalignments. The overall efficiency \( \eta \) can be approximated as:
$$\eta = \frac{T_{out} \omega_{out}}{T_{in} \omega_{in}} \times 100\%$$
where \( T \) and \( \omega \) denote torque and angular velocity, respectively. In our tests, the rotary vector reducer maintained efficiencies above 90% across all conditions, with error-induced losses contributing to the remainder. This highlights the economic imperative of minimizing transmission error in rotary vector reducers for sustainable operation.
Looking forward, the development of next-generation rotary vector reducers hinges on advanced materials and digital twins. For instance, using carbon-fiber composites or ceramic coatings can reduce weight and enhance stiffness, thereby lowering elastic errors. Meanwhile, simulation models that integrate finite element analysis (FEA) with multi-body dynamics can predict transmission error under virtual conditions, accelerating design iterations. The governing equations for such models often include terms for contact stiffness \( k_c \) and damping \( c_c \):
$$m \ddot{x} + c_c \dot{x} + k_c x = F_{ext}$$
where \( x \) is the displacement at the gear mesh, and \( F_{ext} \) the external force. By calibrating these models with experimental data, manufacturers can optimize the rotary vector reducer for minimal error across its lifespan.
In conclusion, this study comprehensively measures and analyzes the transmission error in a rotary vector reducer, revealing its dependence on input speed and load. The rotary vector reducer tested here shows error ranges within 36 to 41 arcseconds, outperforming many commercial counterparts and meeting stringent industry standards. Key findings include the stabilizing effect of load on error reduction and the near-constant error bandwidth across speeds, emphasizing the role of inherent design factors. For engineers and researchers, these insights offer a framework for enhancing the precision and reliability of rotary vector reducers through targeted improvements in manufacturing and assembly processes.
Future work should explore the long-term evolution of transmission error in rotary vector reducers under continuous operation, as well as the impact of environmental factors like temperature and contamination. Additionally, integrating real-time error compensation algorithms could further elevate the performance of rotary vector reducers in high-stakes applications such as aerospace and medical robotics. By embracing these challenges, the field can continue to advance the capabilities of rotary vector reducers as indispensable components in modern machinery.