
Friction is a phenomenon or characteristic where resistance is generated at the contact interface when two objects in contact have relative motion or a tendency for relative motion. In mechanical friction pairs, the phenomenon of friction is unavoidable during mutual motion; it is a ubiquitous physical occurrence. During gear transmission, a significant amount of energy is wasted in the form of friction. Simultaneously, friction factors degrade the transmission accuracy and efficiency of the gears themselves. Therefore, research into gear tribology has garnered high attention from advanced nations internationally. Gear tribology encompasses the friction, wear, and lubrication of gears, representing a specific industrial application of tribology.
Researching gear tribology based on experiments is a common approach, but such experiments consume substantial human and material resources, and the obtained results can contain errors. Consequently, conventional methods for studying gear tribology have become insufficient to meet requirements. With the advancement of computer technology alongside societal progress, numerical simulation techniques have begun to be employed for friction research.
Previous numerical simulation analyses of bevel gears often neglected tribological considerations from a dynamics perspective. Therefore, incorporating the influence of tribology in gear design is of significant guiding importance for gear optimization. This article applies virtual prototyping technology and finite element technology to conduct related simulation experiments on gear transmission systems. It investigates the influence of various factors on the tribology of bevel gears and provides suggestions and a reliable basis for the transmission design and optimization of bevel gears.
1. Dynamics Analysis of Bevel Gears
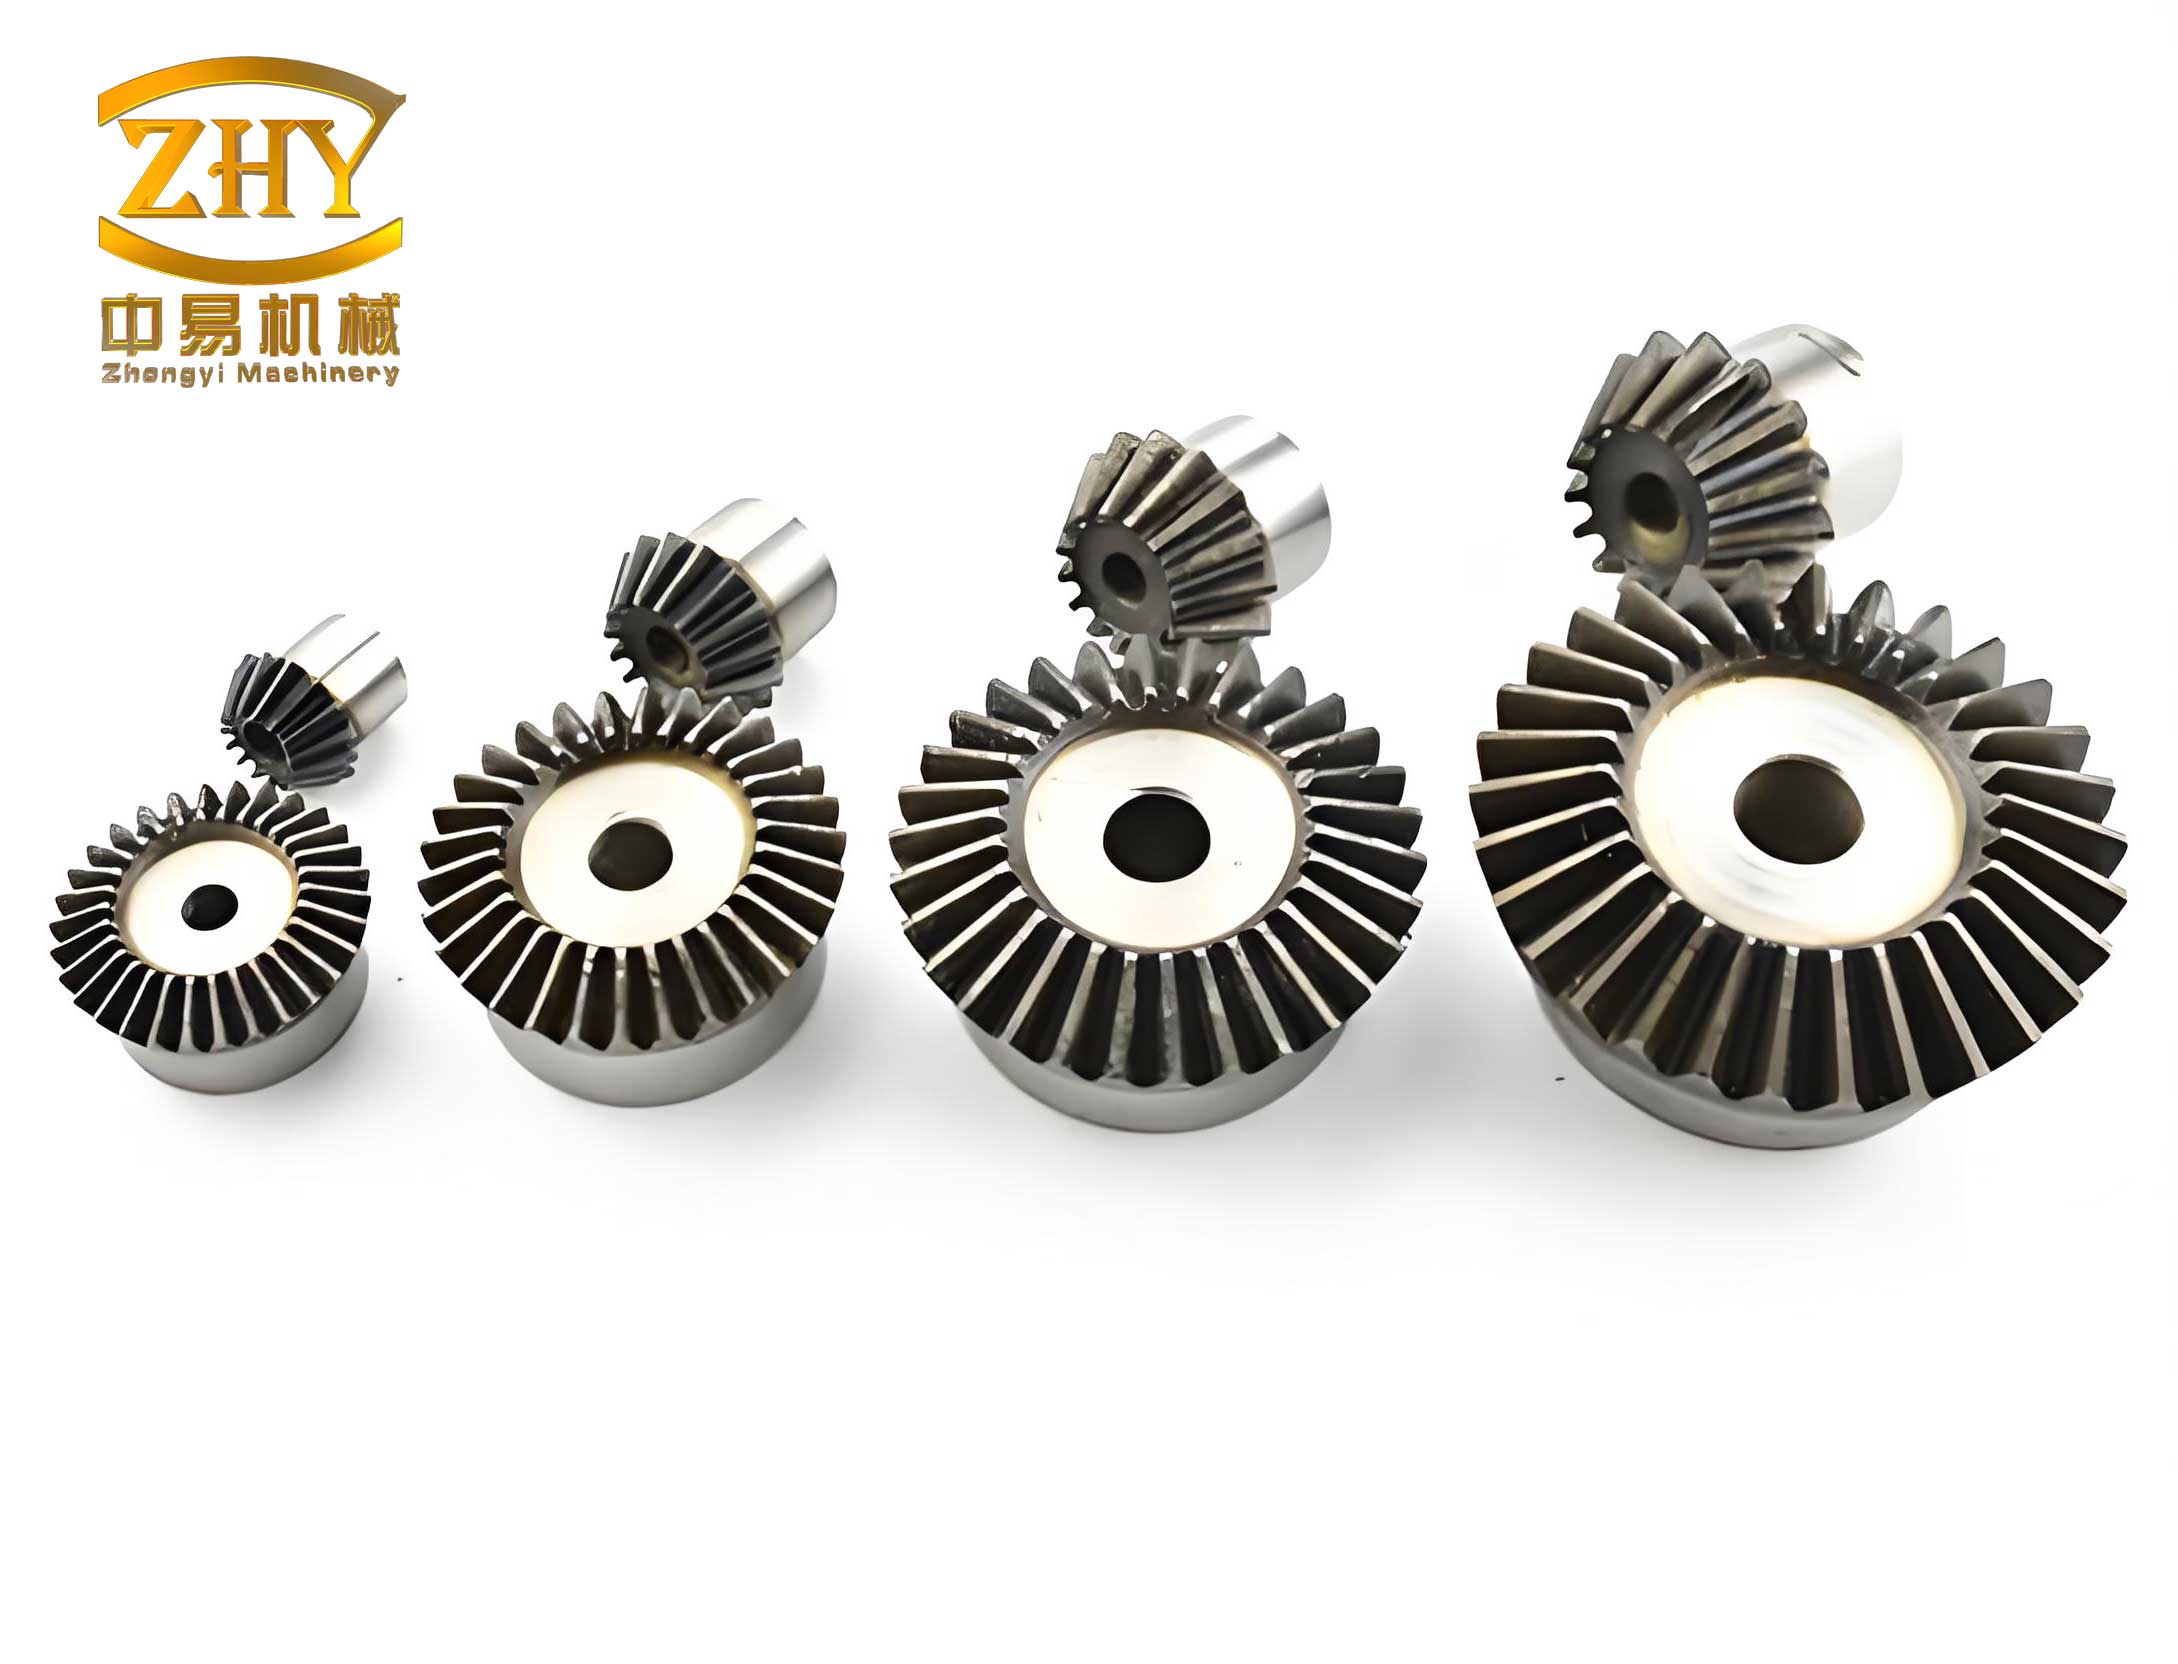
The three-dimensional model of the bevel gear was imported into ADAMS software. The known parameters are: input power of the bevel gear set is 1.6 kW, its maximum input speed is 960 r/min, and the transmission ratio is 4.2:1. The material selected for the pinion (driving gear) is 40Cr, and for the gear (driven gear) is 35SiMn, with a Poisson’s ratio $\nu$ = 0.3 and an Elastic modulus E = 211 GPa. Based on calculations, the boundary parameters were set as follows: contact stiffness $K = 7.69 \times 10^5 \text{ N/mm}$, damping coefficient $c = 50 \text{ N·s/mm}$, penetration depth $d = 0.1 \text{ mm}$; and force exponent $e = 1.5$. The resulting simulation model is depicted below.
Based on theoretical formulas, the theoretical results can be derived. The calculations involve the transmitted torque $T_1$, the pitch diameter at the mid-face $d_{m1}$, the tangential force $F_t$, and the resulting radial $F_r$ and axial $F_a$ forces, considering the pitch cone angle $\delta_1$ and pressure angle $\alpha_n$. For a given power $P$ and speed $n_1$:
$$T_1 = 9549 \times \frac{P}{n_1} \quad \text{(N·m)}$$
$$F_{t1} = \frac{2000 T_1}{d_{m1}}$$
$$F_{r1} = F_{t1} \cdot \frac{\tan \alpha_n \cos \delta_1}{\cos \beta_m} \quad \text{(For spiral bevel gears, simplified for straight bevel)}$$
$$F_{a1} = F_{t1} \cdot \frac{\tan \alpha_n \sin \delta_1}{\cos \beta_m}$$
For the analyzed bevel gear, the theoretical results are: Tangential force $F_{t1}$ = 1365.7 N; Radial force $F_{r1}$ = 468.5 N; Axial force $F_{a1}$ = 166.12 N. Regarding direction, the torque generated by the tangential force opposes the applied torque, radial forces point toward their respective centers, and axial forces point toward the large end of each gear.
In ADAMS, the materials for the driving and driven gears were first defined. Revolute joints were defined at the centers of both gears. Different rotational speeds were applied to the driving gear, while a load torque was applied to the driven gear. Contact was defined using a `contact` function for impact constraints. A dynamics simulation was set up for the prototype for 5 seconds with 50 steps.
To validate the correctness of the established simulation model, the simulation values at 376 r/min were compared with theoretical values. The radial and axial forces obtained from the simulation model for the bevel gear are shown in typical output curves. The comparison between the obtained simulation values and theoretical values is shown in Table 1, with errors within 5%, thus proving the correctness of the simulation model.
| Comparison Item | Theoretical Value (N) | Simulation Value (N) | Error (%) |
|---|---|---|---|
| Axial Meshing Force | 166.1 | 165.3 | 0.4 |
| Radial Meshing Force | 468.5 | 475.4 | 1.2 |
Based on the established simulation model, the contact stress and friction stress were studied for driving gear speeds of 400, 675, 750, and 800 r/min. Through simulation, the normal force and friction force at different speeds were obtained, with representative curve patterns. The average or peak values extracted from these simulations for different speeds are summarized in Table 2.
| Rotational Speed (r/min) | Friction Force, $F_f$ (N) | Normal Force, $F_n$ (N) |
|---|---|---|
| 400 | 38 | 487 |
| 675 | 41 | 530 |
| 750 | 49 | 545 |
| 800 | 53 | 560 |
The data in Table 2 clearly shows that as the rotational speed increases, both the friction force and the normal force also increase. The initial growth trend for both friction and normal force is gradual before becoming more rapid. Friction readily affects the transmission precision and efficiency of bevel gears, leading to high energy losses. Therefore, analyzing the relationship between speed and friction force is necessary. Extensive testing indicates that the magnitude of friction force is primarily related to the magnitude of the normal pressure and the roughness of the contact surfaces. The greater the applied pressure, the greater the sliding friction; the rougher the contact surfaces, the greater the sliding friction. From Table 2, it is evident that as normal force increases, friction force increases accordingly, further demonstrating the accuracy and reliability of the simulation model. The friction force can be related by:
$$F_f = \mu \cdot F_n$$
where $\mu$ is the coefficient of friction, which for lubricated conditions in this simulation was set to a constant value, explaining the proportional relationship observed in the trends.
2. Static Analysis of Bevel Gears
When performing finite element static analysis on bevel gears using ANSYS Workbench, using the entire gear as the analysis object results in a large number of nodes after meshing, increasing computational load, runtime, and memory requirements, which can ultimately affect result accuracy. This section primarily considers the stress and friction issues of a pair of bevel gear teeth from mesh-in to mesh-out during rotation. Therefore, the entire gear pair can be simplified to a segment representing the local meshing of a few teeth. This approach does not compromise the accuracy of the bevel gear analysis and improves the quality of the mesh without issues of sudden mesh transitions. The 3D software SolidWorks was used to simplify the bevel gear model. Based on the gear geometry, the rotation angles corresponding to five points from mesh-in to mesh-out were calculated as 0°, 4.26°, 6.49°, 10.00°, and 12.80°.
During the finite element analysis, the material for the driving bevel gear, 40Cr, had an elastic modulus E = 211 GPa, density $\rho$ = 7900 kg/m³, and Poisson’s ratio $\nu$ = 0.3. The material for the driven bevel gear, 35SiMn, had E = 212 GPa, $\rho$ = 7850 kg/m³, and $\nu$ = 0.31. These parameters were input into the material list to complete the material definition.
The tooth surface of the pinion was set as the contact surface, and the tooth surface of the gear was set as the target surface. The automatically set “Bonded” contact was changed to “Frictional.” Since it was oil-lubricated and the friction coefficient in the dynamics was set to 0.01, the friction coefficient here was also set to 0.01. All other settings were kept default. The 3D model was then meshed. Boundary conditions were applied to the simplified bevel gear segment. Based on the given power, the driving gear’s speed was calculated as 376 r/min and torque as 40,630 N·mm. According to actual working conditions, a cylindrical support constraint was applied to the inner surface of the driving gear, constraining its axial and radial displacement. The driven gear was then set as a fixed support. Finally, the torque was applied to the driving gear’s inner surface.
In ANSYS Workbench, a static structural analysis was performed on the bevel gear. The solution function was used to add Equivalent (von-Mises) Stress. The simulation yielded tooth contact stress and tooth root bending stress values. For verification, theoretical values for the bevel gear were calculated using standard gear stress formulas. The Hertzian contact stress $\sigma_H$ and bending stress $\sigma_F$ can be estimated by:
$$\sigma_H = Z_E Z_H Z_\epsilon \sqrt{\frac{F_t}{d_1 b} \frac{u \pm 1}{u}}$$
$$\sigma_F = \frac{F_t}{b m_n} Y_F Y_S Y_\beta K_A K_V K_{F\beta} K_{F\alpha}$$
Where $Z_E$ is the elasticity factor, $Z_H$ is the zone factor, $Z_\epsilon$ is the contact ratio factor, $F_t$ is tangential force, $d_1$ is reference diameter, $b$ is face width, $u$ is gear ratio, $m_n$ is normal module, $Y_F$ is form factor, $Y_S$ is stress correction factor, $Y_\beta$ is helix angle factor, and $K$ factors are various application, dynamic, and load distribution factors. The theoretical calculated tooth contact stress and tooth root bending stress were approximately 730.6 MPa and 320.4 MPa, respectively. The simulation values showed an error of less than 5% compared to the theoretical calculations, which is within the acceptable error margin. This fully demonstrates the correctness of the applied boundary conditions and lays the foundation for subsequent research.
Using the Mechanical module in ANSYS Workbench, static analyses were performed for the bevel gear at five different meshing positions under different driving gear speeds: 400, 675, 750, and 800 r/min. The load torque for each speed was calculated based on the constant input power of 1.6 kW using the relation $T = 9549 \times P / n$.
Based on the obtained simulation values, line graphs for the equivalent contact stress and equivalent bending stress at different rotation angles for various speeds were plotted. The data shows trends for the maximum equivalent contact stress and maximum equivalent bending stress.
At the same rotational speed, analyzing the equivalent contact stress and equivalent bending stress at different meshing positions reveals from the line graphs that the equivalent stress exhibits a trend of first increasing, then decreasing, and then increasing again. The reason is: during the initial meshing process of a pair of gear teeth, it starts as single-tooth contact. Therefore, the initial equivalent contact and bending stresses gradually increase. As the gear rotates, the tooth pair transitions from single-tooth contact to double-tooth contact, where the contact ratio is greater than 1, causing the equivalent stress to decrease. When the tooth pair is meshing out, the gear re-enters a state of single-tooth contact, so the equivalent stress increases again.
3. Comparative Analysis of Dynamic and Static Results for Bevel Gears
The stress field obtained by substituting the load spectrum from the dynamics analysis of the bevel gear into the finite element analysis software is compared with the stress field obtained from the static analysis. Following the stress field calculation procedure, the obtained normal forces were converted into torques, replacing the loads in the static analysis, to obtain stress contours for speeds of 400, 675, 750, and 800 r/min. Representative comparisons of the stress fields are conceptually described. The specific comparative data extracted from these analyses is organized in Table 3.
| Rotational Speed (r/min) | Stress from Static Analysis (MPa) | Stress from Dynamic Analysis (MPa) |
|---|---|---|
| 400 | 683.44 | 649.93 |
| 675 | 451.60 | 418.31 |
| 750 | 422.01 | 392.16 |
| 800 | 407.54 | 398.67 |
From the data sets in Table 3, it can be clearly seen that at the same rotational speed, the stress field obtained by substituting the load spectrum from the dynamics analysis into the finite element software is generally smaller than the stress field obtained from the pure static analysis. Analyzing the mechanical performance of the bevel gear through dynamics simulation better reflects the real situation, as it accounts for inertial effects, damping, and transient load sharing more accurately than a sequence of static positions. This approach can therefore provide more accurate guidance for optimal design.
4. Conclusion
1) Through dynamic simulation analysis of the bevel gear, the variation law was obtained that both the normal force and friction force between meshing teeth increase with increasing rotational speed during the meshing process.
2) Static analysis of the bevel gear revealed that at the same rotational speed, the equivalent contact stress and equivalent bending stress of the gear increase initially, then decrease, and then increase again as the rotation angle increases, corresponding to transitions in the contact ratio from single to double and back to single tooth contact.
3) Comparative analysis of the stress fields obtained from dynamic and static analyses indicates that the stress field obtained from dynamic simulation more realistically reflects the actual conditions during the meshing process of the bevel gear. This comprehensive approach, combining multi-body dynamics for load prediction with detailed finite element analysis for stress evaluation, provides a more reliable theoretical reference for the optimization design of bevel gears.