
When the input speed frequency is 10Hz, the displacement response of master-slave gear XP is selected as the analysis object. The time domain signal and frequency domain diagram obtained by simulation are shown in Figure 1. The displacement time-domain signal in Fig. 1 (a) shows that the displacement of the gear increases rapidly in the process of alternate single double meshing and alternate gear tooth meshing, and tends to be stable due to the effect of damping. The displacement response presents periodic changes, which also shows that the system is stable under the action of continuous load. At the same time, the phase diagram of the relationship between master-slave gear XP and DXP / DT is drawn (Fig. 1 (b)). The curve change in the diagram shows that the system presents a closed-loop effect, which further shows the stability of the system. Figure 1 (c) shows the spectrum based on fast Fourier transform. Due to the low input speed of the system, there is no obvious sideband effect in the spectrum, and the amplitude is relatively concentrated.


Fig. 1, Fig. 2 and Fig. 3 respectively plot the displacement response signals of master-slave gears at different input speed frequencies of 10 Hz, 30 Hz and 50 Hz. It can be seen from the figure that the system is in a stable state at different speeds, while the spectrum diagram shows that with the increase of speed, the sideband effect of signal response becomes more and more obvious. In order to better compare the influence of speed on the dynamic characteristics of gears, the specific statistical data are shown in Table 1. It can be seen from the data in the table that with the increase of speed, the displacement response amplitude of the driving gear increases, and the difference between the peak value and the valley value of the amplitude also increases. At the same time, the kurtosis, shape coefficient and wave crest coefficient of the displacement time domain signal have a small effect.
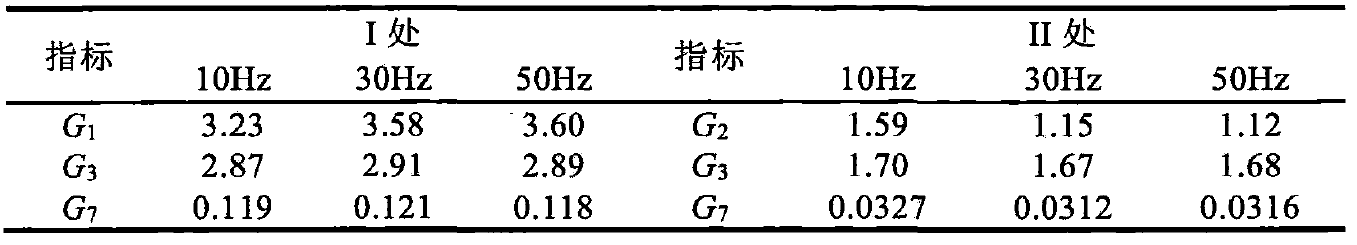
At the same time, the time domain signal and statistical index statistical value of dynamic transmission error (hereinafter referred to as DTE) between gear pairs at different input speed frequencies are shown in Fig. 4 and table 2. In order to analyze the effect of DTE change between gear pairs in more detail, the statistical values at I and II in Fig. 4 (a) are selected for comparison. The statistical results show that the maximum value at I increases slightly with the increase of speed, and the minimum value at II decreases slightly with the increase of speed. The average value G3 and standard deviation G7 show similar values, which indicates that the DTE signals of the system are similar, and the response amplitude of DTE changes with different rotating speeds.