
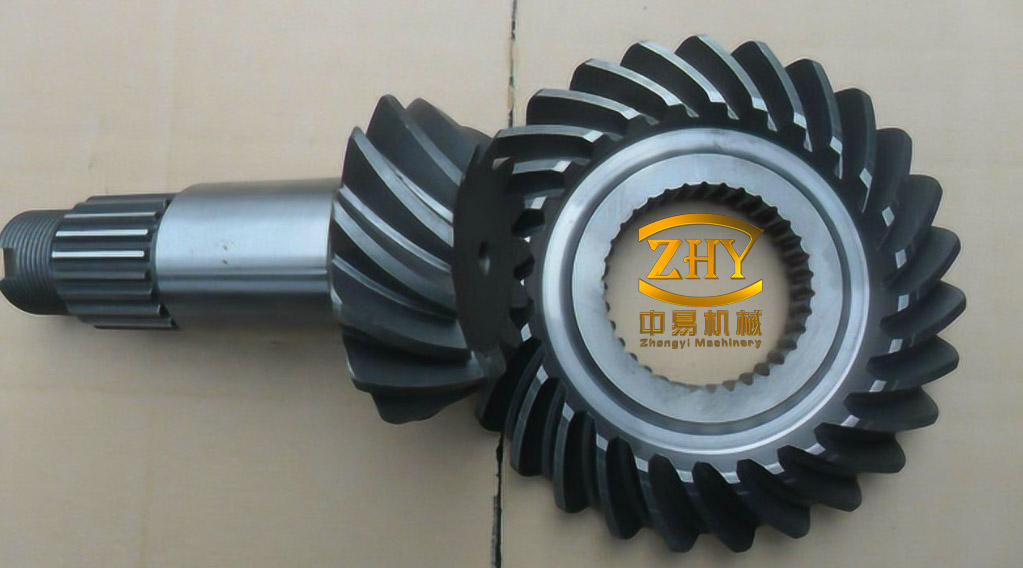
A spiral bevel gear transmits rotation between intersecting shafts through teeth whose traces are curved and oblique rather than straight. The gradual, rolling nature of that contact gives the pair a higher contact ratio and greater load capacity than a comparable straight bevel set, which is why spiral bevel gears dominate final drives, rotorcraft tail transmissions, and precision machine tool spindles. The same oblique geometry, however, makes the mesh stiffness fluctuate strongly through a revolution, and the combination of time-varying stiffness, backlash, and static transmission error turns the gear pair into a parametrically excited nonlinear oscillator. Its steady response does not simply grow with speed: it can jump between periodic, multi-periodic, quasi-periodic, and chaotic states, and the boundary between them is not obvious from a spectrum or a time trace alone.
What makes the mesh nonlinear
Three ingredients dominate the dynamics. First, the number of teeth in contact changes as the gears rotate, so the mesh stiffness is periodic in the mesh frequency rather than constant. Second, backlash introduces a dead zone: the force transmitted across the mesh is a piecewise-linear function of the relative displacement, vanishing while the flanks separate. Third, the static transmission error—manufacturing deviation and elastic deflection under load—acts as an external, mesh-frequency-periodic excitation even when the input torque is perfectly constant.
Beyond these, the tooth contact of a spiral bevel pair is three-dimensional. Unlike a spur gear, where the plane of action can be treated as a single line of action, the normal at the mesh point of a bevel pair has components in all three coordinate directions, and those components are governed by the spiral angle and the pitch-cone angle. A faithful model therefore needs coupled translational and rotational coordinates for each member.
Eight-degree-of-freedom model of the gear pair
Treating both gears as rigid bodies, each displacing and rotating about its own centre, yields the coordinate set $\{X_1,Y_1,Z_1,\theta_1,X_2,Y_2,Z_2,\theta_2\}$. Gear 1 is the driver, loaded by $T_1=T_{1m}+T_{1v}$, a mean torque plus a fluctuating component; gear 2 carries the load $T_2$. The relative displacement of the two tooth flanks along the common normal, produced jointly by vibration and by transmission error, is
$$\lambda_n=(X_1-X_2)c_1-(Y_1-Y_2)c_2-(Z_1-Z_2+r_1\theta_1-r_2\theta_2)c_3-e_n(t)$$
where $r_1$ and $r_2$ are the mesh-point radii and $e_n(t)$ is the normal static transmission error, represented by its harmonic series
$$e_n(t)=\sum_{l=1}^{N_e}A_{el}\cos(l\Omega_h t+\Phi_{el})$$
with $\Omega_h$ the mesh frequency and $A_{el}$, $\Phi_{el}$ the amplitude and phase of the $l$-th harmonic. The normal dynamic force across the mesh and its three Cartesian projections are
$$F_n=k_h(t)f(\lambda_n)+c_h\dot\lambda_n$$
$$F_x=-F_n\left(\sin\alpha_n\sin\beta_m+\cos\alpha_n\sin\beta_m\sin\delta_1\right)$$
$$F_y=F_n\left(\sin\alpha_n\sin\delta_1-\cos\alpha_n\sin\beta_m\cos\delta_1\right)$$
$$F_z=F_n\cos\alpha_n\sin\beta_m$$
with $c_h$ the mesh damping, $k_h(t)$ the time-varying mesh stiffness, and $f(\lambda_n)$ the backlash function. The stiffness is expanded about its mean $k_m$, and the backlash function is the symmetric dead-zone characteristic with half-width $b_m$:
$$k_h(t)=k_m+\sum_{l=1}^{N_k}A_{kl}\cos(l\Omega_h t+\Phi_{kl})$$
$$f(\lambda_n)=\begin{cases}\lambda_n-b_m & \lambda_n>b_m\\ \lambda_n & |\lambda_n|\le b_m\\ \lambda_n+b_m & \lambda_n<-b_m\end{cases}$$
Normalizing displacements by the characteristic length $b_c$, time by $\omega_n t$ with $\omega_n=\sqrt{k_m/m_e}$ and $m_e=J_1J_2/(r_1^2J_2+r_2^2J_1)$, and damping by $2m_j\omega_n$, produces a dimensionless set in which the mesh frequency appears as the ratio $\omega_h=\Omega_h/\omega_n$. Writing only the three translational equations of gear 1 and the coupled relative-motion equation, the system reads
$$\ddot x_1+2\xi_{x1}\dot x_1+2\xi_{h1}c_4\dot\lambda+k_{x1}x_1+k_{h1}f(\lambda)=0$$
$$\ddot y_1+2\xi_{y1}\dot y_1-2\xi_{h1}c_5\dot\lambda+k_{y1}y_1-k_{h1}f(\lambda)=0$$
$$\ddot z_1+2\xi_{z1}\dot z_1-2\xi_{h1}c_6\dot\lambda+k_{z1}z_1-k_{h1}f(\lambda)=0$$
$$-c_1\ddot x_1+c_2\ddot y_1+c_3\ddot z_1+c_1\ddot x_2-c_2\ddot y_2-c_3\ddot z_2+\ddot\lambda+2\xi_m c_6\dot\lambda+\tilde k_h c_6 f(\lambda)=f_{1m}+f_{1v}+f_e$$
The gear-2 equations differ only in the signs of the coupling terms. The geometric coefficients follow from the normal pressure angle $\alpha_n$, the mid-face spiral angle $\beta_m$, and the pitch-cone angle $\delta_1$:
$$c_1=\cos\delta_1\sin\alpha_n,\quad c_2=\cos\delta_1\cos\alpha_n\sin\beta_m,\quad c_3=\cos\alpha_n\cos\beta_m$$
$$c_4=\sin\alpha_n\cos\beta_m+\cos\alpha_n\sin\beta_m\sin\delta_1,\quad c_5=\sin\alpha_n\sin\delta_1-\cos\alpha_n\sin\beta_m\cos\delta_1,\quad c_6=\cos\alpha_n\sin\beta_m$$
Higher harmonics of the stiffness and error excitations contribute little in the parameter range of interest, so the fundamental alone is retained: $\tilde k_h=k_h/k_m=1+\varepsilon\cos(\omega_h\tau+\Phi_k)$ and $f_e=\gamma\omega_h^2\cos(\omega_h\tau+\Phi_e)$. Here $\varepsilon$ is the stiffness fluctuation coefficient—the ratio of the first harmonic amplitude of mesh stiffness to its mean—and $\gamma$ is the corresponding static transmission error coefficient. The numerical study uses $\beta_m=35^\circ$, $\alpha_n=20^\circ$, $\xi_{ij}=0.01$, $\xi_{h1}=\xi_{h2}=0.0125$, $\xi_h=0.05$, $k_{ij}=1.25$, $k_{h1}=k_{h2}=0.5$, $f_{pm}=0.5$, and $\gamma=0.2$. Integration of the dimensionless system yields the displacement time series whose structure is analysed below.
Reading a gear response through phase space and recurrence
A single measured or computed coordinate carries the imprint of the full multi-dimensional state. Taken’s embedding theorem formalizes this: a scalar series $\{x(t)\}$ delayed by $\tau$ and stacked $m$ times reconstructs a space in which the original attractor is topologically preserved,
$$X_t=\left[x(t),x(t+\tau),x(t+2\tau),\ldots,x(t+(m-1)\tau)\right]$$
Two parameters must be chosen. The delay $\tau$ is taken where the autocorrelation
$$C(\tau)=\frac{1}{N}\sum_i x(i+\tau)x(i)$$
first falls to $C(0)/e$; a shorter delay collapses the attractor onto the diagonal, a longer one decorrelates the coordinates and destroys structure. The embedding dimension comes from the false-nearest-neighbour criterion, which tracks how the distance to the nearest neighbour changes when the dimension is raised from $m$ to $m+1$:
$$f_m(t)=\left[\frac{R_{m+1}^2(t)-R_m^2(t)}{R_m^2(t)}\right]^{1/2}=\frac{\left|x(t+m\tau)-x_{NN}(t+m\tau)\right|}{R_m(t)}$$
When $f_m(t)$ stops changing appreciably with $m$, the attractor has unfolded and the corresponding $m$ is adopted.
A recurrence plot then converts the trajectory into a two-dimensional image of when the system revisits a neighbourhood of a previous state:
$$R_{ij}=\Theta\left(\varepsilon-\left\|X_i-X_j\right\|\right),\qquad i,j=1,\ldots,N$$
where $\Theta$ is the Heaviside function and $\varepsilon$ the neighbourhood threshold. A recurrence counts as a black dot, so the plot is symmetric about the main diagonal. The threshold is not free: it is set so that the recurrence rate—the fraction of black dots—falls near 0.02, inside the 0.01–0.05 band that keeps plots comparable across operating conditions. Too small a threshold leaves dense, featureless speckle; too large a one leaves mostly white space.
Plot texture is diagnostic. Uniform structure indicates a stochastic signal; drifting structure, with dense black regions on one side of the diagonal and white on the other, indicates a slowly changing parameter or a trend; disrupted structure, with large blocks, indicates abrupt parameter change; periodic structure, with long lines parallel to the main diagonal, indicates oscillation, and the spacing between those lines gives the period. Three scalar measures make the reading quantitative. The recurrence rate $RR$ normalizes the count of recurrent points; the recurrence entropy $ENTR$ is the Shannon entropy of the diagonal-line length distribution $p(l)$ and grows with the complexity of the trajectory; the trapping time $TT$ is the mean length of vertical structures and measures how long the system lingers in a neighbourhood before moving on:
$$RR=\frac{1}{N^2}\sum_{i,j=1}^{N}R_{ij}$$
$$ENTR=-\sum_{l=l_{min}}^{N}p(l)\ln p(l)$$
$$TT=\frac{\sum_{v=v_{min}}^{N}vP(v)}{\sum_{v=v_{min}}^{N}P(v)}$$
$ENTR$ is built from diagonal lines and is sensitive to transitions between chaos and periodicity; $TT$ is built from vertical lines and is sensitive to transitions within chaotic regimes.
Mesh frequency: a chaotic window near $\omega_h=1.65$
Sweeping the dimensionless mesh frequency from 0.30 to 2.00 at $\varepsilon=0.2$ and $\xi_m=0.05$ moves the response through several distinct regimes. At $\omega_h=0.30$, 0.55, and 0.90 the reconstructed attractors are elliptical closed curves with amplitude ranges of 1.5–2.5, 1.8–2.1, and 1.8–2.0 respectively, and the recurrence plots contain only diagonal-parallel lines whose spacing differs from case to case—periodic motion, but with a different period in each. At $\omega_h=0.70$ the attractor tightens to 1.92–1.96 and the recurrence plot shows both short segmented lines and long lines, the signature of a period-2 orbit. At $\omega_h=1.30$ the attractor narrows further to 1.85–2.00 in a multi-periodic state.
The behaviour changes character at $\omega_h=1.65$. There the trajectories wind around and cross one another, the amplitude range expands to roughly $-2$ to 5, and the recurrence plot develops a regular yet intricate pattern characteristic of a strange attractor. Both quantification measures peak: $ENTR=5.9390$ and $TT=27.6131$, the largest values in the whole sweep. Beyond this window the system recovers: at $\omega_h=1.85$ and 2.00 the plots again show long parallel lines, indicating quasi-periodic motion, with amplitude ranges of 0.5–3.5 and 1.5–2.5.
| $\omega_h$ | RR | ENTR | TT | Response inferred |
|---|---|---|---|---|
| 0.30 | 0.01992 | 5.6903 | 23.7937 | periodic, wide orbit |
| 0.55 | 0.02009 | 4.0923 | 13.0949 | periodic |
| 0.70 | 0.02015 | 5.9160 | 10.3184 | period-2 |
| 0.90 | 0.01904 | 4.8286 | 15.4563 | periodic, distorted attractor |
| 1.30 | 0.02085 | 5.0137 | 5.7481 | multi-periodic |
| 1.65 | 0.02066 | 5.9390 | 27.6131 | chaotic |
| 1.85 | 0.02071 | 4.6106 | 4.0128 | quasi-periodic |
| 2.00 | 0.02031 | 4.5170 | 3.6408 | quasi-periodic |
The table also cautions against reading a single index in isolation. $TT$ reaches 23.79 at $\omega_h=0.30$, almost as large as at the chaotic operating point, even though the attractor there is a simple closed curve. A long residence time in a slowly traversed periodic orbit produces the same vertical-line statistic as chaotic wandering, so $TT$ must be interpreted alongside $ENTR$ and the plot texture rather than as a stand-alone chaos indicator.
Stiffness fluctuation: a non-monotonic path to and from chaos
Holding $\omega_h=1.65$ and varying the stiffness fluctuation coefficient produces a response that alternates between ordered and disordered states rather than degrading monotonically. At $\xi_m=0.05$, the attractor begins as a single regular loop at $\varepsilon=0.1$, becomes tangled at $\varepsilon=0.5$—where the recurrence plot breaks into short diagonal segments with irregular spacing, and where $TT$ reaches its maximum of 44.6562—and passes through a multi-periodic stage at $\varepsilon=0.6$ before returning to single closed curves at $\varepsilon=0.8$ and $1.0$. The largest $\varepsilon$ gives both the smallest amplitude range and the lowest entropy, 3.9290.
At the higher damping level $\xi_m=0.07$ the sequence shifts. The drifting structure that appears at $\varepsilon=0.3$, with dense recurrence above the diagonal and a white lower-left region, indicates a non-stationary, trending trajectory rather than a settled attractor. $\varepsilon=0.5$ gives a regular pattern with vertical lines, consistent with multi-periodic motion; $\varepsilon=0.6$ produces scattered points and blocks coexisting, with $ENTR=5.2858$ and $TT=38.3728$, the most complex state in this series; and $\varepsilon=0.1$, 0.8, and 1.0 remain periodic.
| $\varepsilon$ | $\xi_m=0.05$ | $\xi_m=0.07$ | ||||
|---|---|---|---|---|---|---|
| RR | ENTR | TT | RR | ENTR | TT | |
| 0.1 | 0.0203 | 4.9762 | 4.4200 | 0.0204 | 4.0680 | 4.4279 |
| 0.3 | 0.0206 | 4.9004 | 17.8529 | 0.0209 | 4.8913 | 18.1799 |
| 0.5 | 0.0197 | 5.1669 | 44.6562 | 0.0210 | 5.0877 | 18.2166 |
| 0.6 | 0.0196 | 5.3563 | 19.1473 | 0.0204 | 5.2858 | 38.3728 |
| 0.8 | 0.0203 | 4.0895 | 4.3997 | 0.0208 | 3.9940 | 4.5159 |
| 1.0 | 0.0192 | 3.9290 | 4.1642 | 0.0201 | 4.4031 | 4.3746 |
Two features deserve emphasis. The worst case moves from $\varepsilon=0.5$ to $\varepsilon=0.6$ when damping is raised, so the instability is not tied to a fixed stiffness value but to a combination of parameters. And although a larger $\varepsilon$ means a stiffer mesh whose instantaneous stiffness swings more widely, the largest values examined here consistently produce the simplest response—an outcome that follows from the piecewise-linear backlash characteristic, where strong stiffness modulation can lock the response into a periodic orbit instead of feeding energy into chaotic motion.
Damping: the most reliable stabilizer
At $\omega_h=1.65$, varying $\xi_m$ from 0.01 to 0.10 produces the same qualitative story at both stiffness levels examined, $\varepsilon=0.2$ and $\varepsilon=0.5$. Increasing damping from 0.01 first complicates the motion: the attractor winds and overlaps, and vertical black lines appear in the recurrence plot at $\xi_m=0.05$ and 0.07, indicating that the trajectory pauses recurrently in particular regions. A further increase to $\xi_m=0.10$ restores a single regular closed curve, and the amplitude range contracts from roughly $-3$ to 5 down to 1–3. In every case the recurrence plot retains long diagonal lines, so the response never loses its deterministic, oscillatory core.
| $\xi_m$ | $\varepsilon=0.2$ | $\varepsilon=0.5$ | ||||
|---|---|---|---|---|---|---|
| RR | ENTR | TT | RR | ENTR | TT | |
| 0.01 | 0.0202 | 4.7725 | 17.5770 | 0.0192 | 4.6865 | 19.8113 |
| 0.05 | 0.0200 | 4.9910 | 29.3635 | 0.0197 | 5.1669 | 44.6562 |
| 0.07 | 0.0196 | 5.7224 | 18.6100 | 0.0190 | 5.2409 | 38.8932 |
| 0.10 | 0.0211 | 4.0549 | 4.5733 | 0.0204 | 5.0867 | 17.7056 |
The two indices separate cleanly here. $TT$ peaks at $\xi_m=0.05$ in both series (29.36 and 44.66), while $ENTR$ peaks at $\xi_m=0.07$ (5.7224 and 5.2409). Both fall to their lowest values at $\xi_m=0.10$, where the attractor is a single closed curve and the recurrence plot contains nothing but diagonal-parallel lines. Among the three parameters examined, damping is the one whose highest value most consistently delivers a simple, compact, periodic response across the other parameter settings tested.
Operating implications for spiral bevel gear design
The practical reading of these results is a three-part rule for the parameter window studied. Keep the mesh frequency out of the chaotic band around $\omega_h=1.65$, which corresponds to about 1.65 times the reference natural frequency $\sqrt{k_m/m_e}$ of the dimensionless model; operate with a large stiffness fluctuation coefficient; and operate with large mesh damping. The first is a speed-selection constraint on the gear ratio and tooth count, the second and third are design levers—tooth form and contact ratio on one side, material damping and lubrication on the other.
The results are specific to the modelling assumptions and should be read with them in mind. The gears are rigid bodies, shafts, bearings, and housing flexibility are absent, the mesh stiffness and transmission error are truncated to their fundamental harmonics, and friction, lubrication film dynamics, and thermal effects are not represented. The chaotic window at $\omega_h=1.65$ is a property of this normalized parameter set, not a universal constant; changing the mean load, the backlash half-width, or the excitation phase will shift its location and width. Recurrence quantification adds a further layer of conditionality: $RR$, $ENTR$, and $TT$ all depend on the embedding dimension, the delay, and the threshold, so comparisons are only valid when those settings are held at the values used here—an embedding dimension from the false-nearest-neighbour criterion, a delay from the autocorrelation decay, and a threshold set to a recurrence rate near 0.02.
Within those limits, the combination of phase-space reconstruction, recurrence plots, and recurrence quantification offers something a Fourier spectrum cannot: a qualitative picture of the attractor’s geometry together with quantitative scalars that track the transition from ordered to chaotic motion. For a spiral bevel gear pair, where the mesh stiffness varies strongly within each revolution and the response can jump between regimes as speed changes, that combination is a practical diagnostic for locating the speeds and stiffness values at which smooth transmission gives way to chaotic vibration.