
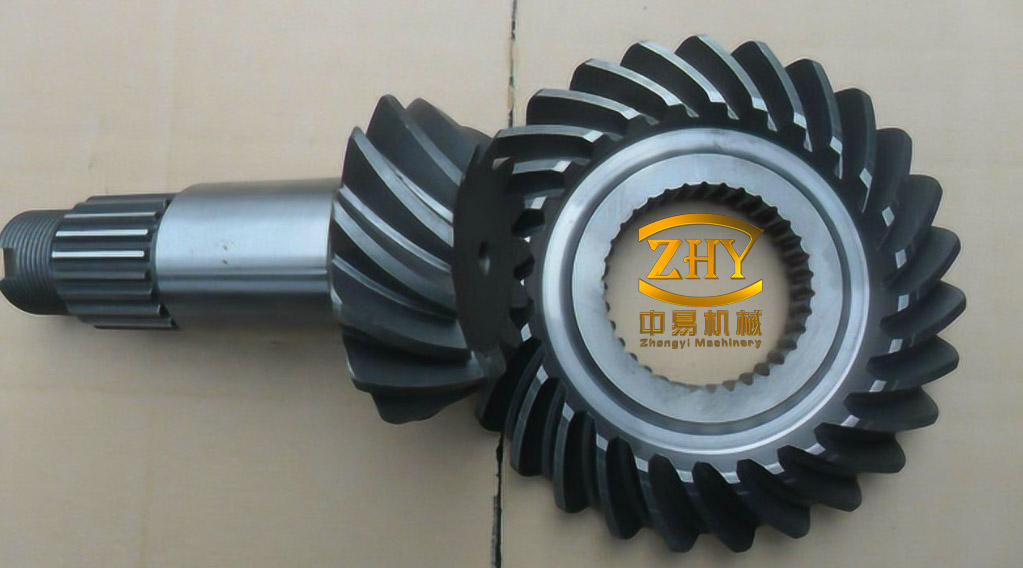
The distortion problem in hardened spiral bevel gears
Spiral bevel gears carry motion between intersecting shafts in rear axles, marine drives, mining machinery and helicopter transmissions. Their flanks are generated as a locally conjugate pair rather than a fully conjugate one: contact is deliberately confined to a small zone near the middle of the tooth and is allowed to migrate under misalignment instead of running to the tooth edges, where edge loading would cause premature failure. That design intent depends entirely on the flank geometry that actually leaves the machine tool, and on how much of it survives heat treatment.
Case carburizing and quenching are what give the teeth their hardness and their residual compressive stress, but the same cycle also displaces the flank. Thermal stress and transformation stress act together with furnace loading practice, quench-medium cooling rate and material hardenability, and the net result is a flank that no longer matches the theoretical surface. The absolute magnitude is small — tens of micrometres — yet the contact pattern and the transmission-error amplitude respond to it almost immediately, and the subsequent hard finishing operation must remove the resulting stock inhomogeneity.
The industry response has been to shift from controlling contact pattern by trial fitting to controlling flank geometry directly. Coordinate measuring centres made the digitized flank measurable, and closed manufacturing loops followed: Gleason’s G-AGE evaluation software inside its GEMS environment, Oerlikon’s CDS system and Klingelnberg’s KIMoS loop all compare a measured flank with the design flank and feed correction values back to the machine settings. Correction methods of this type — sensitive-matrix approaches, ease-off topology correction, trust-region Levenberg–Marquardt fitting of the target flank — are well established for geometric error.
Heat-treatment distortion is a different kind of error. It is not deterministic for a given setting; it varies from part to part within a batch, and its statistics are what repeat, not its exact value. Correcting the machine from two or three measured parts therefore folds part-to-part scatter into the compensation. The approach described here treats the post-hardening deviation as a batch statistic: a small sample of parts is resampled with the bootstrap to estimate the batch mean deviation surface and its confidence interval, that surface is mirrored about the theoretical flank to define a pre-deformation target, and the machine settings are re-solved so that the flank cut before hardening lands on the theoretical surface after hardening.
Generating the theoretical flank and discretizing it
A modern CNC bevel gear cutting machine replaces the mechanical cradle train with three linear axes (X, Y, Z) and three rotary axes (A, B, C). The cutter head spindle is positioned in X and Y so that its axis always lies in the plane normal to the imaginary generating gear axis, Z sets the depth of the tooth space, A rotates the workpiece to generate the flank, B sets the workpiece mounting angle, and C indexes between teeth. The generating motion is thus synthesized numerically rather than through change gears, which is what allows a single machine to reproduce different tooth systems.
Seven settings define the process: roll ratio i between generating gear and workpiece, vertical offset Em, sliding base Xb, workpiece mounting angle γ, angular cutter position q, radial cutter position S, and axial workhead position Xa. In the cutter head frame, with rd the cutter tip radius and αd the blade profile angle (positive for the convex flank of the wheel, negative for the concave flank), the straight-edged blade sweeps a cone:
$$\mathbf{r}_d(u_d,\theta_d)=\begin{bmatrix}(r_d+u_d\sin\alpha_d)\cos\theta_d\\ (r_d+u_d\sin\alpha_d)\sin\theta_d\\ -u_d\cos\alpha_d\\ 1\end{bmatrix},\qquad \mathbf{n}_d=\begin{bmatrix}-\cos\alpha_d\cos\theta_d\\ -\cos\alpha_d\sin\theta_d\\ -\sin\alpha_d\end{bmatrix}$$
Chaining the cutter, cradle, machine, auxiliary and workpiece frames gives the flank and its normal, with the cradle rotation eliminated through the meshing condition n·v(yg) = 0 between cutter and workpiece:
$$\mathbf{r}_g=\mathbf{M}_{gf}\mathbf{M}_{fj}\mathbf{M}_{jy}\mathbf{M}_{yd}\,\mathbf{r}_d,\qquad \mathbf{n}_g=\mathbf{L}_{gf}\mathbf{L}_{fj}\mathbf{L}_{jy}\mathbf{L}_{yd}\,\mathbf{n}_d$$
The flank is then discretized. The four corner points of the tooth surface are projected onto the axial section, each boundary is pulled inward by a margin (toe, heel, tip and root offsets), and the resulting quadrilateral is divided into a 15 × 15 grid; every grid node is the intersection of a line of constant face position with a line of constant tooth height. Node coordinates in the axial plane are converted back to cutter parameters ud and θd by Newton iteration from the projection relations X = xd and Y = (yd2 + zd2)1/2, starting from the mid-face reference point. For a 4.741 mm module, 10 × 41 tooth pair with 31.8 mm offset and 20° mean pressure angle, the procedure yields 225 flank points per side, which is the resolution later used for measurement, fitting and correction.
Measuring a batch, not a part
The measurement grid follows the same logic as the generation grid but is deliberately kept away from the regions where a probing stylus cannot produce a meaningful value: the boundary sits five percent of the working depth below the tip and above the root, and within ten percent of the face width from toe and heel. Fifteen points along the face and fifteen along the depth give 225 points per flank.
Two probing strategies are available on a CNC gear measuring centre. Scanning traverses the flank continuously and is fast, but the stylus drag on a hardened, lapped surface biases the recorded value and must be compensated. Point-by-point probing touches each grid node in turn, which is slower and carries a risk of stylus interference on steep flanks, but it delivers the discrete, high-accuracy set that a subsequent inverse solution for machine settings requires. Point-by-point probing was therefore used, and twenty gear pairs from a single production lot — same material, same cutting method, same heat-treatment specification — were measured before and after hardening.
Bootstrap estimation from small samples
Destructive or exhaustive verification of a whole lot is uneconomic, so the post-hardening deviation is normally known only from a handful of parts. With fewer than about thirty observations and an unknown distribution, classical estimators are unreliable. The bootstrap, introduced by Efron in 1979, replaces analytical derivation with resampling: draw N elements from the original sample with replacement, uniformly and independently, repeat B times, and treat the empirical distribution of the resulting statistics as an approximation to the sampling distribution.
For each of the 225 measurement positions, the values from the twenty measured gears form the original sample F = (F1,…,Fm). A resample of size N is drawn with replacement, its mean is computed, and the process is repeated B times:
$$\bar{P}_b=\frac{1}{N}\sum_{i=1}^{N}P_b(i),\qquad \bar{\bar{P}}=\frac{1}{B}\sum_{b=1}^{B}\bar{P}_b,\qquad \sigma^2=\frac{1}{B-1}\sum_{b=1}^{B}\left(\bar{P}_b-\bar{\bar{P}}\right)^2$$
Confidence intervals follow the percentile method. With the B bootstrap estimates sorted in ascending order and a significance level α = 0.05, the interval is bounded by the order statistics at K1 = [Bα/2] and K2 = [B(1 − α/2)], so that the estimated parameter falls inside the bracket with 95% probability and the estimate carries an explicit reliability statement rather than a single number.
How many resamples and how many elements
Two settings control the cost of the estimate: the number of resamples B and the number of elements N drawn from each sample. Comparing the bootstrap variance with the original sample variance showed that, for five elements and only 100 resamples, the relative error reached 12.97%; increasing B to 2000 drove the error to its minimum. Holding B = 2000 and growing the element count from five to ten cut the variance relative error by 6.7 percentage points, whereas growing from ten to fifteen gained only 0.15 points. Ten elements per resample therefore capture the population characteristics adequately, and B = 2000 was adopted.
| Flank | Elements | Sample mean | Bootstrap mean | Mean rel. error | Sample variance | Bootstrap variance | Variance rel. error |
|---|---|---|---|---|---|---|---|
| Wheel, convex | 5 | 11.3000 | 11.3514 | 0.45% | 21.2698 | 19.0262 | 10.54% |
| 10 | −1.4700 | −1.4739 | 0.26% | 22.0071 | 20.8958 | 5.04% | |
| 15 | 3.7266 | 3.7336 | 0.18% | 24.4215 | 23.6143 | 3.30% | |
| 20 | 6.9400 | 6.9484 | 0.12% | 25.2701 | 24.6341 | 2.52% | |
| Pinion, concave | 5 | 5.2200 | 5.2083 | 0.23% | 6.4021 | 5.7327 | 10.46% |
| 10 | 3.8100 | 3.8165 | 0.17% | 9.0618 | 8.5984 | 5.11% | |
| 15 | 4.7133 | 4.7196 | 0.13% | 9.2617 | 8.9478 | 3.38% | |
| 20 | 6.3550 | 6.3535 | 0.02% | 8.7964 | 8.5718 | 2.55% |
The bootstrap mean converges on the sample mean faster than the bootstrap variance converges on the sample variance, and in every case the resampled variance sits slightly below the original — a well-known small-sample conservatism that is acceptable when the quantity of interest is the shape of the deviation surface rather than its absolute spread. The practical consequence is that ten gears per lot are enough to characterize the deviation statistics of a homogeneous batch, with 95% intervals that bracket the point estimates.
Reconstructing the flank with NURBS
Measured points are discrete; correction needs a continuous surface. A k-degree NURBS curve is written as a rational combination of B-spline basis functions,
$$\mathbf{P}(u)=\frac{\sum_{i=0}^{n}W_i\mathbf{d}_iN_{i,k}(u)}{\sum_{i=0}^{n}W_iN_{i,k}(u)}$$
with control points di, weights Wi and basis functions generated by the de Boor–Cox recursion. The surface is the tensor product of two such curve formulations, and reconstruction proceeds by back-solving for the control points rather than by using the measured points directly as control points. Because the flank curvature changes strongly between toe and heel, centripetal parameterization is chosen: it distributes node parameters according to the square root of the chord length and avoids the uneven parameter spacing and self-intersection that uniform parameterization produces on steep curvature gradients.
The workflow is: parameterize the measured points; build the knot vector (averaged over rows and columns for the surface case); evaluate the basis functions; solve the banded linear system for the control points in the u direction; treat those control points as the data for the v direction and solve again; and finally re-evaluate the NURBS surface. For the wheel convex flank, the first u-direction knot vector obtained from the measured data was {0, 0, 0, 0, 0.1427, 0.2140, 0.2854, 0.3568, 0.4282, 0.4996, 0.5711, 0.6425, 0.7140, 0.7855, 0.8569, 1, 1, 1, 1}; the pinion concave flank gave {0, 0, 0, 0, 0.1347, 0.2030, 0.2721, 0.3418, 0.4122, 0.4834, 0.5552, 0.6277, 0.7008, 0.7747, 0.8492, 1, 1, 1, 1}.
Fitting fidelity was checked against the sum of squared deviations of the measured points. For the pinion the fitted sum was 1.0383 mm² against a measured 1.0760 mm², a relative error of 0.45%; for the wheel, 0.5877 mm² against 0.5852 mm², or 0.42%. That level of agreement is sufficient for the reconstructed surface to serve as the carrier of the mean deviation map.
From mean deviation surface to pre-deformation target
Let HL be the theoretical design flank and HR the mean deviation surface obtained by bootstrap-averaging the deviations of the batch after hardening. The deviation δ is measured along the normal at each node, and the deviation of the i-th node is
$$\delta_i(u_i,v_i;\boldsymbol{\Phi}_j)=\left[\mathbf{H}_R(u_i,v_i)-\mathbf{H}_L(u_i,v_i;\boldsymbol{\Phi}_j)\right]\cdot\mathbf{n}_L(u_i,v_i;\boldsymbol{\Phi}_j)$$
where Φj collects the machine settings. Because the same material, geometry, cutting method and heat-treatment specification are used throughout a batch, the distortion statistics are assumed to repeat: a batch mean distortion surface can therefore be treated as a deterministic property of the process, distinct from the part-to-part scatter that the confidence intervals quantify.
The pre-deformation target HD is the mirror image of HR about HL. Along the theoretical normal,
$$\mathbf{r}_R=\mathbf{r}_L+\delta\,\mathbf{n}_L,\qquad \mathbf{r}_D=\mathbf{r}_L-\delta\,\mathbf{n}_L=2\mathbf{r}_L-\mathbf{r}_R$$
so that if a flank equal to HD is produced before hardening, the distortion δ maps it back onto HL. The correction problem then becomes: find the setting increment ΔΦj that minimizes the sum of squared normal deviations between the recalculated theoretical flank and the pre-deformation target over all 225 nodes,
$$f(\Delta\boldsymbol{\Phi}_j)=\sum_{i=1}^{225}\left[\left(\mathbf{H}_L(u_i,v_i;\boldsymbol{\Phi}_j+\Delta\boldsymbol{\Phi}_j)-\mathbf{H}_D(u_i,v_i)\right)\cdot\mathbf{n}_L(u_i,v_i)\right]^2\;\rightarrow\;\min$$
The minimization is iterative: the flank is regenerated from the machine settings, the residual is evaluated, the settings are updated, and the loop repeats until the residual stops falling. In practice the corrected surface never coincides exactly with the target, because the sensitivity of the flank to individual settings is coupled and the deviation field is not fully representable by the setting set; the residual is simply pushed inside the flank tolerance band.
Verification on an 8 × 39 pair
A first check used an 8 × 39 spiral bevel pair, module 3.8929 mm, offset 31.75 mm, 38.8 mm and 32.18 mm face widths on pinion and wheel. Measuring the pinion after milling and again after hardening showed the expected growth in deviation. Applying the pre-control correction derived from the bootstrap mean surface, recutting and re-hardening reduced the peak pinion deviation by 20.8 μm, and the sum of squared normal deviations over the flank fell from 0.2537 to 0.1104, a reduction of 56.5%. That established the mechanism; the production trial established the magnitude.
Production trial on an automotive rear axle gear set
The full-scale test was run on the production line of a gear and axle manufacturer in Shandong, China, whose plant operates Gleason Phoenix and Klingelnberg bevel gear cutting machines, CNC lapping machines, coordinate measuring machines and Klingelnberg gear measuring centres across more than a hundred tooth-cutting units. The object was the 469 rear axle gear pair, a 10 × 37 equal-height (uniform-depth) design — a tooth system in which root, pitch and face angles coincide, so the whole depth is constant along the face width.
| Parameter | Pinion | Wheel |
|---|---|---|
| Number of teeth | 10 | 37 |
| Module (mm) | 12.78 | 12.78 |
| Shaft offset (mm) | 30 | |
| Mean pressure angle (°) | 22.5 | |
| Cutter head diameter (mm) | 400 | |
| Mid-face spiral angle (°) | 42.5 | 34.47 |
| Face width (mm) | 79.7 | 75.0 |
| Outer diameter (mm) | 175.47 | 475.82 |
| Mounting distance (mm) | 238 | 110 |
| Whole depth (mm) | 20.06 | |
| Root / pitch / face angle (°) | 18.93 | 70.89 |
| Crown to back (mm) | 232.54 | 70.16 |
Both members were cut on an Oerlikon C50 CNC bevel gear cutting machine from the settings computed by the design system, and twenty pairs were measured on a Klingelnberg P65 measuring centre before hardening and again after quenching on the production heat-treatment line. Before hardening the flanks were already inside the design requirement: the wheel showed a maximum of 8.9 μm on the convex flank at the heel near the tip and 19.4 μm on the concave flank at the toe near the tip; the pinion showed −12.7 μm on the convex flank at the heel near the tip and 21.5 μm on the concave flank at the heel near the root.
After quenching, the deviations grew on both members. The bootstrap model was then applied to the wheel concave flank and the pinion convex flank using five- and ten-element resamples at 95% confidence. Deviations at every grid node were resampled independently, so each of the 225 positions acquired its own mean, variance and interval. The resulting statistics were stable: for the wheel concave flank the bootstrap mean moved from −1.5335 at five elements to −1.5994 at ten, against original sample means of −1.5500 and −1.6100, and the variance from 3.6542 to 3.5798 against 3.9969 and 3.7693. For the pinion convex flank the corresponding means were 3.1617 and 3.1215 against 3.1540 and 3.1170, with variances of 1.4270 and 1.1063 against 1.5965 and 1.1639.
The fitted difference surfaces confirmed the same conclusion visually. On both flanks the gap between the bootstrap mean difference surface and the measured mean difference surface was visibly larger for five-element samples than for ten-element samples, at randomly chosen nodes in the eighth row/fourth column and tenth row/eleventh column of the wheel flank, and the fourth row/third column and eleventh row/eighth column of the pinion flank, while the spacing between the measured mean surface and the theoretical surface stayed fixed by construction. Ten elements per resample reproduce the distortion field more faithfully, which is consistent with the variance convergence reported above.
Correction values were then computed for both members and applied on the cutting machine, followed by the same heat-treatment cycle. The correction increments were small — of order 0.2 mm in radial cutter position and horizontal workhead position, 0.29 mm in sliding base for the wheel, 0.07° in cutter tilt and 0.087° in cutter swivel for the pinion — which is the expected scale, since the compensation only has to absorb a distortion field of a few tens of micrometres.
| Result | Wheel | Pinion |
|---|---|---|
| Maximum flank deviation after milling, before hardening | 8.9 μm convex, 19.4 μm concave | −12.7 μm convex, 21.5 μm concave |
| Change in maximum deviation after pre-control compensation | −39.6 μm | −55.5 μm |
| Reduction in sum of squared normal deviations | 69.78% | 76.66% |
| Deviation gradient across the flank | markedly flatter after compensation | |
Both members improved, and the pinion improved more. That asymmetry is expected: the pinion flank is the more strongly twisted of the two and therefore the more sensitive to the small setting changes used as compensation variables, so a given increment in radial cutter position or workhead angle buys more deviation correction on the pinion than on the wheel. The flattened deviation gradient matters as much as the reduced peak, because hard finishing removes stock in proportion to the local deviation, and a flatter map means a more uniform allowance.
Scope and limitations
Three assumptions carry the method. First, batch homogeneity: the material, the cutting process and the heat-treatment specification must be genuinely identical, otherwise the mean distortion surface describes a mixture rather than a population. Second, repeatability of the distortion field: the mirror construction only works if the post-hardening deviation of a future part resembles the batch mean, which is what the confidence intervals are there to test rather than to assume. Third, representability: the machine setting set must be able to approximate the pre-deformation target, and the residual after iteration is accepted rather than eliminated.
The statistical side is also deliberately narrow. Bootstrap resampling was the only estimator applied to the small samples; alternative resampling schemes, jackknife variants or parametric models fitted to the batch could be compared against it, and the ranking of estimators is itself an open question for this application. The trials reported here were run at a single plant on two gear sets, so the reduction figures — 39.6 μm and 55.5 μm in peak deviation, roughly 70% and 77% in squared-deviation energy — describe what the method achieved under those conditions rather than a guaranteed performance level.
What the results do establish is the shape of a workable production strategy for distortion-sensitive bevel gears: measure a small sample of a homogeneous lot, estimate the batch distortion surface statistically rather than trusting a single part, mirror it into a pre-deformation target, and absorb it through the machine settings that already exist in the cutting program. The compensation is then applied to every part in the lot at no additional cycle cost, and the tolerance band that hard finishing has to close is narrower from the start.