This paper focuses on the shot peening process of 9310 steel spiral bevel gears. A simulation model based on the coupling of discrete element method and finite element method is established to accurately calculate the residual stress field on the tooth surface after shot peening. The model’s accuracy is verified by comparing with experimental results, and the relationships between shot peening process parameters and residual stress field characteristics are explored. The findings provide a valuable reference for optimizing shot peening parameters and improving the fatigue life of spiral bevel gears.
1. Introduction
High – performance gears are crucial mechanical components, often operating under high – speed and heavy – load conditions. To enhance their fatigue life and service performance, the shot peening process is commonly incorporated at the end of the manufacturing process. Shot peening utilizes high – velocity projectiles to impact the part surface, inducing plastic deformation and generating residual compressive stress, which can improve the contact fatigue strength, bending fatigue strength, and anti – scuffing ability of gears
However, in production, determining shot peening process parameters through trial – and – error methods is time – consuming and resource – intensive. Therefore, developing shot peening process simulation research can save resources and provide guidance for industrial manufacturing. Existing shot peening residual stress prediction models mainly rely on the finite – element method. While these models have been applied to planar or cylindrical specimens, for spiral bevel gears, the complex surface increases the probability of projectile collisions, which must be considered in the simulation model. The combination of the discrete element method and the finite – element method can improve the accuracy of simulation results and is widely used [8 – 12].
2. Shot Peening Process Experiment
2.1 Experimental Specimens
The shot peening specimens are a certain type of spiral bevel gear made of AISI 9310 high – strength alloy steel. The tooth parts have undergone carburizing and quenching treatment. The tooth surface, an important area for shot peening, has a hardness higher than 60HRC within a depth of 0.56 mm from the surface.
2.2 Experimental Parameters
The experiment is carried out using an MP1000Ti CNC shot peening machine. The projectile type is ASH110 (55 – 62HRC), with a shot peening intensity of 0.178 – 0.228 mmA, a coverage rate of 200%, a nozzle angle of 17°, an air pressure of 0.25 MPa, a moving speed of 70 mm/min, and a shot peening time of 144 s. The root, convex surface, and concave surface of the tooth are strengthened respectively. The nozzle is perpendicular to the target surface and 150 mm away from it. The gear turntable rotates at a speed of 30 r/min, and the projectile flow rate is 5 kg/min.
| Parameter | Value |
|---|---|
| Projectile Type | ASH110 (55 – 62HRC) |
| Shot Peening Intensity | 0.178 – 0.228 mmA |
| Coverage Rate | 200% |
| Nozzle Angle | 17° |
| Air Pressure | 0.25 MPa |
| Moving Speed | 70 mm/min |
| Shot Peening Time | 144 s |
| Nozzle – Target Distance | 150 mm |
| Gear Turntable Rotation Speed | 30 r/min |
| Projectile Flow Rate | 5 kg/min |
2.3 Residual Stress Measurement
The residual stress on the tooth surface is measured at specific points (a, b, c) located on the pitch cone line of the tooth surface, which are the quarter – points of the tooth width, with point a close to the large end of the tooth. To obtain the residual stress field on the gear surface layer, the tooth is electrolytically polished along the normal direction of the tooth surface, and the electrolytic polishing depth is measured by a white – light interferometer.
A Canadian Proto company X – ray diffractometer is used to measure the residual stress. The operating parameters are as follows: tube voltage 25 kV, tube current 5 mA, X – ray tube \(Cr_K -\) Alpha, aperture diameter 1 mm, wavelength 2.291 Å, exposure time 3 s, exposure times 7, and maximum β angle 20°. The electrolytic polishing instrument is an 8818 – V3 type, with a set voltage of 40 V, a flow rate of 8, a polishing time of 3 s, and a polishing current of 2.8 – 3 A.
3. Simulation Model Establishment
3.1 Discrete Element Model
3.1.1 Model Establishment
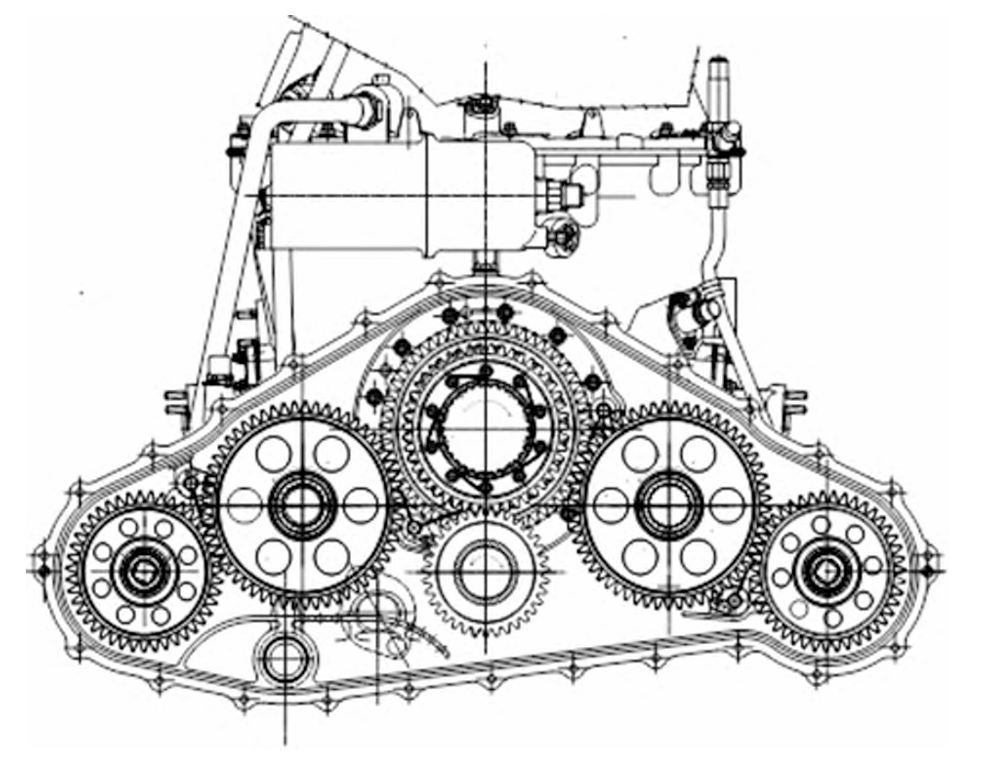
The discrete element model is set up using EDEM simulation software to simulate the process of projectiles from the nozzle to the tooth surface. The model parameters are set according to the experimental parameters in Section 2.2. The geometric model is shown in Figure 1. The tooth surface is meshed using Hypermesh software to extract the impact information at the target position on the tooth surface. The initial velocity of the projectiles is determined by the empirical formula \(v=\frac{163.5P}{1.53q_{m}+10P}+\frac{295P}{0.598d + P}+48.3P\), where d is the projectile diameter (mm), \(q_{m}\) is the projectile flow rate (kg/min), and P is the nozzle air pressure (MPa).
3.1.2 Data Extraction and Processing
The calculation results are exported from EDEM software. The impact point position is determined by the element number, and the impacts at the four – equal – division points on the pitch cone line of the tooth surface are selected for data processing.
3.2 Finite Element Model
3.2.1 Mesh Division and Boundary Conditions
The finite – element model is established based on the commercial finite – element software ABAQUS/CAE to calculate the residual stress field on the tooth surface after shot peening. The projectile diameter is 0.3 mm, and the unit type is C3D8R. The target plate size is shown in Figure 3. Except for the infinite element body mesh, the target plate size is 1 mm×1 mm×0.5 mm, and the unit type is also C3D8R. A predefined field is set in this area, and the measured residual stress value on the tooth surface before shot peening is used as the initial residual stress of the model. Area I is used to limit the impact center point position of the projectile and extract the residual stress calculation results. Areas I and II are the mesh – refined parts, with a unit size of 10 μm×10 μm×10 μm. Area III is the transition area from fine to coarse finite – element mesh. Area IV is an infinite element body CIN3D8 to eliminate the reflection of stress waves at the target plate boundary.
The bottom surface of the target plate is completely fixed. The contact relationship between the projectile and the target plate is Surface to Surface. The normal behavior is defined as “hard” contact, and the tangential behavior is defined as penalty friction, with a friction coefficient of 0.2.
3.2.2 Material Model
The projectile is set as an elastic – plastic body, using an isotropic constitutive model. The projectile parameters are set as follows: Young’s modulus \(E = 210 GPa\), Poisson’s ratio \(\mu=0.3\), density \(\rho = 7800 kg/m^{3}\), and yield strength \(\sigma_{s}=1400 MPa\). The target body material is 9310 carburized and quenched steel. The material parameters are set as Young’s modulus \(E = 210 GPa\), Poisson’s ratio \(\mu = 0.3\), density \(\rho = 7800 kg/m^{3}\). The plastic stress – strain curve adopts the Johnson – Cook model \(\sigma=(A + B\varepsilon^{n})(1 + C\ln\frac{\dot{\varepsilon}}{\dot{\varepsilon}_{0}})(1-(T^{+})^{n})\), and \(T^{*}=\frac{T – T_{ren}}{T_{melt}-T_{rosat}}\). The parameters \(A = 1234.38\), \(B = 881\), \(C = 0.018\), \(n = 0.238\), \(m = 0.686\) are obtained from the Hopkinson pressure bar test. To prevent stress wave oscillation, the target plate material damping \(\alpha = 6×10^{6} s^{-1}\) is set.
3.2.3 Projectile Impact Information
The impact angle, velocity, and number of projectiles are determined by the calculation results in Section 3.1.2. According to the ASH110 – type projectile size standard, the projectile is set as spherical with a diameter of 0.3 mm. Considering the random distribution of projectile impact positions in actual situations, Python language programming is used in the simulation, and the Random function is used to generate random positions. The impact center points of the projectiles are all within Area I shown in Figure 3.
4. Results and Discussion
4.1 Comparison between Simulation and Experimental Results
To verify the accuracy of the simulation model, the same process parameters as the experiment are set in the established shot peening process simulation model. Figure 4 shows the measured and simulated three – dimensional morphologies of point b on the convex surface after shot peening. The three – dimensional roughness \(S_{a}\) value is calculated by the formula \(S_{a}=\frac{1}{n}\sum_{i = 1}^{n}|Z_{i}|\). The measured value is 0.35 μm, and the simulated calculation result is 0.386 μm, with an error of 10.3%. In the x and y directions, the resolution of the simulation result is lower than that of the measured result because the sampling interval of the measured data is 0.5 μm, and the target plate mesh size of the finite – element model is 10 μm×10 μm.
Table 1 shows the comparison of the residual stress values in the tooth height direction on the gear surface between the measured and simulated results after shot peening. The results show that the surface residual stress of each point on the tooth is between – 800 and – 880 MPa, and the calculation error is within 6%. Figure 5 shows the distribution of the measured and simulated residual stresses along the depth direction of point b on the convex and concave surfaces. After shot peening, the residual stress change trends of the convex and concave surfaces of the tooth are consistent, and the residual compressive stress value of the concave surface is slightly greater than that of the convex surface. The distributions of the residual stress in the tooth width direction and the tooth height direction are similar. The surface residual stress is approximately – 800 – – 850 MPa, and the maximum residual compressive stress value is between 1200 and 1300 MPa, with a depth of about 20 – 30 μm. The statistical results of the surface residual compressive stress and the maximum residual compressive stress value on the tooth surface are shown in Table 2. The errors between the measured values and the simulated results are all less than 10%, indicating that the simulation model can accurately predict the residual stress field on the tooth surface layer of the spiral bevel gear after shot peening.
| Project | Convex Surface Measuring Points | Concave Surface Measuring Points | ||||
|---|---|---|---|---|---|---|
| a | b | c | a | b | c | |
| Experimental Value /MPa | – 818.3 | – 805.3 | – 814.2 | – 879.1 | – 849.7 | – 836.7 |
| Simulated Value /MPa | – 823.4 | – 824.2 | – 834.6 | – 843.1 | – 837.9 | – 831.3 |
| Error /% | 0.6 | 2.3 | 2.5 | 4.1 | 1.4 | 0.6 |
| Table 1 Comparison of Residual Stress in Tooth Height Direction on Gear Surface between Experiment and Simulation |
| Project | Convex Surface | Concave Surface | ||||||
|---|---|---|---|---|---|---|---|---|
| \(\sigma_{sx}\) | \(\sigma_{xm}\) | \(\sigma_{ys}\) | \(\sigma_{ym}\) | \(\sigma_{sx}\) | \(\sigma_{xm}\) | \(\sigma_{ys}\) | \(\sigma_{ym}\) | |
| Experimental Value /MPa | – 826.8 | – 1248.5 | – 805.3 | – 1218.2 | – 813.4 | – 1286.6 | – 849.7 | – 1291.2 |
| Simulated Value /MPa | – 838.7 | – 1145.0 | – 824.2 | – 1148.9 | – 847.1 | – 1161.0 | – 837.9 | – 1169.18 |
| Error /% | 1.4 | 8.3 | 2.3 | 5.7 | 4.1 | 9.8 | 1.4 | 9.5 |
| Table 2 Comparison of Residual Stress Results of Point b on Convex and Concave Surfaces between Experiment and Simulation |
4.2 Influence of Shot Peening Time
The shot peening coverage rate is affected by the projectile flow rate and shot peening time. An increase in both will increase the number of projectile impacts and the coverage rate. This section mainly studies the influence of shot peening time on the residual stress field, and the results are shown in Figure 6. Based on the method of Miao et al. [9], the shot peening coverage rate is calculated.
When the initial velocity of the projectile is 40 m/s, when the shot peening time reaches 72 s, the number of projectile impacts is 360 per \(mm^{2}\), and the shot peening coverage rate reaches 98%, that is, full coverage. When the shot peening time is 144 s, the coverage rate is 200%. With the increase of shot peening time: (1) the residual compressive stress on the target plate surface increases, and when the shot peening time reaches 72 s, it gradually stabilizes at around 800 MPa; (2) the residual compressive stress at 10 μm shows an increasing trend and stabilizes at about 1000 MPa after the shot peening time reaches 96 s; (3) the residual compressive stress at 20 μm continues to increase, and after 72 s, the residual compressive stress at 20 μm is higher than that at 10 μm, indicating that the depth of the maximum residual compressive stress increases from 10 μm to 20 μm. This shows that increasing the shot peening time can effectively increase the residual compressive stress value in the subsurface layer of the material and increase the depth of the maximum residual compressive stress layer.
4.3 Influence of Projectile Velocity
The initial velocity of the projectile is determined by the nozzle air pressure, projectile flow rate, and projectile diameter, with the nozzle air pressure being the main factor. An increase in the nozzle air pressure can significantly increase the projectile velocity and shot peening intensity.