
In modern automotive engineering, improving transmission efficiency is crucial for reducing fuel consumption and enhancing vehicle performance. One significant source of power loss in rear axle assemblies is the churning loss generated by the rotation of hypoid gears, particularly the passive hyperboloid gear, which agitates the lubricating oil. This phenomenon, often referred to as “oil churning,” results in drag torque that diminishes overall传动 efficiency. In this study, we investigate the churning power losses in a passenger car rear axle equipped with hyperboloid gears through computational fluid dynamics (CFD) numerical simulation. We aim to analyze the transient flow field, dynamic pressure distribution, and the effects of various parameters on churning loss, ultimately proposing a structural optimization to reduce drag and validate our findings via bench testing.
The hyperboloid gear, a type of hypoid gear, is widely used in automotive rear axles due to its ability to transmit torque between non-intersecting shafts with high efficiency and compact design. However, during operation, the rotating hyperboloid gear and its connected components, such as the differential housing, immerse in lubricating oil, causing substantial churning losses. These losses are influenced by factors like rotational speed, oil temperature, and gear geometry. Previous research has primarily focused on simple cylindrical gears or gearboxes, leaving a gap in understanding the complex flow dynamics in rear axle assemblies with hyperboloid gears. Our work addresses this by developing a detailed three-dimensional CFD model that captures the intricate interactions between the oil-air two-phase flow and the rotating hyperboloid gear.
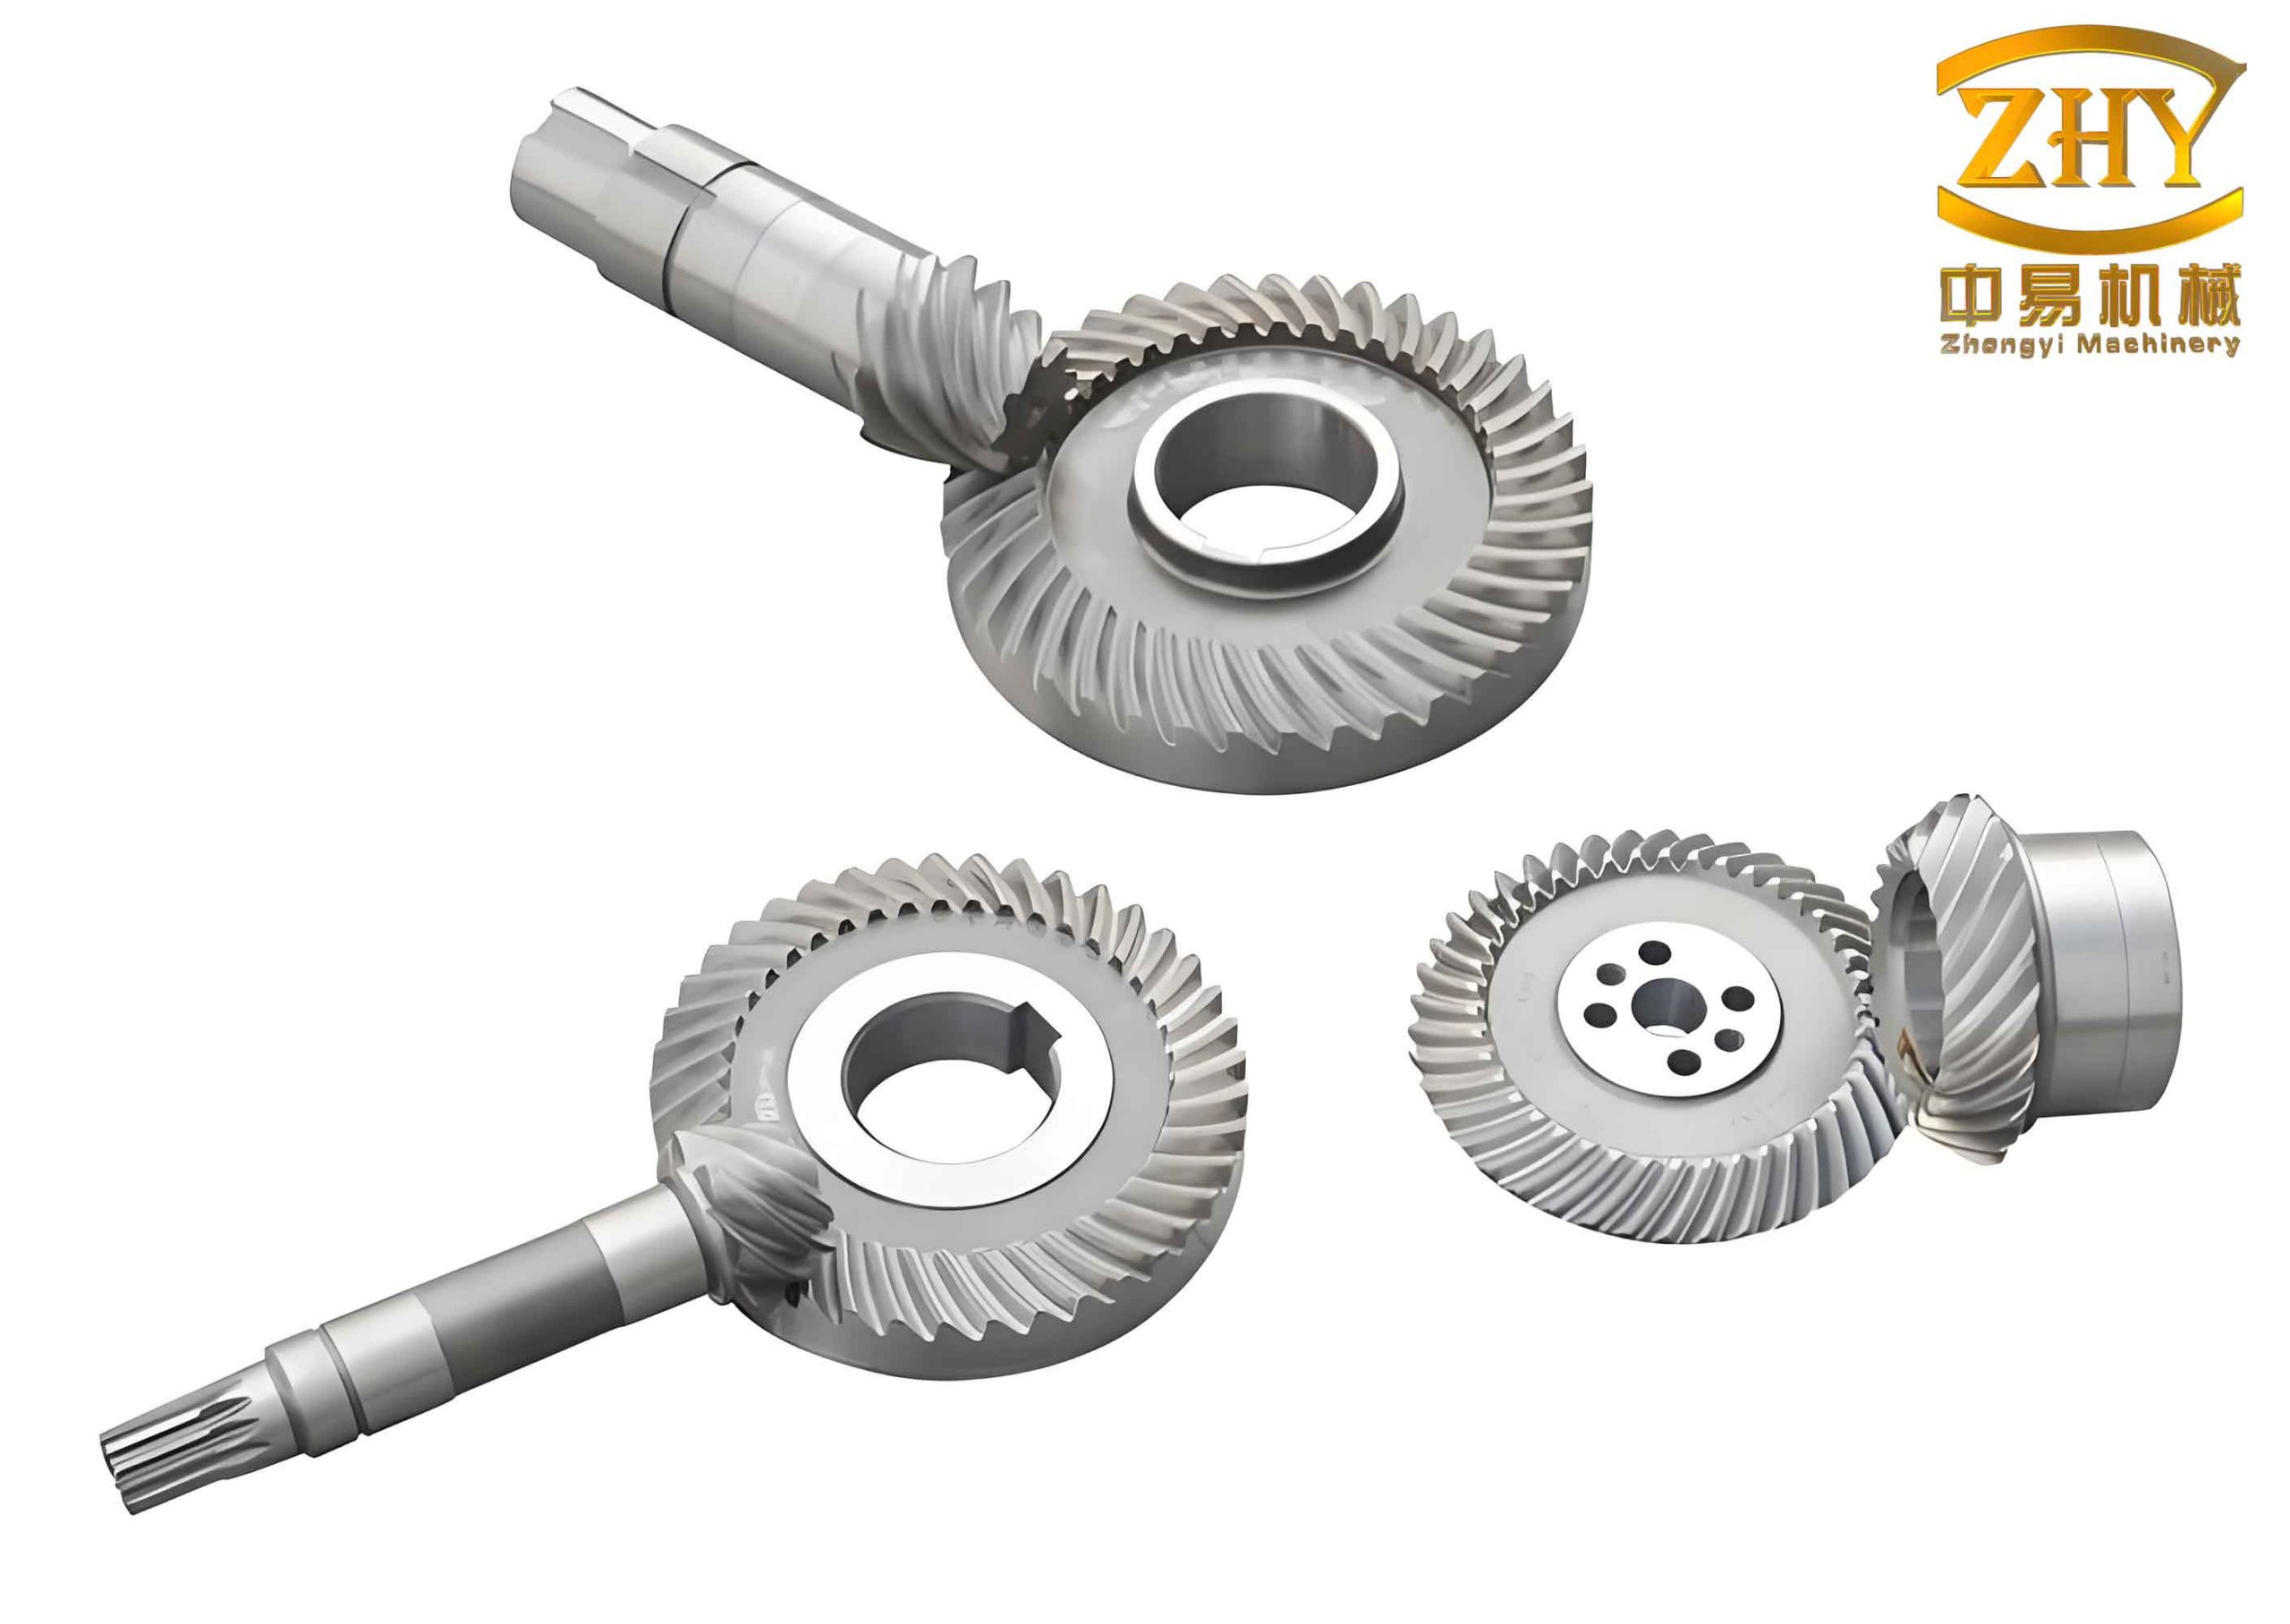
The numerical approach in this study is based on the Volume of Fluid (VOF) model for tracking the oil-air interface and the RNG k-ε turbulence model for simulating turbulent flow. The governing equations include the continuity equation and the Navier-Stokes momentum equations. For an incompressible fluid, the continuity equation is expressed as:
$$\nabla \cdot \vec{V} = \frac{\partial u}{\partial x} + \frac{\partial v}{\partial y} + \frac{\partial w}{\partial z} = 0$$
where $\vec{V}$ is the fluid velocity vector. The momentum equation accounts for forces acting on the fluid:
$$\rho \frac{\partial \vec{V}}{\partial t} + \rho (\nabla \cdot \vec{V}) \vec{V} = -\nabla P + \nabla \cdot [\mu (\nabla \cdot \vec{V} + \nabla \cdot \vec{V}^T)] + \rho g + F$$
Here, $\rho$ is density, $P$ is pressure, $\mu$ is dynamic viscosity, $g$ is gravitational acceleration, and $F$ represents other volume forces. The VOF model is employed to capture the oil-air interface by solving the volume fraction equation for oil:
$$\frac{\partial}{\partial t} (\alpha_{oil} \rho_{oil}) + \nabla \cdot (\alpha_{oil} \rho_{oil} \vec{u}_{oil}) = S_{\alpha} + (m^+ – m^-)$$
where $\alpha_{oil}$ is the oil volume fraction, $\rho_{oil}$ is oil density, $\vec{u}_{oil}$ is oil velocity, $S_{\alpha}$ is a source term, and $m^+$ and $m^-$ represent mass transfer due to cavitation and condensation, respectively. The mixture properties are calculated as weighted averages:
$$\rho = \rho_{oil} \alpha_{oil} + \rho_{air} (1 – \alpha_{oil})$$
$$\mu = \mu_{oil} \alpha_{oil} + \mu_{air} (1 – \alpha_{oil})$$
To model turbulence, we use the RNG k-ε model, which improves accuracy for swirling flows. The transport equations for turbulent kinetic energy $k$ and dissipation rate $\epsilon$ are:
$$\frac{\partial (\rho k)}{\partial t} + \frac{\partial (\rho k u_i)}{\partial x_i} = \frac{\partial}{\partial x_j} \left( \alpha_k \mu_{eff} \frac{\partial k}{\partial x_j} \right) + G_k – \rho \epsilon$$
$$\frac{\partial (\rho \epsilon)}{\partial t} + \frac{\partial (\rho \epsilon u_i)}{\partial x_i} = \frac{\partial}{\partial x_j} \left( \alpha_\epsilon \mu_{eff} \frac{\partial \epsilon}{\partial x_j} \right) + C_{1\epsilon} \frac{\epsilon}{k} G_k – C_{2\epsilon} \rho \frac{\epsilon^2}{k} – R_\epsilon$$
where $\mu_{eff} = \mu + \mu_t$, with $\mu_t = \rho C_\mu k^2 / \epsilon$ as the turbulent viscosity. Constants include $\alpha_k = \alpha_\epsilon = 1.393$, $C_{1\epsilon} = 1.42$, $C_{2\epsilon} = 1.68$, and $R_\epsilon$ is a correction term. These equations form the foundation for simulating the churning loss in hyperboloid gears.
We created a three-dimensional fluid domain model of the rear axle, focusing on the passive hyperboloid gear and differential housing as the primary rotating components. The active hyperboloid gear and bearings were omitted due to their low immersion depth. The geometry was simplified using CAD software, and the fluid domain was extracted from the internal surfaces of the axle housing and the external surfaces of the rotating parts. The mesh was generated with non-structured tetrahedral elements, refined near the hyperboloid gear and bolts to capture detailed flow features. The initial mesh comprised approximately 1.37 million cells. Boundary conditions were defined as follows: the axle housing walls were set as no-slip stationary boundaries, the axle ends as pressure outlets at atmospheric pressure, and the rotating components were assigned angular velocities via profile files. The initial oil immersion height was set to 48 mm, with oil and air phases distinguished using the VOF model.
The material properties and simulation parameters are summarized in Table 1. We varied rotational speed and oil temperature to analyze their effects on churning loss. The lubricant oil properties were defined based on typical automotive gear oil, with density and viscosity dependent on temperature.
| Parameter | Value or Range |
|---|---|
| Oil density at 90°C | 900 kg/m³ |
| Oil dynamic viscosity at 90°C | 0.0135 kg/(m·s) |
| Air density | 1.225 kg/m³ |
| Air dynamic viscosity | 1.7894 × 10⁻⁵ kg/(m·s) |
| Oil temperature | 30°C, 60°C, 90°C |
| Hyperboloid gear rotational speed | 133, 284, 444, 621, 888, 1065 rpm |
| Initial oil immersion depth | 48 mm |
The transient flow field within the rear axle was analyzed at different time steps. As the hyperboloid gear rotates, it entrains lubricating oil due to viscous forces, creating a splashing effect that distributes oil throughout the housing. At a speed of 133 rpm, the oil phase evolution shows that after 0.1 seconds (approximately 90° rotation), oil adheres to the gear surface and begins to flow along the walls. By 0.4 seconds (full rotation), oil accumulates at the top of the housing and then drips back to the sump, establishing a dynamic equilibrium for lubrication. This behavior is critical for cooling and lubricating gears and bearings, but it also contributes to churning losses. The flow patterns highlight the complex interaction between the hyperboloid gear geometry and the two-phase fluid, emphasizing the need for optimized designs to minimize drag.
Dynamic pressure distribution on the hyperboloid gear surface provides insights into the sources of churning loss. At various rotational speeds, the pressure is highest in the gear tooth roots and grooves, where oil is actively agitated. For instance, at 133 rpm, the maximum dynamic pressure is 1464 Pa, increasing to 23715 Pa at 888 rpm, as shown in Table 2. This significant rise indicates that churning resistance escalates with speed. Additionally, the bolts connecting the hyperboloid gear to the differential housing create localized high-pressure zones on their leeward sides, leading to vortex shedding and additional drag. The pressure gradients around these bolts become more pronounced at higher speeds, contributing to overall power loss.
| Rotational Speed (rpm) | Max Dynamic Pressure on Gear (Pa) | Max Dynamic Pressure on Bolt Section (Pa) |
|---|---|---|
| 133 | 1464 | N/A (low impact) |
| 284 | Estimated from trend | 967 |
| 444 | 7495 | 1479 |
| 621 | 14835 | 8565 |
| 888 | 23715 | 9739 |
| 1065 | Extrapolated higher | Data similar to 888 rpm |
To quantify churning power loss, we computed the torque required to overcome fluid resistance based on pressure and shear stress integrals. The churning power $P_{churn}$ is given by:
$$P_{churn} = \tau \cdot \omega = \int_A (\vec{\sigma} \cdot \vec{n}) \cdot \vec{r} \times \vec{\omega} \, dA$$
where $\tau$ is the resistive torque, $\omega$ is angular velocity, $\vec{\sigma}$ is the stress tensor, $\vec{n}$ is the surface normal, $\vec{r}$ is the position vector, and $A$ is the wetted surface area. Simulations revealed that churning power increases dramatically with rotational speed but decreases slightly with rising oil temperature due to reduced viscosity. For example, at 1065 rpm, increasing temperature from 30°C to 90°C reduces churning power by about 30 W, whereas increasing speed from 444 rpm to 1065 rpm at 30°C raises churning power from 21 W to 254 W. This underscores that speed is the dominant factor, as summarized in Table 3.
| Temperature (°C) | Churning Power at 444 rpm (W) | Churning Power at 1065 rpm (W) |
|---|---|---|
| 30 | 21 | 254 |
| 60 | 19 | 235 |
| 90 | 18 | 224 |
Given the adverse effects of exposed bolt heads on churning loss, we proposed a structural optimization: replacing the standard bolted connection with a countersunk bolt design for the hyperboloid gear. In the original design, bolt heads protrude from the differential housing flange, acting like paddles that stir the oil. The countersunk bolts recess the heads flush with the surface, streamlining the geometry and reducing flow disruption. We modeled this optimized hyperboloid gear assembly and compared it with the baseline. The dynamic pressure distribution improved significantly, with reductions ranging from 1.28% to 6.50% across speeds, as shown in Table 4. Consequently, churning power loss decreased by 3.65% to 8.20%, demonstrating the efficacy of this modification.
| Rotational Speed (rpm) | Dynamic Pressure Reduction (%) | Churning Power Reduction (%) |
|---|---|---|
| 133 | 2.28 | 5.76 |
| 284 | 5.97 | 7.67 |
| 444 | 6.50 | 3.65 |
| 621 | 1.28 | 7.94 |
| 888 | 3.72 | 6.10 |
| 1065 | 1.64 | 8.20 |
To validate our numerical findings, we conducted bench efficiency tests on both the original and optimized hyperboloid gear assemblies. The test setup included drive motors, torque-speed sensors, and the rear axle specimen with a transparent cover for flow observation. The transmission efficiency $\eta$ was calculated as:
$$\eta = \frac{P_{out}}{P_{in}} \times 100\% = \frac{n_{out1} T_{out1} + n_{out2} T_{out2}}{n_{in} T_{in}} \times 100\%$$
where $P_{in}$ and $P_{out}$ are input and output power, $n$ and $T$ denote rotational speed and torque, with subscripts for input and output shafts. Results indicated that the original hyperboloid gear assembly achieved efficiency between 95% and 96.3% under various loads, while the optimized countersunk bolt hyperboloid gear assembly reached 96% to 97.3%, as detailed in Table 5. This corresponds to an efficiency improvement of approximately 1.0% to 1.1%, confirming that the structural optimization effectively reduces churning loss and enhances overall performance.
| Load Condition (Input Torque) | Original Hyperboloid Gear Efficiency (%) | Optimized Hyperboloid Gear Efficiency (%) | Efficiency Gain (%) |
|---|---|---|---|
| 81 Nm at varying speeds | 95.0–95.9 | 96.0–97.0 | 1.0–1.1 |
| 135 Nm at varying speeds | 95.5–96.3 | 96.5–97.3 | 1.0–1.1 |
In conclusion, our study demonstrates the importance of considering churning loss in automotive rear axle designs featuring hyperboloid gears. Through advanced CFD simulations using the VOF model and RNG k-ε turbulence model, we analyzed the transient flow field and dynamic pressure distribution, identifying key factors such as rotational speed, oil temperature, and bolt geometry. The hyperboloid gear’s rotation induces complex oil-air interactions that lead to significant power loss, especially at high speeds. By optimizing the hyperboloid gear connection to use countersunk bolts, we reduced flow disruption and churning loss, resulting in a measurable increase in transmission efficiency. These findings highlight the potential for further innovations in hyperboloid gear design to minimize energy losses and contribute to more efficient automotive systems. Future work could explore additional geometric modifications, such as tailored tooth profiles or housing shapes, to further enhance the performance of hyperboloid gears in various applications.