
1. Introduction
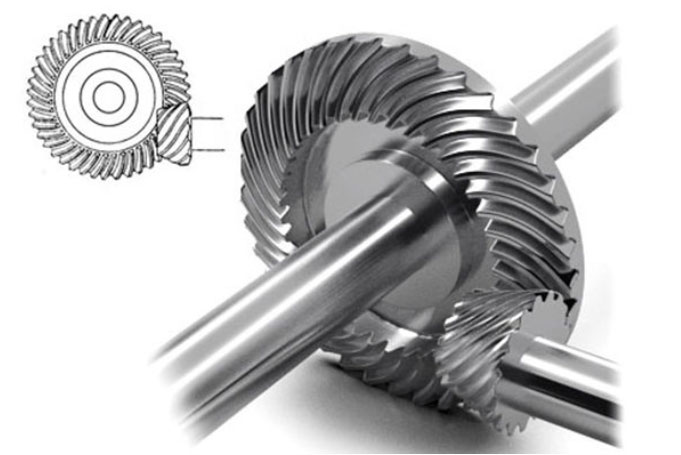
In the company’s rear axle, the passive bevel gear of the main reducer is bolted to the differential housing. The bolt head, protruding outside the flange surface of the differential housing, intermittently stirs the lubricating oil during operation, creating a resistance torque similar to “paddling” and resulting in churning losses and reduced transmission efficiency. Therefore, studying the mechanism of gear churning losses and exploring drag reduction methods is of value in reducing fuel consumption.
Existing research mainly focuses on simple-structured cylindrical gears and gearboxes, with few studies on the flow field distribution and churning losses of more complex rear axle hypoid gears. This study aims to establish a three-dimensional flow field model of the rear axle, including passive bevel gears and differential housings, to analyze the flow field distribution, dynamic pressure distribution, and the influence of various factors on churning losses, propose structural improvements, and validate them through bench efficiency tests.
2. Numerical Method for Rear Axle Flow Field
The lubricating oil flow in the rear axle is a three-dimensional unsteady incompressible flow. The gear churning numerical method depends on the continuity equation and N – S momentum equation. The control equations are as follows:
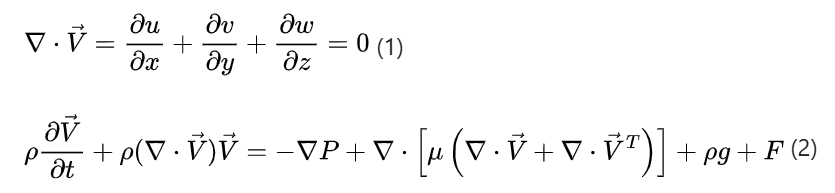
where V is the fluid velocity vector, ρ is the density, P is the pressure on the unit, μ is the dynamic viscosity of the fluid unit, ρg is the gravity of the infinitesimal body, and F is other body forces.
The VOF model is used to calculate the phase volume fraction within the unit to determine the shape and position of the free surface, with the phase volume fractions of lubricating oil and air satisfying αoil+ααir=1. The continuity equation for the lubricating oil volume fraction is:
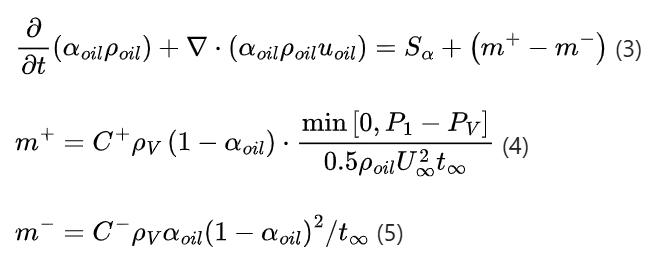
where ρoil is the density of the lubricating oil, uoil is the velocity vector of the lubricating oil, Sα is the source term (default is 0), m+ is the mass of vaporized lubricating oil, m- is the mass of liquefied lubricating oil, P1 is the pressure after two-phase diffusion, Pv is the vaporization pressure, C+ and C- are empirical constants, and U∞ t∞ are the Kunz coefficients.
The RNG k – ε turbulence model is added to consider turbulent vortices by modifying the turbulent dynamic viscosity and improving the accuracy of the turbulent dissipation rate ε equation. The transport equations for turbulent kinetic energy k and dissipation rate ε are:
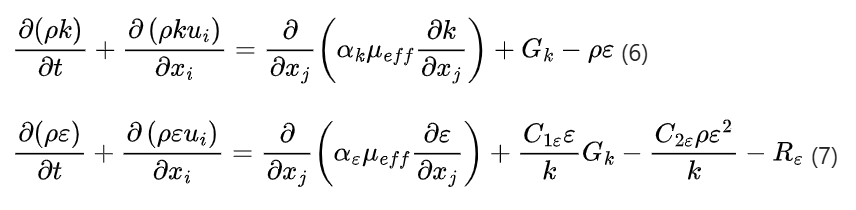
where k is the turbulent kinetic energy, ε is the turbulent dissipation rate, αk and αε are the reciprocals of the effective turbulent Prandtl numbers of k-ε, αk=αε=1.393, μeff is the modified turbulent dynamic viscosity (μeff=μt+μ, μt=ρCμk^2/ε, μt is the turbulent eddy viscosity coefficient), Gk is the generation term of turbulent kinetic energy caused by the average velocity gradient, C1ε=1.42 , C2ε=1.68, and Rε is the correction term of the RNG k – ε model for the dissipation rate equation.
3. Numerical Model of Hypoid Gear Churning Losses
3.1 Creation of Flow Field Model
A three – dimensional model of the rear axle was created using UG8.0, simplifying the model by ignoring the active bevel gear, bearings, and differential gears with low oil immersion depths and considering rotating components such as the passive bevel gear and differential housing. The calculation domain was formed by extracting the inner and outer surfaces of the rear axle housing and main reducer housing.
| Component | Description |
|---|---|
| Rear Axle Housing | Outer structure of the rear axle |
| Main Reducer Housing | Housing related to the main reducer |
| Passive Bevel Gear | Gear involved in power transmission |
| Differential Housing | Housing for the differential mechanism |
3.2 Mesh Generation and Spatial Discretization
The mesh model was established using HyperMesh13.0. Due to the complex structure of the rear axle passive bevel gear and the presence of dynamic mesh boundaries, an unstructured tetrahedral mesh was used, with local mesh refinement at the passive bevel gear and differential housing. The initial total number of fluid domain mesh cells was 1,366,404. The mesh model boundaries were grouped to define boundary conditions. The PISO algorithm was used to solve the pressure – velocity coupling in the continuity and momentum equations. The PRESTO! format was used for pressure discretization in spatial discretization, and the second – order upwind format was used for other diffusion phases. A first – order implicit format was used in time.
3.3 Material Parameters and Boundary Conditions
The numerical simulation studied the influence of lubricating oil temperature and gear speed on the churning power loss of the rear axle passive bevel gear. The specific influence parameters and material parameters of the two phases are shown in Table 1.
| Name | Performance and Value |
|---|---|
| Lubricating Oil | (, at 90°C) |
| Air | (, ) |
| Temperature (°C) | 30, 60, 90 |
| Gear Speed (rpm) | 133, 284, 443, 621, 888, 1065 |
The rear axle housing and main reducer housing were defined as solid wall no – slip boundary conditions. The two axle ends of the rear axle were set as pressure outlets with atmospheric pressure and a reference pressure of zero. A profile file was written to define the speed and direction of the passive bevel gear and differential housing. The initial oil immersion height of the lubricating oil was marked as 48mm using Region Adaption in Adapt. The initial simulation situation3, with the red part representing the lubricating oil and the rest being air.
4. Analysis of Numerical Calculation Results
4.1 Flow Field Distribution Inside the Rear Axle
The lubricating oil in the rear axle is splashed and carried by the rotation of the passive bevel gear due to its viscosity, lubricating and cooling the gears and bearings. The distribution of the lubricating oil changes over time. When the passive bevel gear rotates clockwise, the distribution of the lubricating oil inside the rear axle at different times (, 0.2s, 0.3s, 0.4s) . At , the gear rotates approximately 90°, and part of the lubricating oil is adsorbed on the gear surface and flows along the wall. At , the gear rotates about 180°, more lubricating oil is carried and starts to flow to the top of the rear axle, and more lubricating oil is distributed on the gear surface. At , the gear rotates approximately 360°, and the lubricating oil flowing to the top of the rear axle and distributed on the gear surface gradually drips back to the bottom oil pool under the influence of gravity, lubricating and cooling the main and passive gears, differential gears, and main reducer support bearings. Eventually, a relatively stable dynamic state is reached.
4.2 Dynamic Pressure Distribution Inside the Rear Axle
4.2.1 Dynamic Pressure Distribution of the Passive Bevel Gear
The dynamic pressure distribution of the passive bevel gear at different speeds. The dynamic pressure of the differential housing is almost zero, while the dynamic pressure in the tooth groove and on the tooth surface is relatively large because the tooth groove is immersed in the lubricating oil and is the main churning part. The dynamic pressure distribution in the tooth groove is different, with the maximum dynamic pressure at the tooth root of the tooth groove. When the speed increases from 133rpm to 888rpm, the maximum dynamic pressure of the passive bevel gear significantly increases from 1464Pa to 23715Pa, indicating that the churning resistance will increase significantly with the increase in speed.
4.2.2 Dynamic Pressure Distribution on the Bolt Section of the Passive Bevel Gear
The dynamic pressure distribution on the bolt section of the passive bevel gear at different speeds. As the speed increases, the area of dynamic pressure distribution expands from around the bolt to the top and bottom of the rear axle, and even vortices are generated at the top of the rear axle. The overall dynamic pressure in the bolt peripheral area increases, and the maximum dynamic pressure increases from 967Pa to 9739Pa. A concentrated region with relatively high dynamic pressure and large dynamic pressure gradient is generated on the backflow surface of the bolt , and this concentrated high – pressure region becomes more obvious as the speed increases. The analysis shows that the speed has a significant impact on the dynamic pressure distribution of the rear axle, and the presence of bolts will increase the churning resistance.
4.3 Churning Power and Structural Improvement Under Various Influencing Factors
4.3.1 Influence of Temperature and Speed on Churning Losses
The influence of temperature and speed on the churning power loss of the passive bevel gear. When the lubricating oil temperature decreases from 90°C to 30°C, the churning power slowly increases, approximately increasing by 30W at a speed of 1065rpm. However, the churning power increases sharply with the increase in speed. When the speed increases from 444rpm to 1065rpm, the churning power increases from 21W to 254W at 30°C. The analysis shows that the speed has a greater impact on the churning power, while the temperature has a relatively smaller impact.
4.3.2 Rear Axle Structural Improvement and Drag Reduction Research
The above analysis shows that the bolts connecting the passive bevel gear and the differential housing will generate additional churning resistance. Therefore, a structural improvement scheme of changing the bolted connection gear to a countersunk bolt gear is proposed.
| Model | Description |
|---|---|
| Bolted Connection Passive Bevel Gear Model | Original connection structure |
| Countersunk Bolt Passive Bevel Gear Model | Improved connection structure |
The dynamic pressure distribution of the countersunk bolt passive bevel gear model can significantly reduce the dynamic pressure distribution on the gear and bolt section, reducing power loss. The comparison of dynamic pressure between the two gear models at different speeds. The results show that at different speeds, the countersunk bolt passive bevel gear model can reduce the dynamic pressure by 1.64%, 3.72%, 1.28%, 6.5%, 5.97%, and 2.28%, respectively, reducing the churning power loss.
The comparison of churning power losses between the two gear models at different speeds. The results show that with the increase in speed, the churning power increases sharply. At different speeds, the countersunk bolt passive bevel gear can reduce the churning power by 5.76%, 7.67%, 3.65%, 7.94%, 6.10%, and 8.20%, respectively, proving the correctness of the structural optimization.
5. Bench Test Verification
Bench tests were conducted on the two models before and after structural improvement to measure the transmission efficiency of the rear axle. The two tested passive bevel gear models, and the test bench. It includes a drive motor 2, a transmission shaft protective cover 3, torque and speed sensors 1, 4, and 6, a rear axle sample 5, and load motors at the left and right axle ends. The rear axle 5 has a transparent rear cover to observe the internal flow distribution.
The expression for the rear axle transmission efficiency is:
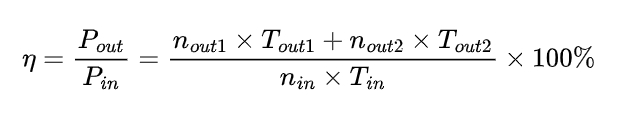
where and are the input and output power, and are the input speed and torque measured by the torque and speed sensor 4, and are the output speeds at the left and right axle ends of the rear axle, and and are the output torques at the left and right axle ends of the rear axle.
The transmission efficiency of the two rear axle structures was tested at different input speeds and torques. When the torque is 81Nm, the transmission efficiency of the rear axle before structural improvement is between (95 – 96)%, with a maximum of 95.9%, and the transmission efficiency after structural improvement (countersunk bolt gear) is between (96 – 97)%, with a maximum of 97%. When the torque is 135Nm, the maximum transmission efficiency before structural improvement is 96.3%, and the maximum transmission efficiency after structural modification is 97.3%. The data shows that under different working conditions, the structural improvement (countersunk bolt gear) can increase the rear axle transmission efficiency by approximately (1 – 1.1)%, effectively reducing churning losses, and the experimental results verify the correctness of the numerical simulation and structural improvement.
6. Conclusions
(1) The flow field distribution law inside the rear axle at different times was obtained, providing a reference for the optimization of the rear axle lubrication oil circuit.
(2) The influence laws of speed, temperature, and bolt structure on the flow field distribution, dynamic pressure distribution, and churning power loss inside the rear axle were studied. The simulation results show that the churning power increases sharply with the increase in speed and slowly decreases with the increase in temperature, and the speed has a greater impact. The bolts cause the flow field on the backflow surface of the bolts to be disordered, forming a region with relatively high dynamic pressure and generating a pressure gradient force, resulting in additional churning losses.
(3) The bolted connection passive bevel gear was changed to a countersunk bolt passive bevel gear, and the structural improvement was completed. Bench efficiency tests were designed for verification. The simulation results show that at different speeds, the structural improvement can reduce the churning power by 5.76%, 7.67%, 3.65%, 7.94%, 6.10%, and 8.20%, respectively. The experimental results show that under different working conditions, the structural improvement (countersunk bolt gear) can increase the rear axle transmission efficiency by approximately (1 – 1.1)%. Both the simulation and experimental results show that the structural improvement of the rear axle passive bevel gear is correct.