
1. Introduction
The hypoid gear pair is located in the main reducer of the rear drive axle of an automobile, serving as a critical transmission component. Its meshing performance directly affects the stability of the rear drive axle, the level of transmission noise, and ultimately the energy consumption and NVH (Noise, Vibration, Harshness) characteristics of the entire vehicle. The meshing performance of hypoid gears is primarily manifested in two aspects: the amplitude of transmission error and the meshing contact pattern on the tooth surface. The machining errors generated during gear manufacturing and the installation errors produced during assembly both have significant influence on the transmission error and meshing contact pattern of the gear pair.
In conventional practice, engineers perform simulations using theoretically designed gear models, but then validate the results through roll testing with actual manufactured gears. This creates an inconsistency in evaluation criteria between simulation and experimental verification. To address this issue, this thesis focuses on real tooth surface reconstruction and investigates the influence of installation errors—including offset distance error ∆V, driving gear axial installation distance error ∆H, driven gear installation distance error ∆E, and shaft angle error ∆Σ—on meshing performance. Based on the findings, the assembly process of the main reducer is optimized to improve transmission stability and reduce noise levels.
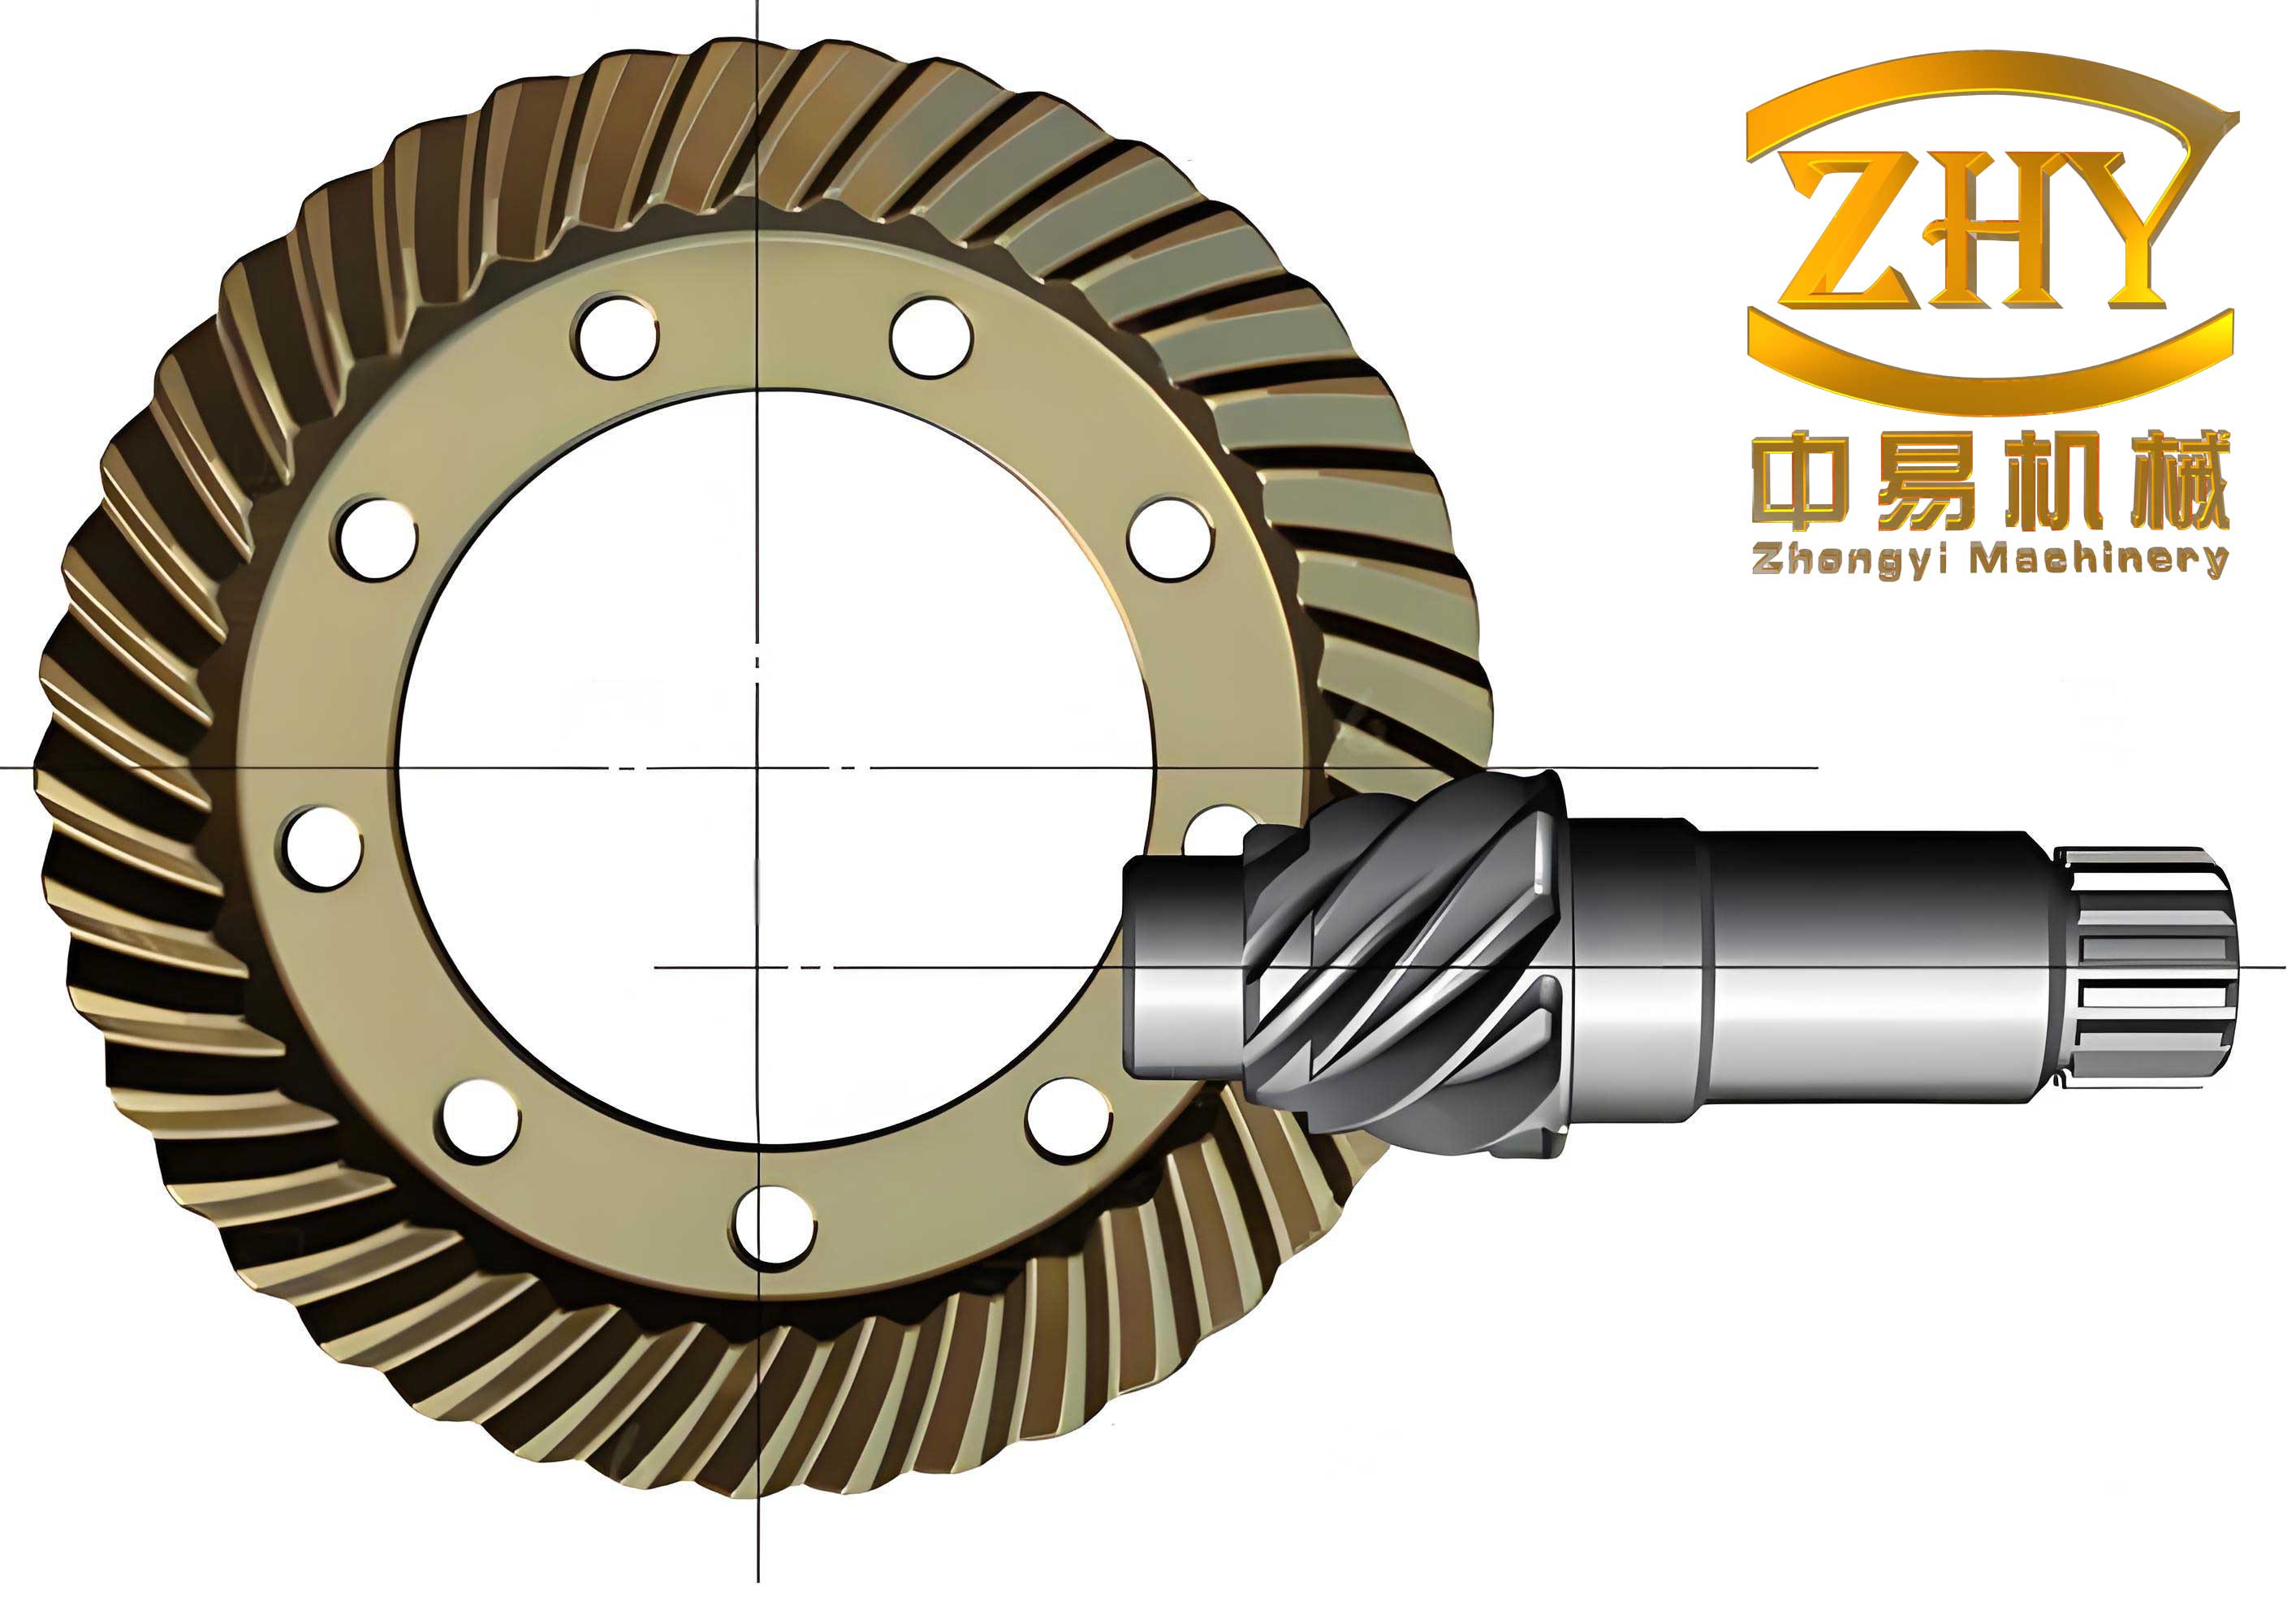
The main research contributions of this work are summarized as follows:
- Analyzing the meshing motion of hypoid gears based on kinematic principles and conjugate surface meshing equations, deriving the equations for meshing contact points and contact paths.
- Constructing real tooth surfaces using NURBS curve and surface fitting methods, establishing three-dimensional models of hypoid gears in CATIA software.
- Conducting finite element simulations using ABAQUS with the reconstructed real tooth surface models, analyzing the effects of installation errors on transmission error and contact patterns.
- Optimizing the assembly process of the main reducer based on the simulation results, verified through roll testing experiments using the Gleason 600HTT tester.
2. Meshing Theory and Error Analysis of Hypoid Gears
2.1 Fundamentals of Hypoid Gear Meshing
Hypoid gears are particularly suitable for transmitting motion and power between intersecting or skew axes. Due to their excellent characteristics—high load-carrying capacity, high contact ratio, low transmission noise, low power loss, strong fatigue resistance, and high reliability—hypoid gears have found wide applications in machine tools, aerospace engineering, and automotive powertrains.
The meshing of gear tooth surfaces can be classified into two categories: local conjugation and complete conjugation. In local conjugation, the tooth surfaces Σ₁ and Σ₂ produce a contact point at each instant of meshing. Connecting these instantaneous contact points forms the contact path L on the tooth surface. For complete conjugation, the tooth surfaces contact along a line at each instant.
According to the gear meshing theory, for a pair of hypoid gears, the following conditions must be satisfied at the contact point: the position vectors must be equal, the normal vectors must be parallel, and the relative velocity must be perpendicular to the common normal. These conditions can be expressed as:
$$\mathbf{r}^{(1)} = \mathbf{r}^{(2)}$$
$$\mathbf{n} \cdot \mathbf{v} = 0$$
$$\mathbf{n}^{(1)} = \mathbf{n}^{(2)}$$
where r is the position vector, n is the unit normal vector, and v is the relative velocity vector at the contact point.
2.2 Transmission Error
In theory, the hypoid gear pair transmits motion at a constant gear ratio. The transmission error is defined as the difference between the actual rotation angle of the driven gear and its theoretical rotation angle when the driving gear rotates through a certain angle. The transmission error can be expressed as:
$$TE = \phi_2(\phi_1) – \phi_2′(\phi_1) = (\phi_2 – \phi_2^{(0)}) – \frac{Z_1}{Z_2}(\phi_1 – \phi_1^{(0)})$$
where Z₁ and Z₂ are the number of teeth on the driving gear and driven gear, respectively; φ₁ is the rotation angle of the driving gear; φ₂ is the actual rotation angle of the driven gear; and φ₂’ is the theoretical rotation angle of the driven gear.
2.3 Installation Errors
During the actual assembly process of hypoid gear pairs, deviations from ideal assembly parameters inevitably occur. These installation errors can be classified into four categories as shown below:
| Installation Error | Notation | Definition |
|---|---|---|
| Offset distance error | ∆V | Deviation of the actual rotation axis of the driving gear from its theoretical axis |
| Driving gear axial installation error | ∆H | Deviation of the actual installation position from the ideal position along the driving gear rotation center direction |
| Driven gear axial installation error | ∆E | Deviation of the actual installation position from the ideal position along the driven gear rotation center direction |
| Shaft angle error | ∆Σ | Deviation of the actual shaft angle between the two gear axes from the standard assembly angle |
Surface roughness of hypoid gears is measured using a Taylor Hobson roughness tester, while meshing contact patterns are inspected using a Gleason 600HTT rolling tester. In the contact area inspection, red lead powder is typically sprayed on the measured gear teeth, and the marks formed by the powder removal during light-load rolling indicate the meshing contact area.
3. Measurement and Reconstruction of Real Tooth Surfaces
3.1 NURBS Curve and Surface Construction
The NURBS (Non-Uniform Rational B-Spline) method is widely used in reverse engineering and surface reconstruction due to its ability to represent complex free-form surfaces accurately. A k-th degree NURBS curve is defined as:
$$p(u) = \frac{\sum_{i=0}^{n} \omega_i d_i N_{i,k}(u)}{\sum_{i=0}^{n} \omega_i N_{i,k}(u)}$$
where ωᵢ is the weight factor, dᵢ is the control point, N_{i,k}(u) is the B-spline basis function defined recursively as:
$$N_{i,0}(u) = \begin{cases} 1 & \text{if } u_i \leq u \leq u_{i+1} \\ 0 & \text{otherwise} \end{cases}$$
$$N_{i,k}(u) = \frac{u-u_i}{u_{i+k}-u_i} N_{i,k-1}(u) + \frac{u_{i+k+1}-u}{u_{i+k+1}-u_{i+1}} N_{i+1,k-1}(u)$$
For cubic NURBS curves (k=3), the matrix form can be expressed as:
$$p_i(u) = \frac{U N_i D_i}{U N_i W_i}$$
For NURBS surfaces, the tensor product form is used:
$$p(u,v) = \frac{\sum_{i=0}^{m} \sum_{j=0}^{n} \omega_{i,j} d_{i,j} N_{i,k}(u) N_{j,l}(v)}{\sum_{i=0}^{m} \sum_{j=0}^{n} \omega_{i,j} N_{i,k}(u) N_{j,l}(v)}$$
The reconstruction of real tooth surfaces of hypoid gears involves the following key steps:
- Determining the parameter directions on the tooth surface (u direction along tooth length, v direction along tooth height).
- Computing node vectors using the accumulated chord length parameterization method.
- Calculating control points through the inversion procedure, first along the u direction and then along the v direction.
- Generating the final NURBS surface using the MATLAB programming environment.
3.2 Measurement Planning for Hypoid Gear Tooth Surfaces
The measurement of actual hypoid gear tooth surfaces is performed using the Gleason 350GMM gear measurement center. The theoretical tooth surface model is imported into the measurement system to serve as a reference surface for planning the measurement path. The tooth surface grid is planned as follows:
- Each tooth surface is divided into a grid of 45 measurement points (9 columns along the tooth length direction × 5 rows along the tooth height direction).
- Grid edges in the tooth height direction are set within 5% of the tooth width, while grid edges in the tooth length direction are set within 10% of the tooth length.
- The grid edge spacing must not exceed 0.7 mm.
The point matrix measurement method is selected due to its high accuracy and minimal interference issues. For measuring the driving gear tooth surfaces, the probe is positioned vertically, while for measuring the driven gear, the probe is positioned horizontally to allow better access to the tooth surfaces.
Before the actual measurement, the coordinate systems must be unified. The gear coordinate system S_w and the measurement coordinate system S_c have the following relationship:
$$X_c = -Y_w, \quad Y_c = -Z_w, \quad Z_c = -X_w \pm d$$
where d is the distance between the origins of the two coordinate systems. The probe radius compensation is also essential to obtain accurate surface coordinates:
$$R_i = r_i \pm n \cdot r_p$$
where Rᵢ is the actual coordinate of the surface point, rᵢ is the probe center coordinate, n is the unit normal vector at the measurement point, and rₚ is the probe radius.
3.3 Real Tooth Surface Reconstruction Results
Using the 45 discrete coordinate points measured on each tooth surface of the hypoid gears, the NURBS curve and surface fitting procedure was executed. First, the control points in the tooth height direction were calculated, followed by the control points in the tooth length direction. The complete set of control points was then imported into CATIA software to construct the NURBS-fitted real tooth surface.
To verify the accuracy of the reconstructed surfaces, a validation procedure was conducted. Forty-five grid points on the theoretical gear tooth surface were used to reconstruct a reference surface through the same NURBS fitting method. The center point of each small quadrilateral formed by four adjacent points was calculated, and the maximum normal distance between the theoretical surface and the reconstructed surface was determined. The reconstruction errors for the driving gear tooth surface are summarized below:
| Grid Column | Maximum Normal Distance (µm) |
|---|---|
| Column 1 | 0.045 |
| Column 2 | 0.062 |
| Column 3 | 0.078 |
| Column 4 | 0.071 |
| Column 5 | 0.055 |
| Column 6 | 0.068 |
| Column 7 | 0.083 |
| Column 8 | 0.089 |
All reconstruction errors are below 0.1 µm, well within acceptable tolerances for engineering applications. The reconstructed three-dimensional models of both the driving and driven hypoid gears were assembled in CATIA according to the theoretical installation distances, providing a solid foundation for subsequent finite element simulations.
4. Investigation of Installation Error Effects on Meshing Performance
4.1 Finite Element Modeling and Simulation Setup
The reconstructed real tooth surface models of the hypoid gears were imported into Hypermesh for mesh generation. To balance computational efficiency and accuracy, the mesh was refined in the contact regions of the gear teeth while using coarser elements elsewhere. The material properties of both gears were set as 20CrMnTi steel: elastic modulus E = 212,000 MPa, Poisson’s ratio ε = 0.3, and density ρ = 7.8 × 10³ kg/mm³.
The contact analysis was performed in ABAQUS using the following setup:
| Analysis Parameter | Setting |
|---|---|
| Contact type | Surface-to-surface contact |
| Master surface | Driving gear contact tooth surface |
| Slave surface | Driven gear contact tooth surface |
| Contact algorithm | Penalty function |
| Sliding formulation | Finite sliding |
| Friction coefficient | 0.1 (dynamic) |
4.2 Transmission Error Comparison between Theoretical and Real Tooth Surfaces
To validate the rationality of using real reconstructed tooth surfaces for simulation, simulations were performed for both the theoretically designed gear pair and the real tooth surface reconstructed gear pair, with all installation errors set to zero. The results showed that the transmission error of the theoretical tooth surface model remained near zero, while the real tooth surface model exhibited a constant value shift. When the transmission error curves were shifted to the X-axis, the amplitude of variation for the real tooth surface gear was significantly larger than that of the theoretical tooth surface gear, confirming the existence of tooth surface errors in actual manufactured gears.
4.3 Effects of Single Installation Errors on Transmission Error
To investigate the influence of each installation error on the transmission error of hypoid gears, a controlled variable approach was adopted. Each installation error was varied within the range shown in the table below while keeping the other installation errors at zero:
| Installation Error | Range | Step |
|---|---|---|
| Offset distance error ∆V | −0.06 to +0.06 mm | 0.02 mm |
| Driving gear axial error ∆H | −0.06 to +0.06 mm | 0.02 mm |
| Driven gear axial error ∆E | −0.06 to +0.06 mm | 0.02 mm |
| Shaft angle error ∆Σ | −0.06° to +0.06° | 0.02° |
4.3.1 Effect of Offset Distance Error ∆V
Simulations were performed for the offset distance error ∆V at values of −0.06 mm, −0.04 mm, −0.02 mm, +0.02 mm, +0.04 mm, and +0.06 mm. The results revealed that as ∆V increased, the transmission error shifted toward the positive direction. The fluctuation amplitude of the transmission error showed minimal variation when ∆V was negative; however, when ∆V was positive, the amplitude variation became more obvious. This is primarily because the change in offset distance error causes a shift of the meshing point along the tooth length direction, and the shift is more sensitive when ∆V changes in the positive direction.
3.3.2 Effect of Driving Gear Axial Error ∆H
Simulations were performed for the driving gear axial installation error ∆H at the same set of values. The results showed that when ∆H increased, the transmission error constant value shifted toward the negative direction. When ∆H was positive, the transmission error amplitude curve was more stable compared to when ∆H was negative. This indicates that a positive driving gear axial error can reduce the fluctuation of the transmission error amplitude to some extent, but the amplitude itself changes more significantly. The phase difference at the peak was also noticeable, mainly due to the shifting of the meshing point in the tooth height direction.
4.3.3 Effect of Driven Gear Axial Error ∆E
The driven gear axial installation error ∆E was varied using the same methodology. The results demonstrated that the transmission error amplitude limits remained approximately the same whether ∆E increased or decreased, and the maximum and minimum values were reached at almost the same phase. This occurs because the driven gear axial error only causes a shift in the backlash and has almost no effect on the meshing point position.
4.3.4 Effect of Shaft Angle Error ∆Σ
For the shaft angle error ∆Σ, the results showed that when ∆Σ deviated further from the standard assembly position, the constant portion of the transmission error deviated more significantly. When ∆Σ was negative, the transmission error amplitude curve fluctuated less, especially at smaller negative values. When ∆Σ was positive, the transmission error amplitude fluctuated more compared to negative values. In summary, any change in ∆Σ causes a relatively dramatic change in the transmission error amplitude.
4.4 Sensitivity Analysis of Transmission Error
To identify which installation errors require the most attention during assembly optimization, a sensitivity analysis was conducted. The transmission error amplitude values obtained from the simulations were extracted and plotted against the installation error values:
| Installation Error | Change Range | Transmission Error Amplitude Range (urad) | Sensitivity Level |
|---|---|---|---|
| ∆V (mm) | −0.06 to +0.06 | 7.8 to 15.6 | Medium |
| ∆H (mm) | −0.06 to +0.06 | 12.7 to 28.4 | High |
| ∆E (mm) | −0.06 to +0.06 | 8.2 to 10.1 | Low |
| ∆Σ (°) | −0.06 to +0.06 | 14.3 to 26.5 | High |
The sensitivity ranking is summarized as:
$$∆\Sigma = ∆H > ∆V > ∆E$$
Based on this ranking, the shaft angle error ∆Σ and the driving gear axial installation error ∆H should be given the highest priority in assembly optimization. The driven gear axial error ∆E can be largely ignored due to its minimal influence. When ∆V changes in the positive direction, the transmission error variation is larger, so positive offset distance errors should be carefully controlled.
4.5 Experimental Validation with Roll Testing
To verify the accuracy of the finite element simulations and the rationality of using real reconstructed tooth surface models, roll testing experiments were conducted using the Gleason 600HTT rolling tester. The tester can simulate the actual meshing conditions of hypoid gear pairs and measure the transmission error, contact pattern, and other performance parameters.
The experimental procedure involved: (1) installing the gear pair at standard assembly distances, (2) adjusting the installation errors by inputting values on the control panel, (3) running the tester at the same rotational speed as the simulation, and (4) recording the experimental results for comparison.
The transmission error amplitudes from three sources—theoretical tooth surface simulation, real tooth surface simulation, and actual roll testing—were compared for the following installation error conditions:
| Installation Error | Value | Theoretical Model (urad) | Real Model (urad) | Actual Gear (urad) |
|---|---|---|---|---|
| ∆V | +0.04 mm | 8.42 | 10.87 | 11.40 |
| ∆V | −0.04 mm | 10.71 | 13.28 | 12.71 |
| ∆H | +0.04 mm | 12.39 | 16.51 | 17.25 |
| ∆H | −0.04 mm | 19.78 | 21.33 | 20.90 |
| ∆Σ | +4 arcsec | 5.71 | 6.86 | 6.80 |
| ∆Σ | −4 arcsec | 4.77 | 6.82 | 6.80 |
The comparative analysis revealed two important findings: (1) the theoretical tooth surface simulation consistently underpredicted the transmission error amplitude compared to actual tests, confirming the existence of tooth surface errors from manufacturing; (2) the real tooth surface simulation results were very close to the actual roll testing values, validating the high accuracy of the reconstructed models and the credibility of the simulation approach.
4.6 Combined Effects of Multiple Installation Errors
Since the shaft angle error ∆Σ is typically very small (90° ± 5 arcsec) in actual main reducer assemblies and the driven gear axial error ∆E has low sensitivity, the combined effects of the offset distance error ∆V and the driving gear axial error ∆H were investigated. Nine groups of simulations were conducted based on the following parameter combinations:
| Experiment No. | ∆V (mm) | ∆H (mm) |
|---|---|---|
| 1 | 0.02 | −0.02 |
| 2 | 0.04 | −0.02 |
| 3 | 0.06 | −0.02 |
| 4 | 0.02 | −0.04 |
| 5 | 0.04 | −0.04 |
| 6 | 0.06 | −0.04 |
| 7 | 0.02 | −0.06 |
| 8 | 0.04 | −0.06 |
| 9 | 0.06 | −0.06 |
The transmission error amplitudes for these combinations are summarized as:
| ∆H(mm) | ∆V = 0.02 mm | ∆V = 0.04 mm | ∆V = 0.06 mm |
|---|---|---|---|
| −0.02 | 11.6 urad | 10.3 urad | 2.8 urad |
| −0.04 | 11.3 urad | 9.6 urad | 2.5 urad |
| −0.06 | 6.7 urad | 7.4 urad | 2.9 urad |
From the results, the following conclusions can be drawn:
- When ∆V is relatively small, a more negative ∆H results in a smaller transmission error amplitude.
- When ∆V is relatively large, a more negative ∆H results in a larger transmission error amplitude.
- The peak of the transmission error shifts toward the right side as ∆H increases.
5. Optimization of Meshing Contact Patterns through Installation Error Control
5.1 Contact Pattern Position and Standardization
In addition to the transmission error amplitude, the meshing contact pattern is another crucial parameter representing the meshing performance of hypoid gear pairs. To quantify the contact pattern position, the contact area is projected onto the axial section of the gear tooth. The geometric parameters A, B, C, and H are defined as follows:
- A: minimum distance from the contact area to the gear small-end boundary in the tooth length direction
- B: maximum length of the contact area in the tooth length direction
- C: minimum distance from the contact area to the gear tooth tip boundary in the tooth height direction
- H: maximum length of the contact area in the tooth height direction
The standardization requirements for the contact area of the specific hypoid gear pair studied in this thesis are:
| Parameter | Acceptable Range | Ideal Value |
|---|---|---|
| A | 5.38–12.90 mm (1/6–1/2.5 of tooth length) | 9.14 mm |
| B | 12.92–21.51 mm (1/2.5–1/1.5 of tooth length) | 17.22 mm |
| C | 1.26–2.21 mm (1/7–1/4 of tooth height) | 1.74 mm |
| H | 2.94–4.41 mm (1/3–1/2 of tooth height) | 3.68 mm |
5.2 Optimization Objective Function
To achieve a standardized contact pattern through the adjustment of installation errors, an optimization objective function is established. The objective is to minimize the deviation of the actual contact pattern parameters from their ideal values while maintaining the transmission error within the desired range:
$$F_{min} = k_a(A_0 – A_x)^2 + k_b(B_0 – B_x)^2 + k_c(C_0 – C_x)^2 + k_h(H_0 – H_x)^2$$
where A₀, B₀, C₀, H₀ are the ideal values; Aₓ, Bₓ, Cₓ, Hₓ are the actual values obtained from the contact analysis; and kₐ, k_b, k_c, k_h are the weight coefficients.
Additionally, the installation error variables must satisfy the constraint conditions:
$$V_1 \leq V \leq V_2, \quad H_1 \leq H \leq H_2, \quad E_1 \leq E \leq E_2, \quad \Sigma_1 \leq \Sigma \leq \Sigma_2$$
5.3 The Golden Section Search Method for Optimization
The golden section search method is selected to solve the optimization problem because the objective function is not an explicit function and cannot be solved analytically. This method is well-suited for single-variable optimization problems and provides reliable results with high computational efficiency.
The initial step involves locating the interval containing the minimum value. Starting with an interval [a, b], the function values f(a) and f(b) are compared to determine the descent direction. Golden ratio points are then selected within the interval to iteratively narrow down the search until the desired precision is achieved.
For the multi-variable installation error optimization in this study, the golden section search method was applied sequentially to each variable while holding the others constant, iterating until convergence.
5.4 Optimization Example and Experimental Validation
An optimization example was conducted using a randomly selected gear pair. The initial installation errors were set as: ∆V = −0.023 mm and ∆H = +0.035 mm, with ∆E = 0 and ∆Σ = 0. Through the golden section search method, the optimized adjustment values were calculated as:
| Parameter | Initial Value | Adjustment | Optimized Value |
|---|---|---|---|
| ∆V | −0.023 mm | +0.011 mm | −0.012 mm |
| ∆H | +0.035 mm | −0.05 mm | −0.015 mm |
The optimized contact patterns simulated on the reconstructed real tooth surface models showed excellent agreement with the standard contact area requirements. The simulation results for the driving gear concave surface and driven gear convex surface contact patterns were then verified through actual roll testing on the Gleason 600HTT machine. The contact pattern imprints from the roll testing closely matched the simulation results, confirming that:
- The reconstructed real tooth surface models have high accuracy.
- The contact pattern standardization method based on installation error adjustment is reliable.
- The combination of contact pattern and transmission error as quantitative criteria for assembly optimization is effective.
6. Assembly Process Optimization of the Main Reducer
6.1 Structure and Current Assembly Process
The main reducer of the rear drive axle consists of the differential assembly and the main reducer subassembly. The current assembly process involves several manual steps where skilled workers select adjustment shims based on subjective experience. This leads to inconsistent quality and low efficiency. The critical installation errors in the assembly can be determined using the relationship:
$$L_1 = \Delta H + H + e$$
where L₁ is the distance from the bearing surface in the housing to the center of the driven gear mounting hole, H is the standard installation distance of the driving gear (92 mm in this study), and e is the thickness of the adjustment shim.
Statistical process control monitoring of the housing offset distance dimensions revealed that the offset is typically within a tolerance of 0.02 mm.
6.2 Assembly Optimization Based on Transmission Error
Based on extensive vehicle testing data, the transmission error of the main reducer should be maintained between 8 and 14 urad to meet the noise control standard of 62 dB. Five groups of gear pairs and one reducer housing were randomly selected for assembly optimization. The measured housing offset distance was 24.985 mm, resulting in an initial offset distance error of ∆V = −0.015 mm.
Using the reconstructed real tooth surface models and the value of ∆V = −0.015 mm, simulations were performed to determine the appropriate driving gear axial installation error ∆H that keeps the transmission error within the acceptable range:
| Main Reducer No. | Transmission Error (urad) | Required ∆H (mm) |
|---|---|---|
| 1 | 9.71 | 0.038 |
| 2 | 12.59 | 0.027 |
| 3 | 8.33 | 0.043 |
| 4 | 11.66 | 0.019 |
| 5 | 10.73 | 0.016 |
6.3 Assembly Optimization Based on Contact Pattern Standardization
To further improve the meshing performance, the contact pattern optimization was performed using the golden section search method with the transmission-error-based installation errors as initial values. The final installation error combinations and the corresponding shim thicknesses are shown below:
| Main Reducer No. | Initial ∆V (mm) | Initial ∆H (mm) | Adjusted ∆V (mm) | Adjusted ∆H (mm) | Shim Thickness (mm) | Final TE (urad) |
|---|---|---|---|---|---|---|
| 1 | −0.015 | 0.038 | 0.0011 | −0.008 | 1.382 | 10.63 |
| 2 | −0.015 | 0.027 | 0.0020 | −0.006 | 1.277 | 9.55 |
| 3 | −0.015 | 0.043 | 0.0050 | −0.026 | 1.336 | 7.58 |
| 4 | −0.015 | 0.019 | 0.0045 | −0.022 | 1.259 | 12.71 |
| 5 | −0.015 | 0.016 | 0.0230 | −0.009 | 1.295 | 8.94 |
The final assembly optimization was validated through roll testing experiments on all five gear pairs. The results confirmed that:
- The transmission error of all five gear pairs remained within the controlled amplitude range of 8–14 urad.
- The meshing contact patterns of all five gear pairs were positioned within the standard area on the tooth surface.
- The shim thickness values obtained through the optimization process showed good consistency, indicating the reliability of the method and its potential to reduce assembly variability.
This comprehensive approach—starting from housing measurement, through transmission error control and contact pattern standardization using reconstructed real tooth surfaces—effectively replaces subjective experience-based shim selection with objective, data-driven assembly guidance, thereby improving both assembly quality and efficiency for hypoid gears.
7. Conclusions and Outlook
7.1 Conclusions
The hypoid gear pair in the rear drive axle main reducer is a critical transmission component whose meshing performance directly affects vehicle stability and NVH characteristics. This thesis addressed the inconsistency between simulation evaluation criteria (theoretical tooth surfaces) and experimental verification (actual manufactured gears) by reconstructing real tooth surfaces and studying the influence of installation errors on meshing performance. The main conclusions are:
- The meshing equations and contact analysis methods for hypoid gears were systematically established, providing a theoretical foundation for subsequent analyses.
- The NURBS curve and surface fitting methods were successfully applied to reconstruct the real tooth surfaces of hypoid gears with high accuracy (errors below 0.1 µm), and three-dimensional models were established in CATIA software.
- The sensitivity of transmission error to installation errors was determined through finite element simulations: the ranking is ∆Σ = ∆H > ∆V > ∆E. The shaft angle error and driving gear axial installation error require the most strict control during assembly.
- The combined effects of multiple installation errors on transmission error were characterized, providing practical guidance for assembly error control.
- The golden section search method combined with the reconstructed real tooth surface models successfully optimized the meshing contact pattern, achieving both contact pattern standardization and transmission error control.
- The assembly process optimization of the main reducer based on simulation results was validated through roll testing experiments, demonstrating improved assembly quality and efficiency for hypoid gears.
7.2 Future Work
Several aspects of this research can be further explored in the future:
- Vehicle-level NVH testing could be conducted to further investigate the relationship between gear meshing performance and overall vehicle noise characteristics.
- Contact stress analysis could be incorporated to explore the relationship between meshing stress and contact patterns, providing additional guidance for improving the meshing performance of hypoid gears.
- The current study focused on gear assembly errors; combining gear tooth surface modifications with installation error optimization could yield even better meshing performance for hypoid gears.