
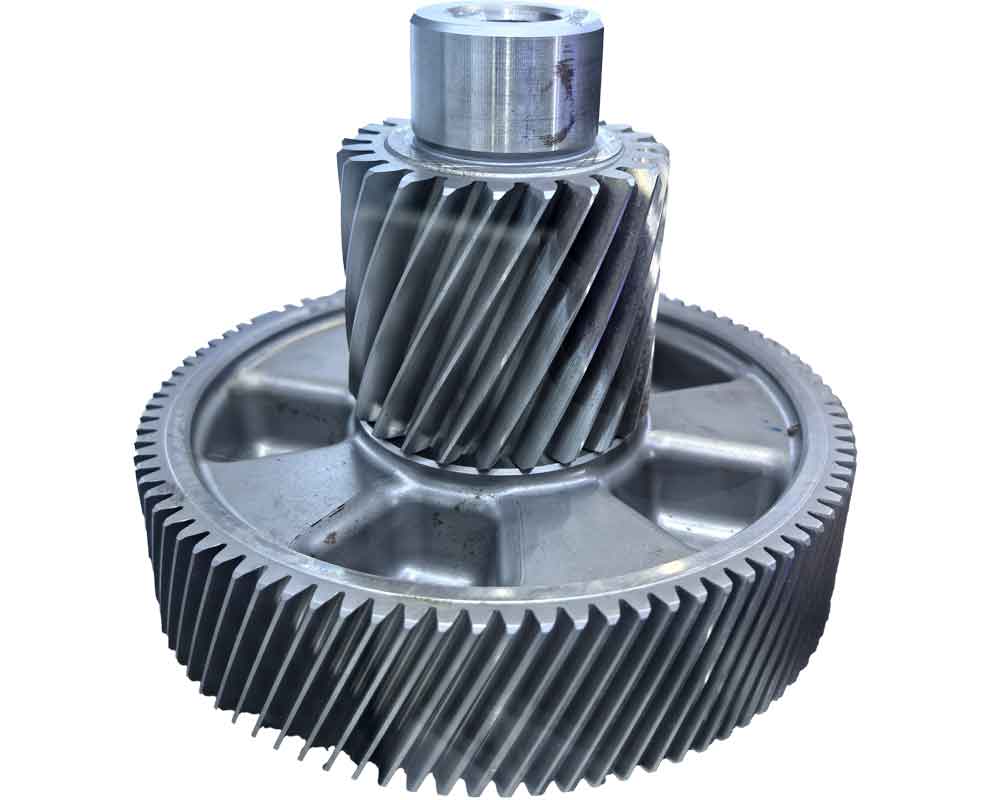
My research is centered on gear cutting and, more specifically, on the final grinding operation that controls the surface quality of hardened gear flanks. In gear cutting, the last manufacturing step often determines whether a gear can survive high-speed, heavy-load service. I have focused on 20CrMnTi gear steel because it is one of the most widely used materials for industrial gears, and because its mechanical properties make it suitable for demanding applications such as aerospace equipment, renewable-energy transmissions, large marine drives, and automotive gearboxes. In these applications, pitting, scuffing, fracture, and early crack initiation are common failure modes. I have found that controlling residual stress and reducing surface roughness after grinding can strongly inhibit crack initiation and extend service life. Therefore, I investigated how radial prestress loading during grinding changes surface roughness, residual stress, and grinding force. My goal was to determine whether a controlled radial prestress can improve the ground surface and to identify optimal grinding parameters through response surface methodology.
1. Why Gear Cutting and Grinding Surface Quality Matter
Gear cutting is not a single operation; it is a chain of processes that includes hobbing, shaping, shaving, heat treatment, and final grinding. Among these, grinding is the last opportunity to correct distortion and to establish the final surface integrity. In my work, I treat grinding as a precision machining process in which each abrasive grain acts as a tiny cutting tool. Because the undeformed chip thickness in grinding is extremely small, often between \(10^{-4}\) mm and \(10^{-2}\) mm, the specific grinding energy becomes very high. The size effect can be expressed as:
$$E_\tau = \frac{K}{a_e}$$
where \(E_\tau\) is the specific grinding energy, \(a_e\) is the grinding layer thickness, and \(K\) is a constant. This relationship explains why grinding generates intense heat and why the surface layer can undergo plastic deformation, phase transformation, and residual stress evolution. In gear cutting, these effects are critical because the gear flank must maintain accuracy and fatigue resistance throughout its service life.
I have observed that the surface quality of a ground gear can be evaluated by two main groups of indicators. The first group includes surface features such as roughness, waviness, scratches, and burn marks. The second group includes subsurface characteristics such as residual stress, microhardness, phase transformation, and microcracks. In my study, I use surface roughness, residual stress, and grinding force as the main response variables because they are directly connected to gear performance and can be extracted from finite element simulations.
2. Theoretical Basis of Prestressed Grinding
2.1 Grinding Stages
I consider the grinding process to consist of three stages: rubbing, ploughing, and chip formation. In the rubbing stage, the abrasive grain contacts the workpiece surface and produces only elastic deformation. In the ploughing stage, the grain penetrates the surface and pushes material to the sides and front without forming a chip. In the chip formation stage, the penetration depth exceeds a critical value and a chip is created. These stages are important for gear cutting because the transition from ploughing to cutting determines the surface roughness and the grinding force.
2.2 Contact Arc Length
I use the geometric contact arc length as a first approximation:
$$l_g = \sqrt{a_p d_s}$$
where \(a_p\) is the grinding depth and \(d_s\) is the wheel diameter. When the workpiece feed is considered, the kinematic contact arc length becomes:
$$l_k = \left(1 + \frac{v_w}{60v_s}\right)\sqrt{a_p d_s}$$
where \(v_w\) is the workpiece speed and \(v_s\) is the wheel speed. Because the ratio \(v_w/v_s\) is usually small, the geometric contact arc length is often used for practical calculations. In gear cutting, the contact arc length influences the number of active grains, the heat flux, and the distribution of residual stress.
2.3 Chip Thickness and Equivalent Chip Thickness
The maximum undeformed chip thickness can be written as:
$$h_{max} = \left[\frac{4}{C r}\left(\frac{v_w}{v_s}\right)\left(\frac{a_p}{d_e}\right)^{1/2}\right]^{1/2}$$
where \(C\) is the number of active cutting edges per unit area, \(r\) is the ratio of chip width to average chip thickness, and \(d_e\) is the equivalent wheel diameter. The average chip thickness and equivalent chip thickness are also useful:
$$h_m = \frac{1}{c l_m b_m} a_p \frac{v_w}{v_s} = A a_p \frac{v_w}{v_s}$$
$$h_{eq} = a \frac{v_w}{v_s} = \frac{Z’}{v_s}$$
Here, \(Z’\) is the specific material removal rate. These equations show that increasing the wheel speed reduces the equivalent chip thickness, which tends to reduce the grinding force and improve surface finish. However, increasing the workpiece speed or grinding depth increases the chip thickness and can degrade surface quality. In my work, I use these relationships to interpret the simulation results.
3. Gear as a Thick-Walled Cylinder
To apply radial prestress to a gear, I first needed to determine the maximum allowable load that would not cause plastic collapse of the inner bore. I therefore modeled the gear as a thick-walled cylinder with an inner radius \(R_i\) and an outer radius \(R_o\). For my 20CrMnTi gear, the inner bore radius was \(R_i = 15\) mm and the tooth-tip radius was \(R_o = 32\) mm. The material yield strength was taken as \(\sigma_s = 835\) MPa. The gear parameters are summarized in Table 1.
| Parameter | Symbol | Value |
|---|---|---|
| Module | \(m\) | 2 |
| Number of teeth | \(z\) | 30 |
| Pressure angle | \(\alpha\) | 20° |
| Inner bore radius | \(R_i\) | 15 mm |
| Tooth-tip radius | \(R_o\) | 32 mm |
| Yield strength | \(\sigma_s\) | 835 MPa |
| Elastic modulus | \(E\) | 207 GPa |
| Poisson ratio | \(\nu\) | 0.25 |
| Density | \(\rho\) | 7800 kg/m³ |
The equilibrium equation for an axisymmetric thick-walled cylinder is:
$$\frac{d\sigma_r}{dr} + \frac{\sigma_r – \sigma_\theta}{r} = 0$$
The strain-displacement relations are:
$$\varepsilon_r = \frac{du}{dr}, \quad \varepsilon_\theta = \frac{u}{r}$$
Using Hooke’s law for plane strain and the boundary conditions:
$$\sigma_r|_{r=R_i} = -q, \quad \sigma_r|_{r=R_o} = 0$$
I obtained the radial and tangential stresses:
$$\sigma_r = -\frac{q}{R_o^2/R_i^2 – 1}\left(\frac{R_o^2}{r^2} – 1\right)$$
$$\sigma_\theta = \frac{q}{R_o^2/R_i^2 – 1}\left(\frac{R_o^2}{r^2} + 1\right)$$
The von Mises stress is:
$$\sigma_i = \frac{\sqrt{3} R_o^2}{R_o^2/R_i^2 – 1}\frac{q}{r^2}$$
The maximum von Mises stress occurs at the inner bore. Setting \(\sigma_i = \sigma_s\) at \(r = R_i\), the elastic limit pressure is:
$$q_e = \left(1 – \frac{R_i^2}{R_o^2}\right)\frac{\sigma_s}{\sqrt{3}}$$
Substituting \(R_i = 15\) mm, \(R_o = 32\) mm, and \(\sigma_s = 835\) MPa gives:
$$q_e = \left(1 – \frac{15^2}{32^2}\right)\frac{835}{\sqrt{3}} \approx 376.16 \text{ MPa}$$
This means that I can apply radial prestress up to approximately 376 MPa without causing general yielding of the gear bore. In my simulations and experiments, I used prestress levels below this limit. I also compared the stress distribution in the gear with that in an equivalent thick-walled cylinder. The radial and tangential stress trends matched well, confirming that the equivalent model is reasonable for gear cutting research.
4. Radial Prestress Loading Experiment
I designed and built a radial prestress loading platform to validate the equivalent thick-walled cylinder model. The platform consisted of two fixed ends, loading half-rings, and a trapezoidal screw. When I applied torque to the screw, the half-rings moved radially outward against the inner bore of the gear. This created a controlled radial prestress. I used strain gauges to measure the strain at a radius of \(r = 22\) mm. The strain gauge parameters are given in Table 2, and the strain indicator parameters are given in Table 3.
| Parameter | Value |
|---|---|
| Model | Foil strain gauge |
| Resistance | 120.0 ± 0.3 Ω |
| Sensitivity coefficient | 2.11 ± 1% |
| Grade | A |
| Parameter | Value |
|---|---|
| Number of channels | 16 strain channels, 1 force channel |
| Range | ±25000 με |
| Accuracy | 0.2% ± με |
| Sampling speed | ≤16 points/s |
| Zero drift | <3 με/4 h |
| Bridge voltage | 2 VDC |
| Operating voltage | 220 V ± 10%, 50 Hz |
The radial stress at the measurement point was calculated from the measured strain using:
$$\sigma_r = E \varepsilon$$
I then used the thick-walled cylinder solution to back-calculate the applied internal pressure \(q\). The experimental, theoretical, and simulated strain values are compared in Table 4. The experimental and theoretical values agreed closely. The simulated values were slightly higher because of mesh discretization, but the trend was consistent.
| Experimental strain (10-6) | Experimental \(q\) (MPa) | Theoretical strain (10-6) | Theoretical \(q\) (MPa) | Simulated strain (10-6) | Simulated \(q\) (MPa) |
|---|---|---|---|---|---|
| 2.01 | 1.4 | 2 | 1.3177 | 3.61 | 1.3177 |
| 4.13 | 2.8 | 4 | 2.6354 | 5.66 | 2.6354 |
| 6.33 | 4.1 | 6 | 3.9531 | 8.53 | 3.9531 |
| 8.21 | 5.3 | 8 | 5.2708 | 11.38 | 5.2708 |
| 10.51 | 6.6 | 10 | 6.5885 | 14.25 | 6.5885 |
I also measured the common normal length of the gear under different prestress levels. The common normal length increased slightly as the prestress increased, and it returned close to its original value after unloading. This reversible change confirmed that the gear remained within the elastic range. The measurement results are shown in Table 5. These results further validated the equivalent thick-walled cylinder model and gave me confidence to proceed with the grinding simulation.
| Strain (με) | Initial | 0 | 2 | 4 | 6 | 8 | 10 | After unloading |
|---|---|---|---|---|---|---|---|---|
| Measurement 1 | 21.332 | 21.334 | 21.335 | 21.337 | 21.351 | 21.356 | 21.328 | — |
| Measurement 2 | 21.331 | 21.331 | 21.332 | 21.336 | 21.349 | 21.355 | 21.329 | — |
| Measurement 3 | 21.329 | 21.329 | 21.337 | 21.339 | 21.346 | 21.358 | 21.331 | — |
| Average | 21.3307 | 21.3313 | 21.3347 | 21.3373 | 21.3487 | 21.3563 | 21.3293 | — |
5. Single-Grit Grinding Simulation with Radial Prestress
5.1 Model Setup
I created a three-dimensional single-grit grinding model in ABAQUS. The gear and abrasive grain were first modeled in SOLIDWORKS and then imported into ABAQUS. Because the gear is symmetric and each tooth experiences similar grinding conditions, I simplified the model to one tooth. For the wheel, I used a single abrasive grain. This reduced the computational cost while still capturing the local material removal mechanism. The abrasive grain was modeled as a truncated cone with a tip radius. The relationship between the tip radius \(r_g\), the grain diameter \(d\), and the cone angle \(2\theta\) was approximated as:
$$r_g = \frac{1}{16}d + 1.75$$
$$2\theta = \frac{1}{35}d + 98$$
I used the Johnson-Cook constitutive model to describe the flow stress of 20CrMnTi:
$$\sigma = (A + B\varepsilon^n)\left(1 + C \ln\frac{\dot{\varepsilon}}{\dot{\varepsilon}_0}\right)\left[1 – \left(\frac{T – T_r}{T_m – T_r}\right)^m\right]$$
Here, \(A\) is the quasi-static yield strength, \(B\) is the strain hardening coefficient, \(n\) is the strain hardening exponent, \(C\) is the strain-rate sensitivity coefficient, \(m\) is the temperature sensitivity coefficient, \(T_r\) is the reference temperature, \(T_m\) is the melting temperature, and \(\dot{\varepsilon}_0\) is the reference strain rate. The Johnson-Cook damage model was used to simulate chip separation:
$$D = \sum \frac{\Delta \bar{\varepsilon}^p}{\bar{\varepsilon}^f_p}$$
$$\bar{\varepsilon}^f_p = [D_1 + D_2 \exp(D_3 \sigma^*)]\left[1 + D_4 \ln\frac{\dot{\varepsilon}^p}{\dot{\varepsilon}_0}\right]\left[1 – D_5\left(\frac{T – T_r}{T_m – T_r}\right)^m\right]$$
where \(\sigma^*\) is the stress triaxiality, \(\Delta \bar{\varepsilon}^p\) is the increment of equivalent plastic strain, and \(\bar{\varepsilon}^f_p\) is the failure strain. The material constants used in my simulation are listed in Table 6 and Table 7.
| Parameter | \(A\) | \(B\) | \(n\) | \(C\) | \(m\) |
|---|---|---|---|---|---|
| Value | 303 | 192 | 0.06 | 0.31 | 0.706 |
| Parameter | \(D_1\) | \(D_2\) | \(D_3\) | \(D_4\) | \(D_5\) |
|---|---|---|---|---|---|
| Value | -0.77 | 1.45 | -0.47 | 0.014 | 3.87 |
5.2 Material Properties and Boundary Conditions
The material properties of the gear and the abrasive grain are given in Table 8. The gear was made of 20CrMnTi, and the abrasive grain was modeled as microcrystalline corundum. The gear was meshed with C3D8RT elements in the dynamic temperature-displacement analysis, and the abrasive grain was treated as a rigid body. The contact between the grain and the gear was defined as surface-to-node contact with a penalty friction coefficient of 0.2 and hard normal contact. The gear was fixed at one end face, and the grain was given a velocity equal to the wheel speed.
| Property | 20CrMnTi | Abrasive grain |
|---|---|---|
| Density (kg/m³) | 7800 | 3250 |
| Elastic modulus (GPa) | 207 | 400 |
| Poisson ratio | 0.25 | 0.22 |
| Thermal conductivity (W/(m·K)) | 40 | 30 |
| Specific heat (J/(kg·K)) | 406 | 1087 |
| Inelastic heat fraction | 0.9 | 0.9 |
I used a restart analysis to apply the radial prestress before grinding. First, I performed a static analysis with the prestress load. Then, I restarted the analysis with an explicit dynamic temperature-displacement step and imported the initial stress state. The wheel speed was calculated from:
$$v = \frac{\pi d_0 n_0}{1000}$$
where \(d_0\) is the wheel diameter and \(n_0\) is the spindle speed. The grinding conditions are summarized in Table 9. I varied the prestress level, grinding depth, and wheel speed to study their effects on surface roughness, residual stress, and grinding force.
| Condition | Values |
|---|---|
| Prestress level (MPa) | 0, 100, 150, 200 |
| Grinding depth (μm) | 50, 55, 60, 65, 70 |
| Wheel speed (m/s) | 10.46, 15.7, 31.4, 36.6, 52.3 |
5.3 Surface Roughness Results
After grinding, I sectioned the ground groove and extracted nodal displacements from three regions: the entry region, the steady grinding region, and the exit region. I calculated the surface roughness using:
$$R_a = \frac{1}{n}\sum Z_i$$
The results showed that applying radial prestress reduced the surface roughness. For a given grinding depth, the roughness increased with wheel speed. This is because a higher wheel speed changes the interaction time between the grain and the workpiece, and the chip evacuation becomes less efficient. The roughness also increased with grinding depth. However, at the same grinding depth and wheel speed, the prestressed specimens had lower roughness than the non-prestressed specimens. Table 10 summarizes the roughness trends.
| Grinding depth | Wheel speed effect | Prestress effect |
|---|---|---|
| 50 μm | \(R_a\) increases with \(v_s\) | \(R_a\) decreases as prestress increases |
| 60 μm | \(R_a\) increases with \(v_s\) | \(R_a\) decreases as prestress increases |
| 70 μm | \(R_a\) increases with \(v_s\) | \(R_a\) decreases as prestress increases |
These trends indicate that a moderate radial prestress can improve the ground surface quality in gear cutting. The prestress increases the local stiffness of the gear bore and changes the plastic deformation mode near the ground surface. As a result, the material is removed more uniformly and the roughness is reduced.
5.4 Residual Stress Results
Residual stress is one of the most important indicators of surface integrity. In my simulations, I extracted the residual stress along the grinding direction and perpendicular to it. I found that the residual stress was mostly compressive. The absolute value of the compressive residual stress increased with prestress. This is beneficial because compressive residual stress can suppress crack initiation and improve fatigue life. The effects of grinding depth and wheel speed were more complex. In general, increasing the wheel speed reduced the absolute value of the compressive residual stress. When the grinding depth was greater than 60 μm, the absolute value of the residual stress increased with grinding depth. Table 11 summarizes the residual stress trends.
| Variable | Effect on residual stress |
|---|---|
| Prestress increases | Absolute compressive residual stress increases |
| Grinding depth increases (below 60 μm) | Small change |
| Grinding depth increases (above 60 μm) | Absolute compressive residual stress increases |
| Wheel speed increases | Absolute compressive residual stress decreases |
The generation of residual stress in grinding is caused by coupled thermal and mechanical effects. The thermal effect tends to produce tensile residual stress, while the mechanical effect tends to produce compressive residual stress. When I applied radial prestress, the mechanical effect became more dominant, and the compressive residual stress increased. This is one of the main reasons why prestressed grinding can improve the fatigue performance of gear cutting surfaces.
5.5 Grinding Force Results
The grinding force is directly related to the energy consumption, wheel wear, and surface quality. In my simulations, I found that the grinding force increased with grinding depth and wheel speed. However, the effect of prestress on the grinding force was relatively small. In some cases, a moderate prestress slightly reduced the grinding force. This is because the prestress changes the stress state in the workpiece and can promote more efficient chip formation. Table 12 summarizes the grinding force trends.
| Variable | Effect on grinding force |
|---|---|
| Prestress increases | Small fluctuation, sometimes reduces force |
| Grinding depth increases | Force increases significantly |
| Wheel speed increases | Force increases slightly |
For gear cutting, a smaller grinding force is desirable because it reduces deflection, improves dimensional accuracy, and lowers the risk of burn. Although the prestress did not dramatically reduce the grinding force, it did not significantly increase it either. This means that radial prestress can be used as a surface-quality improvement method without causing an excessive increase in grinding force.
6. Response Surface Optimization
6.1 Box-Behnken Design
To optimize the grinding parameters under radial prestress, I used response surface methodology. The three factors were prestress level, grinding depth, and wheel speed. Each factor was assigned three levels. I used a Box-Behnken design with 17 sampling points. The factor levels are shown in Table 13, and the response objectives are shown in Table 14.
| Factor | Symbol | Level -1 | Level 0 | Level +1 |
|---|---|---|---|---|
| Prestress (MPa) | A | 100 | 150 | 200 |
| Grinding depth (μm) | B | 50 | 60 | 70 |
| Wheel speed (m/s) | C | 10.46 | 31.4 | 52.3 |
| Response | Description | Optimization goal |
|---|---|---|
| \(R_1\) | Surface roughness \(R_a\) (μm) | Minimize |
| \(R_2\) | Residual stress \(\sigma\) (MPa) | Maximize absolute compressive value |
| \(R_3\) | Grinding force \(F\) (N) | Minimize |
The Box-Behnken sampling points and simulation results are listed in Table 15. I then fitted quadratic response surface models to the data.
| Run | A | B | C | \(R_1\) | \(R_2\) | \(R_3\) |
|---|---|---|---|---|---|---|
| 1 | 150 | 60 | 31.4 | 0.3771 | -136.81 | 25.82 |
| 2 | 200 | 50 | 31.4 | 0.2634 | -83.0952 | 20.61 |
| 3 | 100 | 50 | 31.4 | 0.52 | -50.953 | 21.49 |
| 4 | 200 | 60 | 52.3 | 0.4312 | -155.971 | 27.13 |
| 5 | 150 | 70 | 52.3 | 0.4268 | -130.216 | 34.08 |
| 6 | 100 | 70 | 31.4 | 0.6031 | -160.36 | 31.65 |
| 7 | 150 | 60 | 31.4 | 0.3771 | -136.81 | 25.82 |
| 8 | 100 | 60 | 52.3 | 0.5431 | -65.834 | 25.09 |
| 9 | 150 | 60 | 31.4 | 0.3771 | -136.81 | 25.82 |
| 10 | 200 | 60 | 10.46 | 0.46 | -270.179 | 25.71 |
| 11 | 150 | 50 | 52.3 | 0.3912 | -70.6253 | 25.6 |
| 12 | 150 | 70 | 10.46 | 0.5991 | -203.549 | 29.17 |
| 13 | 150 | 60 | 31.4 | 0.4586 | -136.81 | 25.82 |
| 14 | 150 | 60 | 31.4 | 0.3771 | -136.81 | 25.82 |
| 15 | 200 | 70 | 31.4 | 0.4527 | -200.079 | 30.546 |
| 16 | 100 | 60 | 10.46 | 0.59 | -114.683 | 25.61 |
| 17 | 150 | 50 | 10.46 | 0.3861 | -165.342 | 19.17 |
6.2 ANOVA and Response Surface Equations
I used analysis of variance to check the adequacy of the response surface models. The results are shown in Table 16. The \(P\)-values were less than 0.05, the correlation coefficients were greater than 0.9, and the signal-to-noise ratios were greater than 4. These indicators confirmed that the models fit the simulation data well.
| Statistic | \(R_1\) | \(R_2\) | \(R_3\) |
|---|---|---|---|
| Sum of squares | 0.1337 | 42293.14 | 210.04 |
| \(P\)-value | 0.0026 | 0.0165 | 0.0029 |
| \(F\)-value | 10.57 | 5.63 | 10.16 |
| \(R^2\) | 0.9314 | 0.9786 | 0.9289 |
| Adjusted \(R^2\) | 0.8433 | 0.7225 | 0.8375 |
| Predicted \(R^2\) | 0.4377 | -0.9427 | -0.1376 |
| Adequate precision | 11.6530 | 9.1948 | 10.9229 |
The fitted quadratic response surface equations are given in Table 17. These equations allowed me to analyze the interaction effects between the grinding parameters.
| Response | Fitted equation |
|---|---|
| \(R_1\) | \(f_1 = 1.25507 – 0.012245A – 0.001475B + 0.00333C + 0.000053AB + 4.525\times10^{-6}AC – 0.000222BC + 0.00024A^2 + 0.000056B^2 + 0.00013C^2\) |
| \(R_2\) | \(f_2 = 538.14229 – 1.29389A – 16.13539B + 3.74736C – 0.003788AB + 0.01634AC – 0.02673BC + 0.000791A^2 + 0.11211B^2 – 0.042085C^2\) |
| \(R_3\) | \(f_3 = -14.2445 + 0.04452A – 0.2684B + 0.043050C – 0.000112AB + 0.000485AC – 0.0019BC – 0.0000173A^2 + 0.00687B^2 + 0.001245C^2\) |
6.3 Interaction Effects
I analyzed the interaction effects of the three factors on roughness, residual stress, and grinding force. For roughness, the interaction between prestress and grinding depth showed that increasing both factors reduced roughness. The interaction between grinding depth and wheel speed showed that increasing both factors increased roughness. The interaction between prestress and wheel speed showed that increasing prestress reduced roughness, while increasing wheel speed increased roughness. These trends are consistent with the single-factor results.
For residual stress, the interaction between prestress and grinding depth showed that increasing both factors increased the absolute compressive residual stress. The interaction between prestress and wheel speed showed that increasing prestress increased the compressive residual stress, while increasing wheel speed reduced it. The interaction between grinding depth and wheel speed showed that increasing grinding depth increased the compressive residual stress, while increasing wheel speed reduced it.
For grinding force, the interaction between prestress and grinding depth showed that grinding depth had a much stronger effect than prestress. The interaction between prestress and wheel speed showed only a small change in grinding force. The interaction between grinding depth and wheel speed showed that increasing both factors increased the grinding force, with grinding depth having the larger effect.
6.4 Optimization Results
I used the optimization module to find the best combination of parameters. The objectives were to minimize roughness, maximize the absolute compressive residual stress, and minimize the grinding force. The optimal parameters were:
| Parameter | Optimal value |
|---|---|
| Prestress | 172.545 MPa |
| Grinding depth | 50 μm |
| Wheel speed | 32.631 m/s |
At these optimal conditions, the predicted surface roughness was 0.281 μm, the residual stress was -200.798 MPa, and the grinding force was 19.025 N. The improvements compared with the initial condition are shown in Table 18.
| Response | Before optimization | After optimization | Improvement |
|---|---|---|---|
| Roughness (μm) | 0.320 | 0.281 | 12.2% |
| Residual stress (MPa) | -131.571 | -200.798 | 52.6% |
| Grinding force (N) | 19.431 | 19.025 | 19.8% |
These results show that radial prestress combined with optimized grinding parameters can significantly improve the surface quality of gear cutting. The residual stress improvement was especially large, which is important for fatigue life. The grinding force improvement was moderate, and the roughness improvement was meaningful for precision gears.
7. Discussion
My study demonstrates that radial prestress loading is a promising method for improving the surface integrity of ground gears. The key mechanism is that the prestress changes the stress state in the workpiece before and during grinding. When the prestress is applied, the inner bore of the gear expands elastically. This elastic deformation alters the local stress field near the ground tooth. During grinding, the mechanical and thermal loads interact with the prestress field. After unloading, the elastic recovery of the gear body modifies the residual stress in the ground surface layer. As a result, a larger compressive residual stress can be retained.
I also found that the effect of prestress on roughness is indirect. The prestress does not change the wheel speed or the grinding depth directly. Instead, it changes the plastic deformation behavior and the amount of elastic recovery. This can reduce the height of surface peaks and improve the uniformity of the ground surface. In gear cutting, this is beneficial because a smoother surface reduces stress concentration and improves contact fatigue resistance.
The grinding force results show that prestress does not cause a large increase in force. This is important for practical applications because an excessive force could deflect the gear, reduce accuracy, or damage the grinding wheel. Since the force change was small, radial prestress can be implemented without a major redesign of the grinding machine or the fixture.
The response surface models provided a systematic way to optimize the process. The Box-Behnken design required only 17 simulation runs, which is efficient compared with a full factorial design. The quadratic equations captured the curvature and interaction effects well. The optimal parameters identified in my study can be used as a starting point for industrial trials.
However, I also recognize several limitations. First, my simulation used a single abrasive grain rather than a full grinding wheel. A full wheel includes many grains with random shapes and distributions, which can affect the surface roughness and force. Second, I applied only radial prestress. In real gear cutting, axial loads, thermal loads, and clamping forces may also be present. Third, I fixed the inner bore radius. If the bore radius changes, the elastic limit pressure and the optimal prestress level will change. Future work should address these factors.
8. Conclusions
I have studied the influence of radial prestress loading on the surface quality of 20CrMnTi gears during grinding. My main conclusions are as follows:
1. The gear can be reasonably modeled as a thick-walled cylinder. For an inner bore radius of 15 mm, an outer radius of 32 mm, and a yield strength of 835 MPa, the maximum elastic prestress is about 376.16 MPa. This provides a safe upper bound for radial prestress in gear cutting.
2. The radial prestress loading experiment validated the equivalent model. The measured strain and common normal length changes were consistent with theoretical and simulation results.
3. Applying radial prestress reduced surface roughness and increased the absolute compressive residual stress. The grinding force changed only slightly. These effects are beneficial for gear cutting because they improve fatigue life and surface integrity.
4. The response surface models showed that prestress, grinding depth, and wheel speed interact in complex ways. The optimal parameters were a prestress of 172.545 MPa, a grinding depth of 50 μm, and a wheel speed of 32.631 m/s. Under these conditions, roughness improved by 12.2%, residual stress improved by 52.6%, and grinding force improved by 19.8%.
5. Radial prestress grinding is a practical method for improving the surface quality of gears. It can be integrated into gear cutting processes without causing a large increase in grinding force. Further research with full-wheel models and multi-axial loading will help to transfer this method to industrial production.