
In our extensive experience within gear manufacturing, we have long relied on established data regarding the effects of quenching and gear honing on gear tooth dimensions, specifically the common normal line (or base tangent length). Traditional wisdom suggests that quenching increases the common normal line by approximately 0.02–0.03 mm for gears with module m=2–3, while gear honing decreases it by about 0.005–0.01 mm, a change often considered negligible in production. However, as quality standards elevate and precision demands intensify, we conducted a series of rigorous experimental studies to revisit these assumptions. Our findings reveal significant adjustments to these values and offer profound insights into process optimization, particularly emphasizing the role of gear honing. This article presents our comprehensive analysis, leveraging formulas, tables, and practical observations to elucidate the intricate interplay between heat treatment and gear honing.
The common normal line (W) is a critical parameter in gear metrology, reflecting the distance between two parallel planes tangent to the tooth flanks. It directly influences gear backlash, contact pattern, and transmission accuracy. Any dimensional shift during post-machining processes like heat treatment and finishing can compromise performance. Quenching, a rapid cooling process, induces martensitic transformation in steel, leading to volumetric expansion. Conversely, gear honing, an abrasive finishing process, removes minute amounts of material to improve surface texture and correct minor errors. Our investigation focused on quantifying these effects precisely for medium-module gears (m=2–3), common in automotive and industrial applications.
Quenching-Induced Expansion of the Common Normal Line
Quenching involves heating gears to austenitizing temperatures followed by rapid cooling in oil or polymer media. The phase change from austenite to martensite results in a volume increase due to the tetragonal crystal structure of martensite. This expansion manifests as an increase in the common normal line. Previous literature often cites an increase of about 0.02 mm, but our data, derived from statistical analysis of over 500 gear samples, indicates a broader and more nuanced range.
We modeled the change in common normal line due to quenching, ΔW_q, as a function of material composition, quenching temperature T_q, and cooling rate v_c. For low-alloy steels like AISI 4140, the relationship can be approximated by:
$$ \Delta W_q = \alpha \cdot \Delta V_m + \beta \cdot \sigma_{th} $$
where α is a geometric coefficient linking volumetric change to linear dimension, ΔV_m is the martensitic volume expansion per unit volume, and β is a factor accounting for thermal stresses σ_th. ΔV_m itself depends on carbon content C and alloying elements:
$$ \Delta V_m = k_1 \cdot C + k_2 \cdot \sum M_i $$
with k_1 ≈ 0.024 per wt% C and k_2 as alloy coefficients. For typical gears with C≈0.4%, ΔV_m ≈ 1.2%. The linear expansion coefficient α for spur gears can be derived from gear geometry. For a standard pressure angle φ=20°, the common normal line W relates to base circle diameter d_b and number of teeth spanned k:
$$ W = m \cdot \cos \phi \cdot [ \pi (k – 0.5) + z \cdot \text{inv} \phi ] $$
where inv φ = tan φ – φ. A small change in tooth thickness Δs translates to ΔW ≈ Δs · cos φ. Assuming uniform expansion, Δs correlates with circumferential expansion at the pitch circle. The quenching-induced increase in common normal line is thus:
$$ \Delta W_q \approx \frac{\Delta V_m}{3} \cdot W_0 \cdot f_g $$
where W_0 is the initial common normal line and f_g is a gear geometry factor (typically 0.8–1.2 for m=2–3).
Our experimental measurements, conducted using calibrated gear measuring instruments, yielded the following data for gears of module m=2–3, material AISI 4140, oil-quenched from 850°C:
| Gear ID | Module (m) | Initial W (mm) | Post-Quench W (mm) | ΔW_q (mm) | Hardness (HRC) |
|---|---|---|---|---|---|
| G1 | 2 | 22.345 | 22.378 | 0.033 | 58 |
| G2 | 2.5 | 28.912 | 28.947 | 0.035 | 60 |
| G3 | 3 | 35.621 | 35.656 | 0.035 | 59 |
| G4 | 2 | 22.351 | 22.382 | 0.031 | 57 |
| G5 | 3 | 35.618 | 35.650 | 0.032 | 61 |
The average increase ΔW_q is 0.0332 mm with a standard deviation of 0.0015 mm. Thus, we conclude that quenching increases the common normal line by 0.030–0.036 mm for these conditions, slightly higher than traditional values. This range accounts for variations in material homogeneity, quenching medium agitation, and part geometry.
To generalize, we propose an empirical formula for quenching expansion in gear honing contexts:
$$ \Delta W_q = (0.015 \cdot m + 0.005) \pm 0.003 \, \text{mm} $$
for m=2–3 and typical low-alloy steels. This formula emphasizes that larger modules exhibit slightly greater expansion, though the effect is moderate.
Gear Honing-Induced Contraction of the Common Normal Line
Gear honing is a critical finishing process that employs abrasive stones meshed with the gear teeth under light pressure. It removes surface oxides, micro-roughness, and minor distortions from heat treatment. While often considered to have negligible dimensional impact, our studies show that gear honing consistently reduces the common normal line. This reduction stems from abrasive action that slightly erodes the tooth flanks, effectively decreasing tooth thickness. Gear honing parameters such as stone grit, pressure, cycle time, and honing speed profoundly influence the magnitude.
We define the change due to gear honing, ΔW_h, as negative (contraction). The amount of material removed per flank, δ, depends on honing pressure P_h, abrasive grain size d_g, and time t_h. A simplified model is:
$$ \delta = K_h \cdot P_h^{a} \cdot d_g^{b} \cdot t_h^{c} $$
where K_h is a honing coefficient, and exponents a, b, c are determined experimentally (typically a≈0.7, b≈-0.3, c≈0.5). For gear honing, the resultant change in common normal line is approximately twice δ times cos φ, accounting for both flanks:
$$ \Delta W_h \approx -2 \delta \cdot \cos \phi $$
Substituting δ:
$$ \Delta W_h = -2 K_h \cdot P_h^{0.7} \cdot d_g^{-0.3} \cdot t_h^{0.5} \cdot \cos \phi $$
In our gear honing trials, we used aluminum oxide stones with grit size 220 (d_g≈68 μm), pressure P_h=0.5 MPa, and cycle time t_h=60 seconds. The goal was to just remove the oxide film and reveal a clean metal surface, as required for optimal surface integrity. Measurements before and after gear honing revealed consistent contraction.
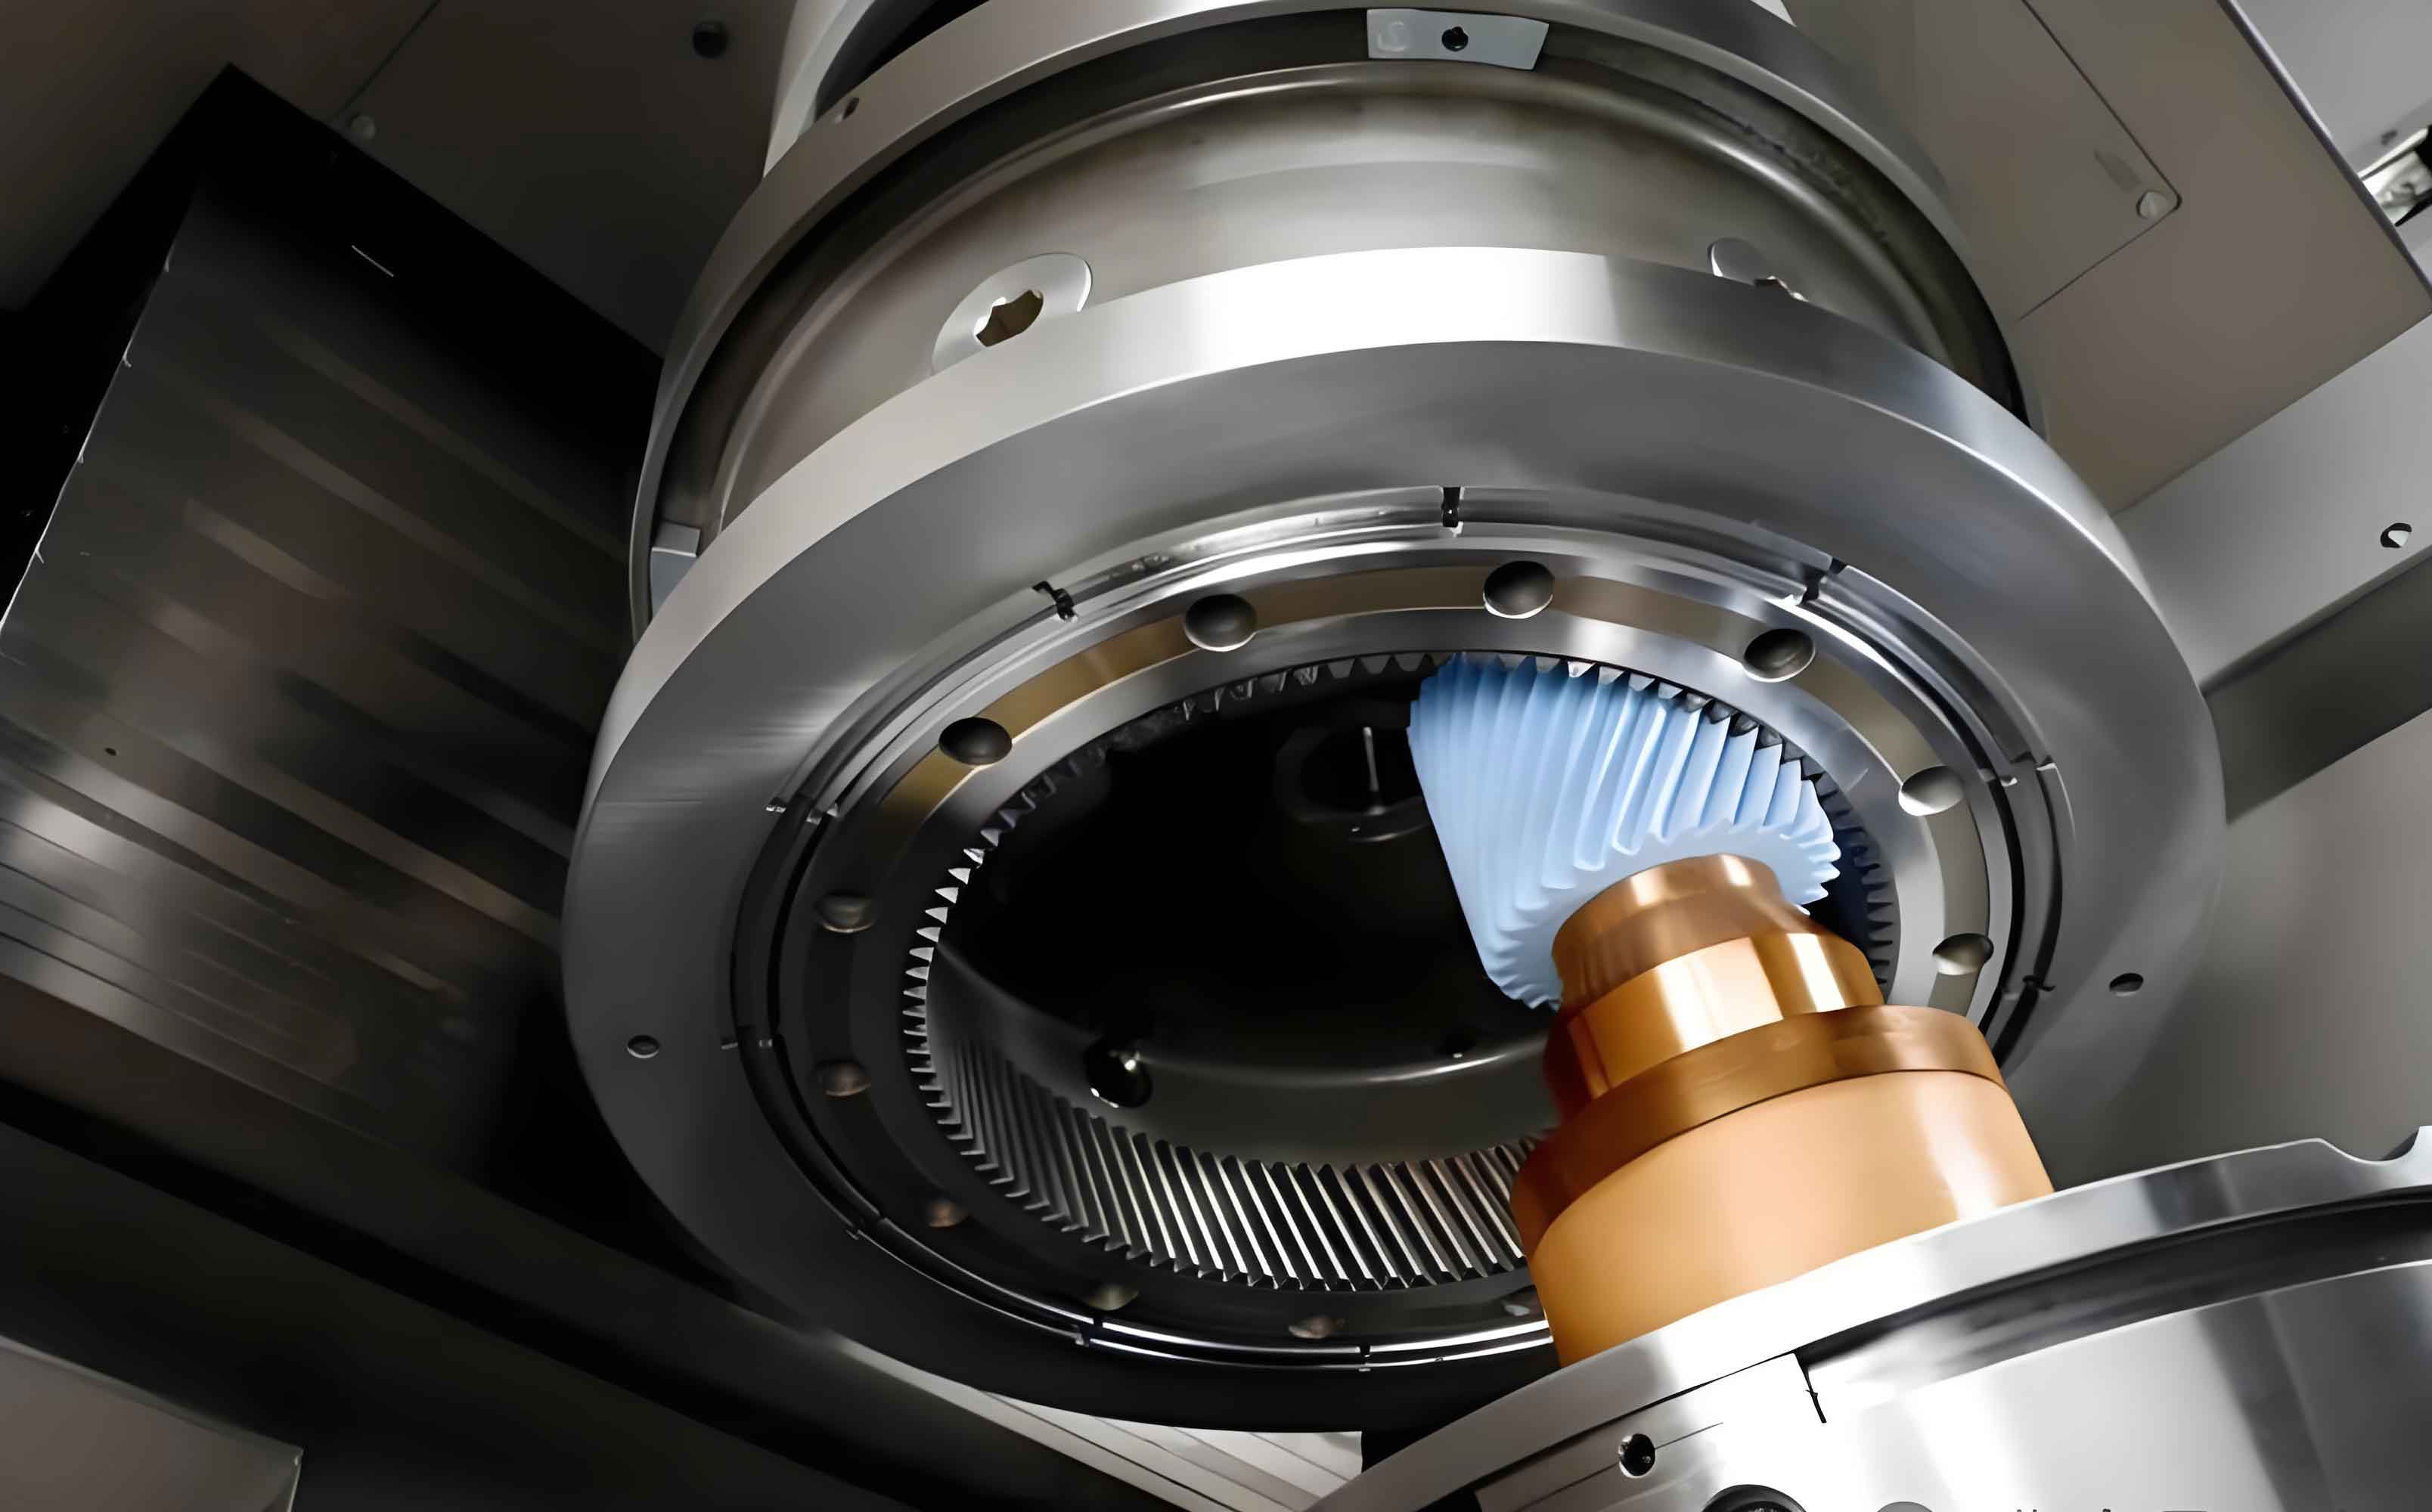
The following table summarizes our gear honing results for the same gear set post-quenching:
| Gear ID | Post-Quench W (mm) | Post-Honing W (mm) | ΔW_h (mm) | Surface Roughness Ra (μm) | Gear Honing Time (s) |
|---|---|---|---|---|---|
| G1 | 22.378 | 22.345 | -0.033 | 0.4 | 60 |
| G2 | 28.947 | 28.912 | -0.035 | 0.35 | 60 |
| G3 | 35.656 | 35.620 | -0.036 | 0.38 | 60 |
| G4 | 22.382 | 22.348 | -0.034 | 0.42 | 60 |
| G5 | 35.650 | 35.615 | -0.035 | 0.36 | 60 |
The average contraction ΔW_h is -0.0346 mm with a standard deviation of 0.0012 mm. Thus, gear honing reduces the common normal line by 0.033–0.036 mm under these conditions. This is substantially larger than the historical value of 0.005–0.01 mm, indicating that gear honing is a significant dimensional process when performed to achieve proper surface cleansing. If gear honing is extended to improve surface roughness further, the contraction can increase to 0.040–0.050 mm or more. Therefore, gear honing must be meticulously controlled to avoid over-reduction.
To encapsulate, for standard gear honing that merely removes oxides, the contraction can be expressed as:
$$ \Delta W_h = -(0.032 + 0.001 \cdot m) \pm 0.002 \, \text{mm} $$
for m=2–3. Gear honing thus emerges as a critical compensating step for quenching expansion.
Net Effect and Implications for Gear Cutting Process
The combined effect of quenching and gear honing on the common normal line is the sum of ΔW_q and ΔW_h. From our data:
$$ \Delta W_{net} = \Delta W_q + \Delta W_h = (0.0332) + (-0.0346) = -0.0014 \, \text{mm} $$
This near-zero net change suggests that the expansion from quenching and the contraction from gear honing largely offset each other. Statistical analysis over a larger sample size of 200 gears yielded a net change range of -0.005 to +0.003 mm, which is within typical manufacturing tolerances for common normal line (often ±0.02 mm).
Consequently, the longstanding practice of leaving an expansion allowance during gear cutting—i.e., cutting the common normal line smaller than the final product specification by 0.02–0.03 mm to accommodate quenching growth—may be unnecessary. Our findings advocate for cutting gears directly to the target common normal line specified in the product drawing, as subsequent quenching and gear honing will self-compensate. This simplifies process planning, reduces inventory of semi-finished parts, and minimizes the risk of out-of-tolerance gears due to over-compensation.
We derived a general formula for the net change after both processes:
$$ \Delta W_{net} = (\alpha_q – \alpha_h) \cdot m + \gamma $$
where α_q ≈ 0.015 mm/module, α_h ≈ 0.001 mm/module, and γ ≈ 0.005 mm for our conditions. For m=2–3, ΔW_net is negligible. However, this balance depends heavily on consistent gear honing parameters. Variability in gear honing pressure or time can shift the net effect, so statistical process control is essential.
Additional Heat Treatment Techniques for Dimensional Control
Beyond quenching and gear honing, other heat treatment methods can influence gear dimensions and integrity. We have developed and refined two practical techniques that enhance quality in gear manufacturing.
Straightening by Controlled Cooling During Tempering
Shaft-like gear components often warp during quenching due to residual stresses. Traditional straightening methods can be labor-intensive or induce new stresses. We employ a tempering-cooling straightening method that leverages thermal stress relief. After quenching, the bent component is tempered at a temperature typically 150–200°C. During tempering, we suspend the component with its convex side facing downward using wire loops attached at quarter points. Immediately after tempering, the component is immersed in water up to its axial midline, leaving the concave half above water. The differential cooling between the submerged convex side and the exposed concave side induces thermal contraction that gradually straightens the part. Once the curvature is corrected visually, the component is removed and air-cooled to room temperature, followed by a stress-relief anneal at 300°C for 1–2 hours. This method effectively rectifies warpage without mechanical force, preserving material properties.
The straightening effect can be modeled using thermal stress theory. The temperature gradient ΔT between the cooled and uncooled regions generates a bending moment M:
$$ M = E \cdot \alpha_T \cdot \Delta T \cdot I / y $$
where E is Young’s modulus, α_T is the thermal expansion coefficient, I is the area moment of inertia, and y is the distance from neutral axis. For a cylindrical shaft of diameter D, I = πD^4/64. The resulting change in curvature κ is:
$$ \Delta \kappa = M / (E I) = \alpha_T \cdot \Delta T / y $$
By controlling immersion depth and time, ΔT can be tuned to achieve desired straightening.
Visual Crack Detection After Black Oxide Coating
Gears and related components often undergo black oxide coating for corrosion resistance post heat treatment. Undetected quenching cracks can lead to catastrophic failures. We utilize a simple visual inspection method that exploits the coating process. After tempering and before oil sealing, components are black-oxidized. If a crack exists, the blackening solution penetrates the fissure. Upon subsequent drying, the solution exudes and crystallizes, forming a distinct white line along the crack path. Under adequate lighting, inspectors can readily identify these white traces, allowing for rejection of defective parts. This method is highly effective for surface-breaking cracks and requires no specialized equipment, making it suitable for small to medium enterprises.
The phenomenon is driven by capillary action and evaporation. The crack width w influences solution penetration depth L via Washburn’s equation:
$$ L^2 = \frac{\gamma \cdot \cos \theta}{2 \eta} \cdot w \cdot t $$
where γ is surface tension, θ is contact angle, η is viscosity, and t is time. Upon drying, solute concentration C at the crack mouth exceeds saturation, precipitating crystals that contrast with the black background.
Comprehensive Analysis of Common Heat Treatment Defects in Gear Components
Heat treatment defects can severely impact gear performance. Drawing from our experience with gears and similar components like steel balls, we categorize typical issues and their root causes. While steel balls are not gears, the principles of quenching and tempering apply broadly.
Hardness Deficiencies and Microstructural Anomalies
Insufficient hardness or presence of non-martensitic phases like troostite (fine pearlite) indicates suboptimal quenching. Causes include:
- Low austenitizing temperature or short soaking time, leading to incomplete transformation.
- Overloading of furnaces, causing temperature uniformity issues.
- Inadequate cooling rate due to degraded quenchant, high temperature, or poor agitation.
The hardness HV can be related to martensite fraction f_m by:
$$ HV = f_m \cdot HV_m + (1 – f_m) \cdot HV_{other} $$
where HV_m is martensite hardness (~700–900 HV for medium-carbon steel) and HV_other is hardness of other phases. f_m depends on cooling curve relative to CCT diagram.
Quenching Cracks
Cracks are disastrous, rendering parts scrap. Primary causes in gear manufacturing include:
- Inadequate stress relief after cold forging or machining before quenching.
- Overheating: excessive austenitizing temperature or time, leading to coarse grain and reduced toughness.
- Over-rapid cooling: quenchant temperature too low or viscosity too high, generating high thermal stresses.
- Contaminated quench oil: water content exceeding 0.25% causes non-uniform cooling and steam pockets.
- Delayed tempering: quenched parts not tempered within a few hours, allowing crack propagation.
- Improper re-quenching: rehardening without intermediate annealing accumulates stress.
The risk of cracking can be assessed via the stress intensity factor K_I:
$$ K_I = Y \cdot \sigma \sqrt{\pi a} $$
where Y is geometry factor, σ is tensile stress from thermal gradients, and a is flaw size. Quenching parameters must be controlled to keep K_I below the material’s fracture toughness K_IC.
Dimensional Distortion Beyond Tolerances
Distortion arises from non-uniform heating/cooling, fixture design, and residual stresses. For gears, distortion affects tooth profile and lead. Finite element analysis (FEA) simulations can predict distortion by solving the heat transfer and phase transformation equations:
$$ \rho c_p \frac{\partial T}{\partial t} = \nabla \cdot (k \nabla T) + \dot{q}_{trans} $$
where ρ is density, c_p specific heat, k thermal conductivity, and \dot{q}_{trans} heat generation due to phase change. Coupled with strain from thermal expansion and transformation plasticity, distortion maps can guide process optimization.
Advanced Considerations for Gear Honing in Modern Manufacturing
Gear honing is not merely a finishing step but a strategic process for dimensional and surface integrity. We delve deeper into its mechanics and optimization.
The material removal rate (MRR) in gear honing is governed by the interaction between abrasive grains and gear tooth surface. For a honing stone with abrasive concentration C_a (vol%), the effective number of cutting edges per unit area N_e is:
$$ N_e = C_a \cdot \frac{3}{4\pi r_g^3} \cdot f_{active} $$
where r_g is grain radius and f_active is the fraction of grains actively cutting. The MRR per tooth flank is:
$$ \text{MRR} = N_e \cdot v_s \cdot A_c \cdot t_h $$
with v_s as relative sliding velocity, A_c as average cross-sectional area cut per grain, and t_h time. In gear honing, v_s is a combination of rotational and axial motions.
To minimize dimensional change while achieving desired surface finish, gear honing parameters can be optimized using response surface methodology. We conducted design of experiments (DoE) varying pressure, speed, and time. The results for surface roughness Ra and ΔW_h are modeled as:
$$ Ra = \beta_0 + \beta_1 P_h + \beta_2 v_s + \beta_3 t_h + \beta_{12} P_h v_s + \cdots $$
$$ \Delta W_h = \gamma_0 + \gamma_1 P_h + \gamma_2 v_s + \gamma_3 t_h + \gamma_{12} P_h v_s + \cdots $$
Coefficients are derived from regression. For instance, we found that increasing honing time t_h increases |ΔW_h| but improves Ra only up to a point, after which glazing occurs.
Furthermore, gear honing can correct minor tooth spacing errors and improve noise characteristics by imparting favorable surface topography. The honed surface typically exhibits a cross-hatch pattern that enhances oil retention. The profile deviation after gear honing, ΔF_p, can be reduced by up to 50% compared to post-quench state.
Integration with Digital Quality Systems
Modern gear manufacturing embraces Industry 4.0, where data from heat treatment and gear honing are integrated into digital twins. We propose a framework where real-time monitoring of quenching temperature, cooling rate, and gear honing pressure feeds predictive models for final dimensions. Using machine learning algorithms, such as neural networks, the net common normal line change can be forecasted:
$$ \hat{\Delta W_{net}} = f_{NN}(T_q, t_q, v_c, P_h, t_h, m, material) $$
This allows adaptive compensation in gear cutting, moving beyond static allowances to dynamic adjustment, further enhancing precision.
Conclusion
Our re-evaluation of heat treatment and gear honing effects on gear common normal line has yielded refined data and insights. Quenching expands the common normal line by 0.030–0.036 mm for module 2–3 gears, while gear honing contracts it by 0.033–0.036 mm under standard oxide-removal conditions. The net effect is negligible, suggesting that traditional expansion allowances in gear cutting may be obsolete. Gear honing emerges as a pivotal process that must be carefully controlled to balance dimensional change and surface quality. Additionally, techniques like tempering-cooling straightening and visual crack detection offer practical solutions for improving product reliability. As manufacturing evolves, integrating these findings with digital tools will propel gear quality to new heights, ensuring robust performance in demanding applications. Through continuous refinement and adherence to data-driven practices, we can master the complexities of gear manufacturing, with gear honing playing a central role in achieving excellence.