
0 Introduction
Arc bevel gears have the advantages of high overlap, strong bearing capacity, low vibration, low noise and high tooth strength, and are widely used in the aviation and vehicle industry for staggered shaft movement and power transmission. However, in the process of bevel gear transmission, due to the influence of internal and external excitation, abnormal vibration may be generated, resulting in amplitude overrun or even serious failure. Therefore, the vibration mechanism of the spiral bevel gear system was studied The cause of vibration is very necessary. Therefore, it is necessary to effectively model the arc bevel gear test piece and analyze its modal characteristics, so as to further reduce and isolate the vibration by adjusting the structure. In this paper, a set of method-level modal analysis of bevel gear system is proposed, taking the arc bevel gearbox of an aero engine as the research object. At present, the modal analysis research of gear systems is mainly focused on: Spur gears and helical gears, there is little literature on modal analysis of bevel gears. The bevel gear was first designed by Gleason in the United States, and through the research of Litvin et al., the simulation analysis has undergone tooth contact analysis (Tooth Contact Analysis, TCA)(Loaded Tooth Contact Analysis, LTCA), which is of great significance for shortening the production cycle, reducing the cost of testing, and designing high-quality gear products. In the existing literature, the main analysis of the bevel gear mode is as follows: based on the resonance theory, Li Fu carried out the modal and resonance analysis of the driven gear of the high-speed and heavy-duty arc bevel gear; Xiong Renyan analyzed the modality of a certain arc bevel gear, obtained the natural frequencies and mode shapes of each order of the gear, and verified that there is no resonance in the high-speed gear system. Carmignani et al. used numerical simulations MethodsThe traveling wave vibration characteristics of bevel gears were studied, and the natural frequencies and modes of bevel gears were obtained through modal analysis. Based on the Abaqus simulation, Wang Dayong simulated the normal meshing state of the gear, and analyzed the problem of traveling wave resonance of the gear. But on The literature either only analyzes the mode of a single arc bevel gear, or connects the meshing of gear pairs in a binding way, or the tooth surface based on theoretical simulation has a large gap with the actual tooth surface, and the calculation results are quite different from the real situation of the test. In this paper, a set of methods for the system-level modal analysis of bevel gears is proposed, which mainly includes four aspects: (1) Based on the design parameters and processing parameters, the three-dimensional model of the arc bevel gear pair with accurate tooth surface is obtained. (2) Perform static analysis of the gear system to determine the normal contact of the gear pair; The prestress modal analysis was carried out to obtain the modal of the gear system. (3) Compare with the test results to judge the accuracy and effectiveness of the calculation method.
(4) Analyze the influence of different contact surfaces and different loads on the system mode.
1 Accurate modeling of spiral bevel gears
Fig. 1 shows the structure of a test piece of an aero engine arc bevel gearbox, including 1 pair of arc bevel gear pairs, 2 gear shafts and 4 bearings. In order to better obtain the modal characteristics of the gear pair and facilitate comparison with the test,In the modeling, only the full 3D finite element modeling of the gear pair and gear shaft is modeled, and the supporting role of the casing and bearing is replaced by a stiffness matrix.

Fig.1. Schematic diagram of the structure of the test piece
1.1 Acquisition of tooth surface points
Unlike spur gears, the formation of the tooth flanks of bevel gears is the result of a combination of design and machining parameters. When modeling bevel gear flanks, accurate flank point information is required. The tooth surface point is mainly obtained by two ways: obtained by machining parameter simulation, or the tooth surface point is collected by a coordinate measuring instrument. Regardless of the machining error, the flank point information obtained by these two methods is consistent. In this paper, the machining parameters are simulated by using the method of based on the gear design parameters and adding After completing the macroscopic parameter modeling, enter the machining parameters shown in the manufacturing module of arc bevel gears (refer to the software tutorial “Masta Training Manual – Manufacture and LTCA of Arc Bevel Gears and Hypoid Gears”), establish the accurate tooth surface, and output 7×9 tooth surface point information. Fig. 2 shows a schematic diagram of the machining parameters of the large wheel in Masta and the flank point information of 1×9. According to the modeling needs, the tooth surface point set and the tooth root point set were established.

Fig.2. Tooth surface information
1.2 3D modeling of gear pairs
After obtaining the tooth surface point information, import Catia for three-dimensional finite element modeling, and the specific modeling process is as follows: import the tooth surface point parameters, establish the spline curve, create the mesh surface, establish the tooth blank, and carry out the operation of segmentation array, etc., to obtain a gear model with accurate tooth surface, as shown in Figure 3.
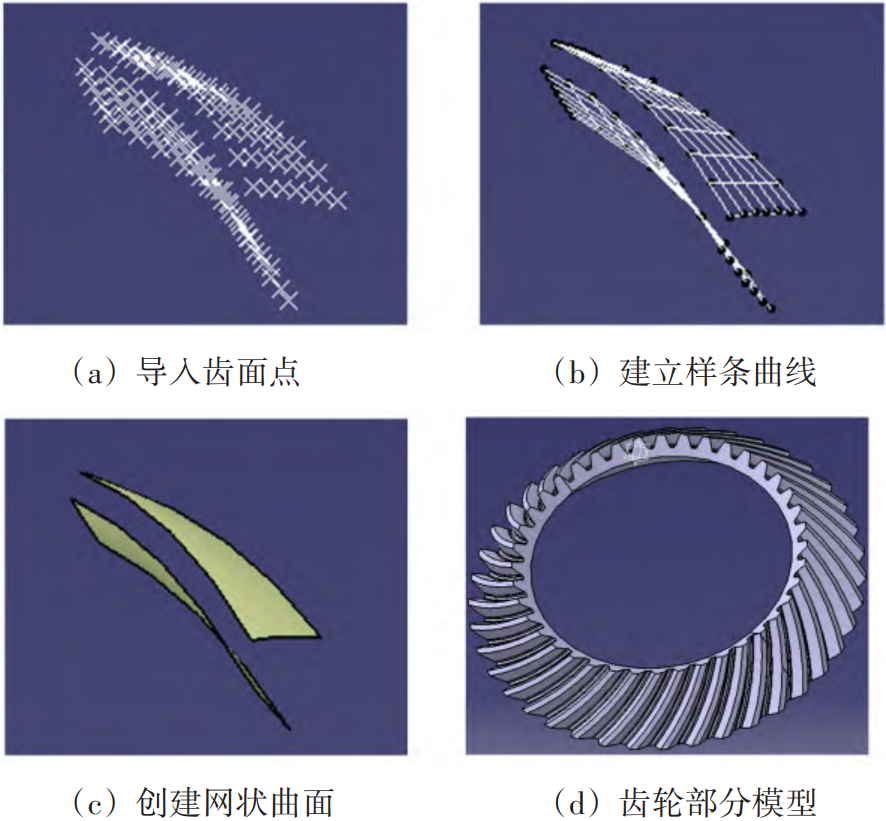
Fig.3. Accurate tooth surface modeling process
A complete gear shaft model was established and assembled to obtain a complete gear pair analysis model, as shown in Figure 4. Of these, all gear shaft materials are 9310 steel with an elastic modulus of 204 GPa and a density of7850 kg/m3 with a Poisson’s ratio of 0. 293。
1.3 3D modeling of gear system
After the modeling of the gear pair is completed, a stiffness support needs to be introduced to the bearing support surface, as shown in Figure 5. Among them, it is difficult to be completely consistent with the actual support stiffness, but it can be guaranteed to be consistent by orders of magnitude. for
Compared with the test, the stiffness of the tooling is used to calculate the simulation and the friction contact is set on the contact surface of the gear pair, and the friction factor is 0. 1。
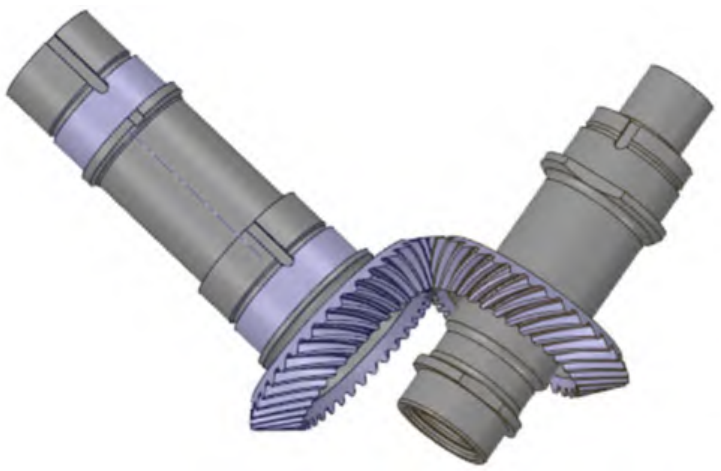
Fig.4. Gear pair model

Fig.5. Gear system model
2 Modal analysis
Nonlinear factors such as frictional contact cannot be considered in modal analysis, and the constraint method of binding is quite different from the actual gear tooth coupling form. Therefore, in this paper, the calculation of the prestress mode is adopted, that is, it is carried out first Static strength analysis, followed by prestress mode calculation of the gear system.
2.1 Static strength analysis
In order to facilitate the comparison with the test, the concave surface of the large wheel was driven by the convex surface of the small wheel, a torque of 100 N·m was applied to the driving wheel, and the driven wheel was restrained to rotate, and the contact of the gear pair was analyzed. The calculated contact impressions and stress contours of the gear pair are shown in Fig. 6 and Fig. 7, respectively. As can be seen from Fig. 6 and Fig. 7, the contact of the gear pair is normal, there are two pairs of teeth involved in the contact, and the maximum stress value is 275. 14 MPa。
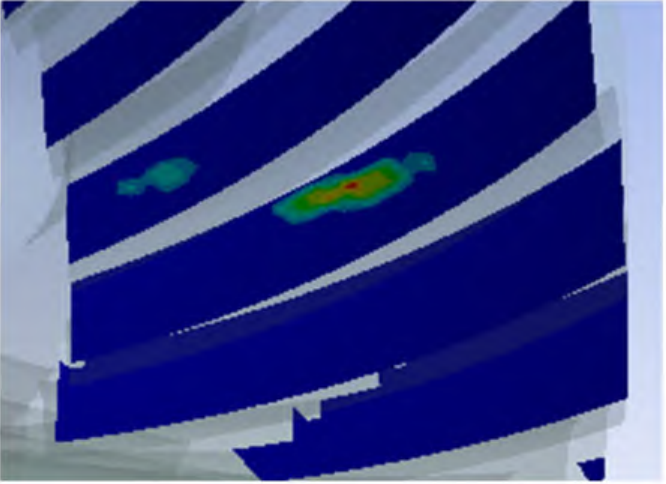
Fig.6. Contact impressions
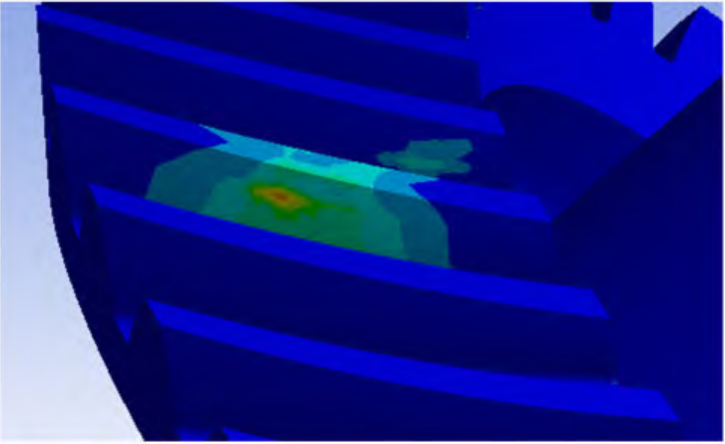
Fig.7. Stress contour diagram
2.2 Prestressed modes
Based on the static intensity calculation results as the initial conditions, the mode of the system within 22 kHz can be calculated. Different from the results of the modal analysis of a single gear shaft, the results of the prestress mode analysis show that the vibration modes of the pitch type are increased, and the vibration modes of the one to four pitch diameters correspond to multiple mode frequencies. Contacted
There are even special coupling mode shapes in the form of pitch-sized coupled umbrellas (order 12). The partial mode shape diagram is shown in section 4. 3 enumerations.
3 Experimental verification
3.1 Test arrangement
The test design fixture replaces the support of the casing and bearing, the stiffness value, and the test piece of the modal test are shown in Figure 8. A torque of 100 N·m was applied to the loading lever to ensure the gear pair engaged, and then the tooling and anti-rotation key were locked, and the loading lever was removed for modal testing, as shown in Figure 9. For the test, the LMS software was used to move the hammer method The process is shown in Figure 10 for testing, i.e., a single point to excite multiple point responses. The hammering point arrangement is shown in Figure 11, wherein, the 4, 7 hammering points of the driving wheel and the 3, 24 hammering points of the driven wheel are the pasting position of the sensor. During the test, the gear shaft is mainly concerned with the bending mode shape, and the hammering direction is set Radial; The gear tooth surface is mainly concerned with the mode shape of the pitch diameter, and the hammering direction is set to the axial direction, and the mode shape below the five node diameter is mainly concerned. Based on the test requirements and the operability of the hammering points, 10 hammering points are evenly arranged. The final geometry in the LMS is shown in Figure 12.

Fig.8. Specimens
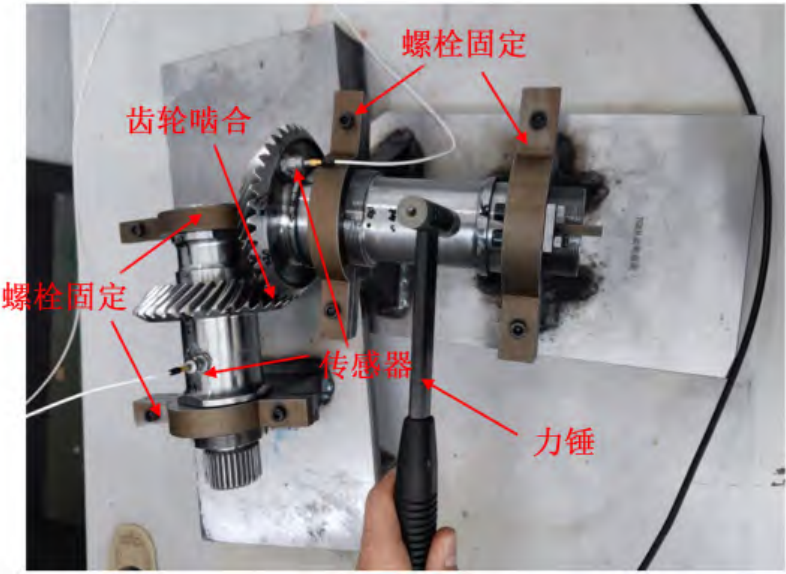
Fig.9 Modal test

Fig.10 Modal test process

Fig.11. Arrangement of hammering points
3.2 Trial data analysis
The method of curve fitting is used to extract the modal parameters, and the optimal estimation of natural frequency, damping and mode shape is obtained based on the least squares estimation. Table 5 shows the mode in which both the frequency damping and mode vector are stable.
The typical mode shape is in the 4th. 3 enumerations.
The Modal Assurance Criterion (MAC) was used to verify the correlation of the measured modes (Fig. 13). As can be seen from Figure 13, except for the diagonal, the MAC values are relatively small, that is, the correctness of the mode selection is high, and the test results are reliable.
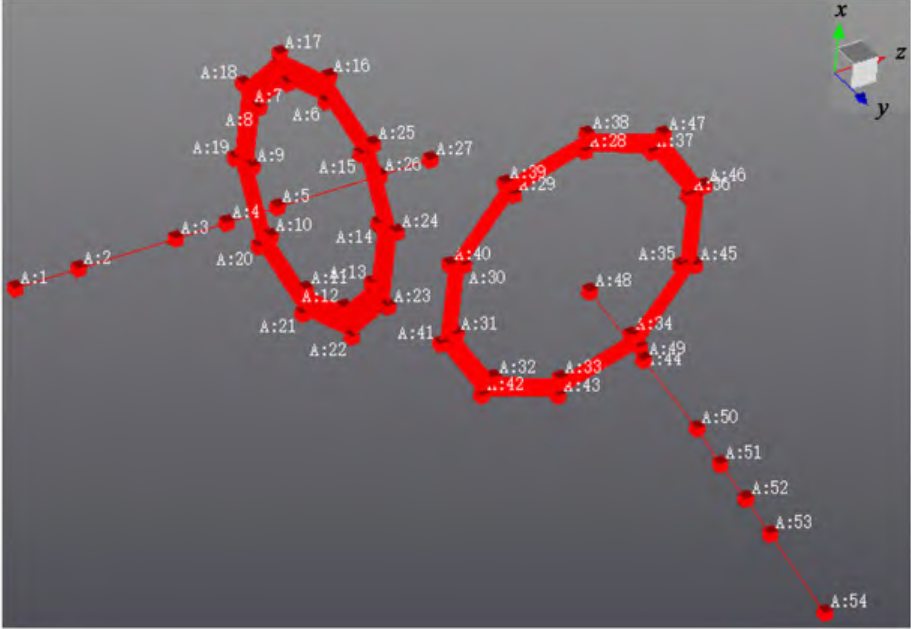
Fig.12. LMS geometry

Fig. 13 MAC matrix
3.3 Comparison of simulation and experiment
The simulation calculation results are combined with the test results
It is found that the simulation results are not one-to-one compared with the measured modes, and the reasons are: (1) there is the influence of fixtures during the test, which leads to the occurrence of mode shapes related to or coupled with fixtures; (2) Due to human factors or conditions, some modalities are not aroused. In this paper, the mode shapes of the gear pairs are compared, and the influence of fixtures on the bending mode shapes is ignored, and it can be seen that the simulation results are larger than the measured values, except for the radial mode shapes of the driving wheels. From the perspective of mode shapes, the coupling bending of the measured mode shapes of one section diameter is obvious, and the comparison with the simulation results is not strong. The other mode shapes are less affected by bending, and the error is less than 10. 08%, considering that the modal calculation margin in engineering is about 10%, the theoretical calculation results can be used for support tests.


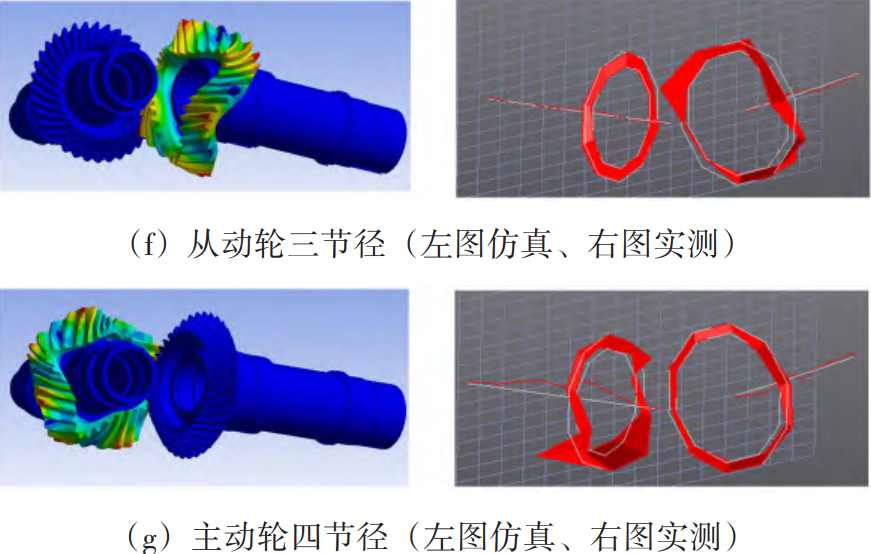
Fig.14. Measured mode shapes
4 Modal sensitivity analysis
In view of the fact that the concave and convex surfaces of aviation bevel gears are all working surfaces in engineering, and the load is not constant, therefore, it is necessary to analyze the influence of the contact surface and load on the mode to judge whether it is necessary to carry out multiple working conditions in the actual analysis Analyse.
4.1 Effect of different contact faces on the prestressed mode
Combined with group 1 and group 3, the modes of the gear system with different contact surfaces are analyzed, and after the contact surface is replaced, the system modes change, and most of the modes show the same mode shape, and the natural frequency error is not more than 3%, but some mode shapes are different There are changes. The enumerated mode shape diagram is shown in Figure 15, where a new mode shape (order 11) and a new form of coupled mode shape (order 7 and order 19) appear. Therefore, when simulating and predicting the test, it is necessary to perform the modalities separately for different contact surfaces.

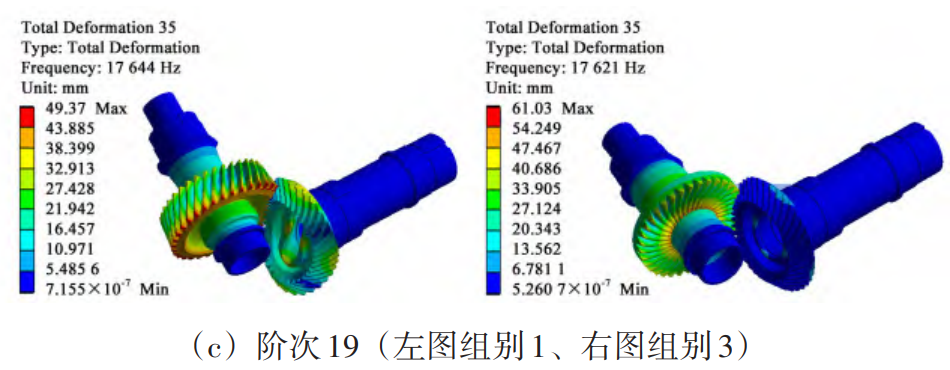
Fig.15. Mode shape diagram with different contact surfaces
4.2 Influence of different loads on the prestressed mode
Combined with Groups 2, 3 and 4, the modes of the gear system with different loads are analyzed, and the mode shape selection is basically the same as in Table 4. It can be seen that after changing the load, the change in the mode of the system is only reflected in the change of frequency, and the mode shape remains the same. The larger the load, the higher the natural frequency in the same mode shape, but the error value does not exceed 2. 5%。 Therefore, when the test is simulated and predicted, the influence of the load on the mode of the bevel gear system can be ignored within a certain load range.
5 Conclusion
(1) Taking the arc bevel gearbox of an aero engine as the research object, a three-dimensional model of the arc bevel gear pair with accurate tooth surface is obtained based on the design parameters and processing parameters, and a set of bevel gear system-level modal analysis is proposed
method.
(2) The simulation mode is compared with the test results, and the mode shape of the gear pair based on the pitch type and its coupling mode shape is less than 10. 08%, which verifies the accuracy and effectiveness of the calculation method.
(3) The results show that the bevel gear system mode has a strong sensitivity to the contact surface and a relatively weak sensitivity to the load. The reason for this is that different contact surfaces represent completely different meshing states and meshing stiffness values
There may be orders of magnitude differences, and the change of the load on the meshing state is only reflected in the magnitude of the force surface, and the effect on the meshing stiffness does not cross the order of magnitude. Therefore, the influence of the load can be ignored within a certain range, but the modal analysis of different contact tooth surfaces needs to be carried out separately.