
In my analysis of precision motion control systems, the rotary vector reducer stands out as a critical component, especially within industrial robotic joints. Its performance, particularly the minimization of kinematic backlash, is paramount for achieving high positional accuracy and repeatability. Backlash, defined as the lost motion occurring when the input shaft reverses direction before the output shaft follows, is a complex phenomenon. It can stem from various sources, including geometric errors from manufacturing and assembly, elastic deformations under load, and thermal expansions. Among these, geometric backlash, arising from inherent clearances and tolerances in the mechanism, is a primary focus during the design phase as it represents a fundamental, non-load-dependent source of error. This article details my comprehensive approach to modeling, analyzing, and optimizing the geometric backlash of a rotary vector reducer using principles of robust design.
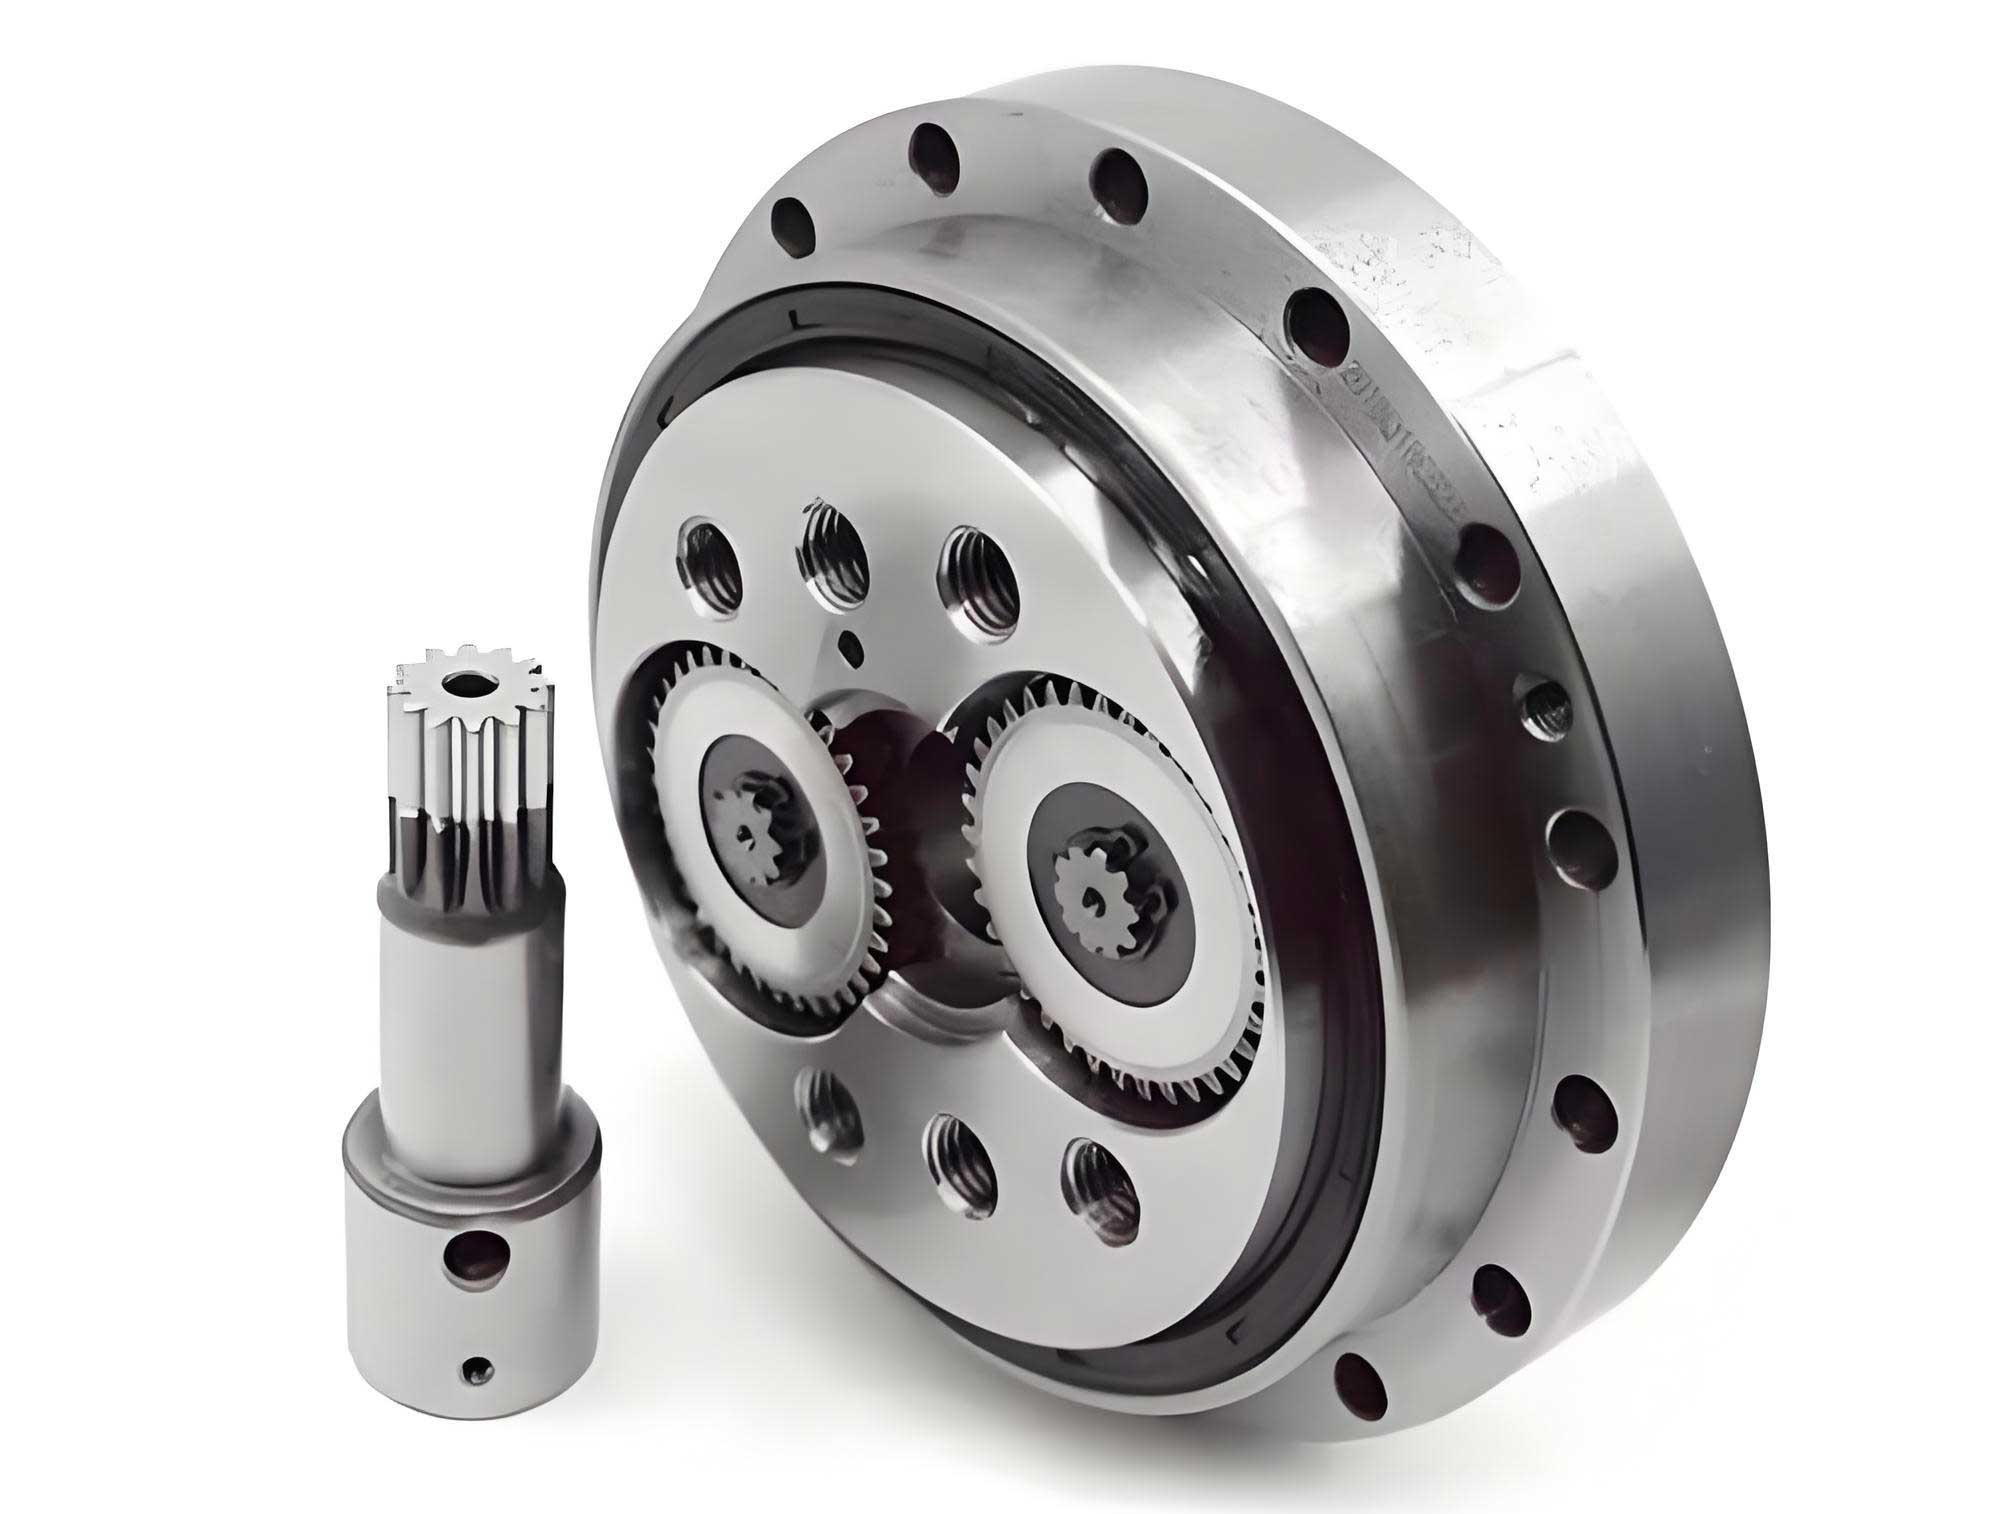
The rotary vector reducer is a two-stage speed reduction device. The first stage consists of a standard involute planetary gear train, while the second, core stage is a cycloidal-pinwheel mechanism. The output is derived from the crankshafts which have eccentric sections engaging with cycloid discs. This unique configuration provides the rotary vector reducer with high reduction ratios, compact size, high torsional stiffness, and excellent overload capacity. However, its complex structure also introduces multiple potential sources for backlash accumulation across both transmission stages. A systematic breakdown is essential.
Mathematical Modeling of Geometric Backlash
To quantitatively assess and ultimately minimize backlash, the first step I undertook was to develop a comprehensive mathematical model. This model synthesizes the individual contributions of various manufacturing and assembly errors from both the involute and cycloidal stages into a total geometric backlash value at the output. The following sections detail the key error sources and their mathematical representation.
Error Sources in the Involute Planetary Stage
The involute stage contributes to the overall rotary vector reducer backlash through errors in the sun-planet and planet-ring gear meshes. The primary factors considered are:
- Base Tangent Length (Public Normal Line) Deviation (Ew): This error in the gear teeth profile directly creates clearance between meshing teeth.
- Center Distance Error (ΔFa): Deviation from the nominal center distance between mating gears alters the theoretical meshing condition, creating or modifying backlash.
- Radial Runout Error of the Gear (ΔFt): This composite error, often related to gear eccentricity, causes a periodic variation in the center distance during rotation, leading to fluctuating backlash.
The combined effect of these errors on the angular backlash at the output of the rotary vector reducer can be expressed as a linear sum. The conversion from linear error at the gear mesh to angular error at the output considers the reduction ratio and base geometry. The contribution from the involute stage, when reflected to the output shaft, forms part of the overall sum.
Error Sources in the Cycloidal-Pinwheel Stage
The cycloidal stage is more complex and typically contributes more significantly to the total backlash of the rotary vector reducer. The key error parameters include:
- Profile Modification Errors: These are intentional but must be controlled. equidistant modification (Δrrp) changes the radius of the rolling circle for generating the cycloid profile, while shift modification (Δrp) offsets the center of this circle. Their nominal values are design choices, but manufacturing errors in these modifications (δΔrrp, δΔrp) are critical.
- Pin Geometry and Position Errors: Errors in the pin center radius (δrp), pin radius itself (δrtp), and the clearance between the pin and its housing hole (δJ) all directly affect the meshing clearance between the cycloid disc and the pinwheel.
- Cycloid Disc Errors: These include the radial runout of the cycloid disc (ΔFt1), the circumferential position error of its pin holes (δt), and the cumulative pitch error (ΔFp).
- Eccentricity and Bearing Errors: The error in the crankshaft eccentric distance (δd) and the clearance in the crankshaft bearing (Δu) introduce kinematic play directly into the motion transmission.
Each of these errors induces a specific angular displacement at the output. The mathematical relationship for each is derived from the kinematics of the cycloidal drive, considering the instantaneous center of rotation and the force transmission paths.
Total Geometric Backlash Formula
By superimposing the effects of all error sources from both stages, the total geometric backlash of the rotary vector reducer, expressed in arc-minutes, is given by the following comprehensive formula:
$$
\varphi = \frac{180 \times 60}{i \pi r_1} \sum_{k=1}^{4} J_{E_k} + \frac{180 \times 60}{\pi} \sum_{j=1}^{8} \varphi_j
$$
Where:
- $\varphi$ is the total geometric backlash (arc-min).
- $i$ is the total reduction ratio of the rotary vector reducer.
- $r_1$ is the pitch circle radius of the sun gear.
- $J_{E_k}$ represents the equivalent linear backlash contributions from the four main error factors in the involute stage.
- $\varphi_j$ represents the angular backlash contributions from the eight main error factors in the cycloidal stage.
To facilitate rapid calculation and analysis, I developed a dedicated software tool. This tool allows for the input of all basic rotary vector reducer parameters (e.g., tooth numbers, eccentricity, modification values) and the tolerance values for each error source, subsequently computing the individual and total backlash. The interface streamlines the sensitivity and optimization processes.
Sensitivity Analysis of Error Factors
With the mathematical model established, the next logical step in optimizing the rotary vector reducer was to determine which parameters exert the most influence on the total backlash $\varphi$. This is achieved through sensitivity analysis. The relative sensitivity $RS_i$ is used to compare the impact of different parameters, defined as $RS_i = S_i / S_0$, where $S_i$ is the absolute sensitivity (the partial derivative $\partial \varphi / \partial p_i$ for parameter $p_i$), and $S_0$ is a benchmark sensitivity, typically chosen as that of a highly influential parameter like the equidistant modification $\Delta r_{rp}$.
Using the parameters for a common RV-80E type rotary vector reducer as a basis, the calculated relative sensitivities for key error factors are summarized below:
| Error Factor | Symbol | Relative Sensitivity (RS) |
|---|---|---|
| Equidistant Modification | $\Delta r_{rp}$ | 1.00 (Benchmark) |
| Pin Radius Error | $\delta r_{tp}$ | -1.00 |
| Circumferential Position Error of Pin Holes | $\delta_t$ | ~0.73 |
| Shift Modification | $\Delta r_p$ | ~ -0.68 |
| Pin Center Radius Error | $\delta r_p$ | ~ 0.68 |
| Pin-Hole Clearance | $\delta J$ | 0.50 |
| Crankshaft Bearing Clearance | $\Delta u$ | -0.667 |
The analysis clearly identifies the equidistant modification ($\Delta r_{rp}$) and the pin radius error ($\delta r_{tp}$) as the most sensitive parameters, with their relative sensitivities at the maximum magnitude of 1.00. This indicates that a unit change in these parameters causes the most significant change in the total backlash of the rotary vector reducer. Factors like $\delta_t$, $\Delta r_p$, and $\delta r_p$ also show high sensitivity. This insight is crucial; it tells the designer that to control backlash effectively, tight tolerances must be enforced on these specific parameters during the manufacturing and assembly of the rotary vector reducer.
Robust Design Optimization via Orthogonal Experiment
Sensitivity analysis identifies critical parameters, but the goal is to find a set of nominal design parameter values that make the rotary vector reducer’s performance (low backlash) insensitive to the inevitable variations (noise) in manufacturing and environment. This is the essence of robust design. I employed the Taguchi method, utilizing orthogonal arrays to efficiently explore the design space.
Classification of Factors
The parameters were classified into two groups:
- Control Factors: These are design parameters whose nominal values can be chosen freely by the designer. For the rotary vector reducer, I selected four key ones: eccentricity ($e$), pin center radius ($r_p$), nominal equidistant modification ($\Delta r_{rp}$), and nominal shift modification ($\Delta r_p$).
- Noise Factors: These represent the uncontrollable variations—manufacturing tolerances, assembly clearances, and operational wear. All 13 error sources listed in the mathematical model (e.g., $E_w$, $\delta r_{tp}$, $\delta_t$, $\Delta u$, etc.) were treated as noise factors.
Orthogonal Array Experiment Design
To manage the experimental complexity, both control and noise factors were assigned three levels (Level 1, 2, 3). The levels for control factors were set around their typical nominal values, while levels for noise factors were set based on probable tolerance ranges (e.g., minimum, nominal, maximum expected error).
| Level | Eccentricity (e) | Pin Radius (rp) | Equidistant Mod. (Δrrp) | Shift Mod. (Δrp) |
|---|---|---|---|---|
| 1 | 2.198 | 114.975 | -0.054 | -0.054 |
| 2 | 2.200 | 115.000 | -0.050 | -0.050 |
| 3 | 2.202 | 115.025 | -0.046 | -0.046 |
A two-step orthogonal array setup was used:
- Inner Array (Control Array): An L9(3^4) array was used for the 4 control factors at 3 levels. This defines 9 distinct design configurations (Experiments 1 through 9).
- Outer Array (Noise Array): An L27(3^13) array was used for the 13 noise factors at 3 levels. This simulates 27 different possible combinations of manufacturing and assembly variations.
The full experiment thus consisted of running each of the 9 inner array designs against all 27 outer array noise conditions, resulting in 9 × 27 = 243 simulated observations. For each combination, the total backlash $\varphi$ was calculated using the developed mathematical model and software.
Signal-to-Noise Ratio and Optimization
For each of the 9 design configurations (rows in the inner array), the 27 corresponding backlash values (from the outer array) were analyzed. The objective was to minimize the backlash, which is a “smaller-the-better” characteristic. The Signal-to-Noise Ratio (SNR), as defined by Taguchi, was calculated for each design using the formula:
$$
SNR = -10 \log_{10}\left( \frac{1}{N} \sum_{i=1}^{N} y_i^2 \right)
$$
where $y_i$ are the 27 calculated backlash values for that design, and $N=27$. A higher SNR indicates greater robustness—that is, the design’s performance (low backlash) is less sensitive to the variations introduced by the noise factors.
After computing the SNR for all 9 designs, the one with the highest SNR was identified as the optimal robust design. In this analysis, the combination corresponding to Control Factors at levels (1, 1, 1, 1)—i.e., (e=2.198 mm, r_p=114.975 mm, Δr_rp=-0.054 mm, Δr_p=-0.054 mm)—yielded the maximum SNR of 11.4798.
Results and Analysis
The performance of this robustly optimized rotary vector reducer design was then evaluated. The mean backlash calculated across the 27 noise conditions for this optimal design was approximately 0.886 arc-minutes. For comparison, a design using typical nominal parameters (e=2.200, r_p=115.000, Δr_rp=-0.050, Δr_p=-0.050) resulted in a mean backlash of about 1.518 arc-minutes under the same noise conditions.
| Design Type | Control Factor Levels (e, rp, Δrrp, Δrp) | Mean Backlash (arc-min) | Signal-to-Noise Ratio (SNR) | Improvement |
|---|---|---|---|---|
| Conventional Nominal Design | (2, 2, 2, 2) | 1.518 | Lower | Baseline |
| Robust Optimal Design | (1, 1, 1, 1) | 0.886 | 11.4798 (Max) | ~41.6% Reduction |
This represents a 41.6% reduction in geometric backlash, demonstrating the significant effectiveness of the robust design approach for the rotary vector reducer.
It is instructive to note that if one performed a simple minimization of backlash considering only the nominal values (ignoring noise), a different parameter combination (3, 3, 2, 1) might be suggested. However, when evaluated under the noisy conditions, this combination showed a higher mean backlash (~1.159′) and a significantly lower SNR (7.224), confirming that it is a less robust solution than the one found through the Taguchi orthogonal experiment.
Furthermore, an Analysis of Variance (ANOVA) performed on the inner array results (using the mean performance measure) quantitatively reveals the contribution percentage of each control factor to the variation in the output performance.
| Control Factor | Contribution to Performance Variation |
|---|---|
| Equidistant Modification (Δrrp) | ~63.4% |
| Shift Modification (Δrp) | ~26.6% |
| Eccentricity (e) | ~6.5% |
| Pin Center Radius (rp) | ~3.5% |
This ANOVA table powerfully reinforces the findings of the initial sensitivity analysis. It shows that the two profile modification parameters together account for approximately 90% of the influence on the output backlash variation in this design-of-experiments context. This provides a clear directive for manufacturing: the highest priority for quality control should be placed on accurately achieving the specified equidistant and shift modification values on the cycloid discs of the rotary vector reducer. In contrast, the eccentricity and pin center radius, while still important, have a relatively smaller impact and their tolerances could potentially be relaxed slightly to reduce cost without severely compromising the robust low-backlash performance of the rotary vector reducer.
Conclusion
This detailed investigation into the geometric backlash of the rotary vector reducer establishes a systematic framework for its minimization. Beginning with a comprehensive mathematical model that incorporates critical manufacturing and assembly errors from both transmission stages, the analysis quantitatively links tolerances to system performance. The subsequent sensitivity analysis effectively pinpointed the equidistant modification and pin radius error as the most critical parameters affecting backlash in the rotary vector reducer.
The core of the optimization strategy employed the robust design philosophy using orthogonal experiments. By categorizing parameters into control and noise factors and employing a dual-array experimental setup, the method efficiently identified an optimal combination of nominal design parameters. This optimal configuration for the rotary vector reducer was not merely the one that minimized backlash in a perfect, noiseless world, but the one that ensured consistently low backlash (a mean of 0.886 arc-min) even in the presence of expected manufacturing variations, as evidenced by its maximized Signal-to-Noise Ratio. This resulted in a substantial 41.6% improvement over a conventional design approach.
The orthogonal experiment and subsequent ANOVA provided profound insight, confirming that the profile modification parameters dominate the performance variation. This work demonstrates that applying robust design techniques at the early design stage of a rotary vector reducer is a powerful methodology. It enables the development of a product that is not only high-performing but also reliable and manufacturable, as it is inherently less sensitive to production variances, ultimately enhancing the precision and durability of the robotic systems that depend on it.