
I have carried out a detailed study on how shot peening process parameters affect the surface morphology and residual stress of herringbone gears. Herringbone gears are widely used in high-speed and heavy-load transmission systems because they eliminate axial thrust while maintaining high load capacity. However, their complex tooth geometry, especially the narrow root region, makes surface integrity control particularly challenging. Shot peening is a cold working process in which a stream of spherical media impacts the target surface at high velocity, inducing plastic deformation, compressive residual stress, and changes in surface topography. For herringbone gears, the interaction between the shot stream and the curved tooth flanks, as well as the shadowing effect in the tooth root, leads to non-uniform impact conditions. These non-uniformities directly influence the resulting surface roughness and residual stress distribution. I have therefore developed a coupled discrete element method and finite element method (DEM-FEM) framework to predict these quantities and validated it against experiments.
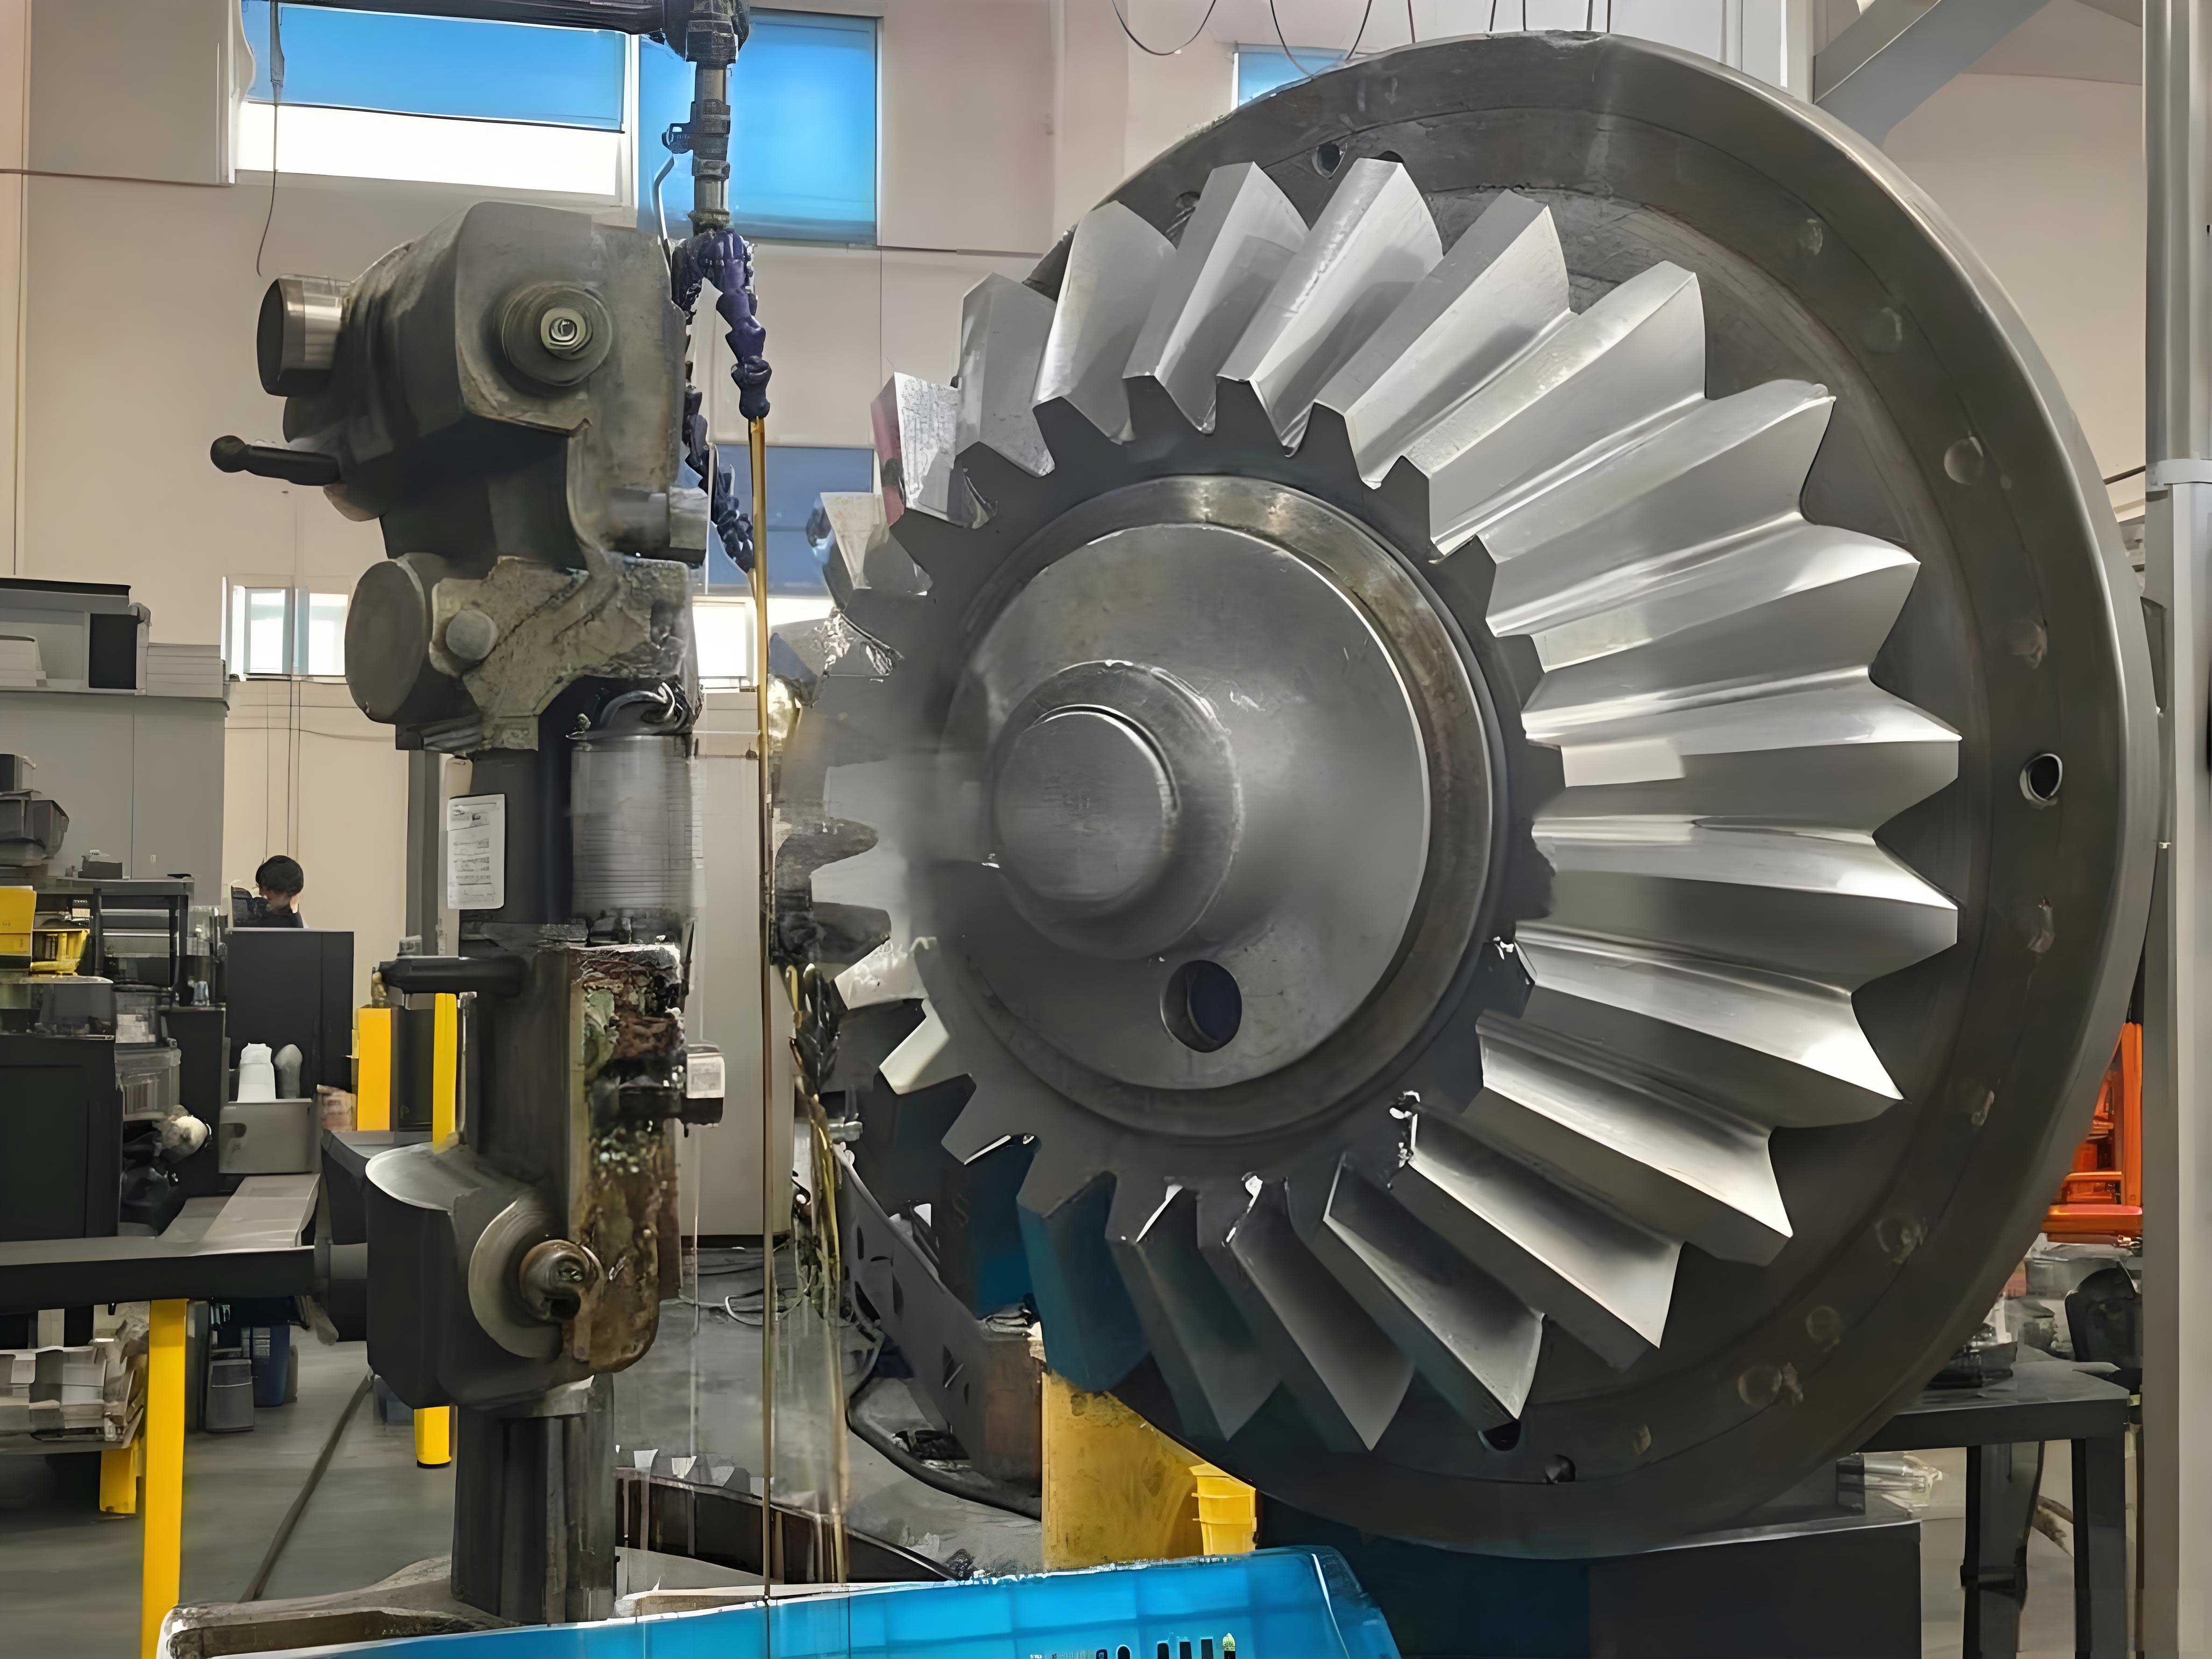
Although the present work focuses on herringbone gears, the methodology and findings are also relevant to miter gears, which share similar geometric complexity and require comparable surface integrity. Miter gears, like herringbone gears, are often subjected to severe contact and bending loads, and their performance can be significantly improved by shot peening. In the case of miter gears, the intersecting axes and the resulting tooth contact patterns create additional challenges for uniform peening. Therefore, the DEM-FEM approach I present here can be extended to miter gears with appropriate modifications to the geometric model and boundary conditions. The same is true for other complex gear types where shot peening is used to enhance fatigue life.
1. Introduction
Surface integrity plays a decisive role in the fatigue life, wear resistance, and load-carrying capacity of herringbone gears. Shot peening is one of the most effective and economical surface treatments for introducing compressive residual stress and refining near-surface microstructure. The process involves the impact of numerous small spherical shots onto the gear surface. Each impact creates a shallow plastic indentation, and the overlapping indentations produce a compressive residual stress field. The depth and magnitude of this stress field depend on shot velocity, shot diameter, shot hardness, shot material, coverage, and impact angle. For herringbone gears, the tooth flank is a complex surface, and the shot stream cannot always strike the surface normally. Moreover, the narrow tooth root region causes shot-to-shot collisions and multiple impacts, which alter the effective impact energy.
Current industrial practice relies on Almen strip experiments to determine shot peening intensity. However, these experiments are time-consuming and costly, especially when many parameter combinations must be evaluated. Furthermore, the Almen intensity does not directly provide the residual stress distribution in a herringbone gear. Numerical simulation offers an alternative, but most existing models assume a flat target and ignore shot-to-shot interactions. For herringbone gears, such simplifications are inadequate. I have therefore established a sequential DEM-FEM model that first simulates the shot stream and the collisions among shots, and then transfers the impact information to a finite element model of the tooth surface. This approach accounts for the actual gear geometry and the stochastic nature of the peening process.
I have also developed a shot peening intensity prediction model based on the Almen strip concept. This model allows me to compute the saturation curve and the resulting intensity for different process parameters without performing a full experimental campaign. The model is validated against Almen strip experiments, and the error is less than 10%. The predicted intensities are then used to interpret the residual stress and roughness results for herringbone gears. The main contributions of my work are: (1) a calibrated Johnson-Cook constitutive model for the gear steel, (2) a DEM-FEM coupled model that considers initial residual stress and initial surface roughness, (3) a fast shot peening intensity prediction method, and (4) a systematic study of how shot velocity, diameter, hardness, and type affect the surface integrity of herringbone gears. The findings also provide guidance for miter gears and other complex transmission components.
2. Material Constitutive Model
The accuracy of the finite element simulation depends strongly on the material constitutive model. The gear material is a high-strength heat-resistant steel, designated as 10CrNi2Mo3Cu2V, which corresponds to AMS 6308. Its chemical composition is given in Table 1. The material exhibits significant strain-rate sensitivity and temperature softening, which must be captured to predict the residual stress correctly.
| Element | C | Mn | Si | Cr | Ni | Mo | Cu | V | Fe |
|---|---|---|---|---|---|---|---|---|---|
| Content | 0.11 | 0.4 | 0.9 | 1.0 | 2.0 | 3.25 | 2.0 | 0.1 | Bal. |
I performed split Hopkinson pressure bar (SHPB) tests to obtain the dynamic stress-strain response. Cylindrical specimens with a diameter of 3 mm and a height of 3 mm were used. The tests covered strain rates of 1000, 3000, and 5000 s-1 at room temperature, and temperatures of 200, 400, and 600 °C at a strain rate of 5000 s-1. The true stress-strain curves were recorded, and the yield strength was extracted using the 0.2% offset method. Table 2 summarizes the yield strengths under different conditions.
| Strain rate (s-1) | Temperature (°C) | Yield strength (MPa) |
|---|---|---|
| 1000 | 25 | 1851 ± 15 |
| 3000 | 25 | 2159 ± 12 |
| 5000 | 25 | 2655 ± 30 |
| 5000 | 200 | 2364 ± 12 |
| 5000 | 400 | 1938 ± 20 |
| 5000 | 600 | 1583 ± 20 |
The Johnson-Cook constitutive model was used to describe the flow stress. The model is expressed as:
$$
\sigma = \left( A + B \varepsilon_{eq}^{n} \right) \left( 1 + C \ln \frac{\dot{\varepsilon}}{\dot{\varepsilon}_0} \right) \left( 1 – \left( \frac{T – T_r}{T_m – T_r} \right)^m \right)
$$
where \(\sigma\) is the flow stress, \(\varepsilon_{eq}\) is the equivalent plastic strain, \(\dot{\varepsilon}\) is the plastic strain rate, \(\dot{\varepsilon}_0\) is the reference strain rate, \(T\) is the test temperature, \(T_r\) is room temperature, and \(T_m\) is the melting temperature. The five material constants are \(A\), \(B\), \(n\), \(C\), and \(m\). I fitted these constants using the experimental data. The reference strain rate was set to 1000 s-1. The fitted parameters are listed in Table 3. The comparison between the fitted curves and the experimental data showed good agreement, confirming the validity of the model.
| Parameter | Value |
|---|---|
| \(\dot{\varepsilon}_0\) (s-1) | 1000 |
| \(A\) (MPa) | 1900 |
| \(B\) (MPa) | 1523 |
| \(n\) | 0.2269 |
| \(C\) | 0.0613 |
| \(m\) | 0.945 |
The yield strength increases with strain rate and decreases with temperature, as shown in Table 2. This behavior is well captured by the Johnson-Cook model. The calibrated model was then used in the finite element simulations of shot peening. For miter gears made of similar high-strength steels, the same constitutive framework can be applied after appropriate calibration.
3. DEM-FEM Coupled Simulation Model
I established a sequential DEM-FEM model to simulate the shot peening of a herringbone gear. The model consists of two stages. In the first stage, the discrete element method (DEM) is used to simulate the motion of shots, their collisions with each other, and their impacts on the gear surface. This stage provides the impact locations, velocities, and number of impacts on each surface element. In the second stage, the finite element method (FEM) is used to simulate the elastic-plastic deformation of the gear surface under the impact conditions obtained from the DEM stage. The FEM model also incorporates the initial residual stress and initial surface roughness measured from the actual gear.
3.1 Discrete Element Modeling
The herringbone gear geometry was created in a CAD environment. The gear parameters are listed in Table 4. The tooth surface was discretized into triangular elements for the DEM simulation. The gear was rotated at a constant angular velocity, and the nozzle moved along the gear axis in a reciprocating motion. The shot stream was generated at the nozzle with a specified mass flow rate, shot diameter, and initial velocity. The shot material was high-hardness cast steel, and the gear material was the same 10CrNi2Mo3Cu2V steel. The contact parameters between shots and between shots and the gear were defined using the Hertz-Mindlin model with appropriate restitution and friction coefficients.
| Parameter | Value |
|---|---|
| Normal module | 2.514 |
| Number of teeth | 27 |
| Normal pressure angle (°) | 22.5 |
| Helix angle (°) | 30 |
The DEM simulation provides the impact information for each surface element. The number of impacts per unit area, \(N\), is calculated as:
$$
N = \frac{N_d}{S}
$$
where \(N_d\) is the number of impacts recorded on a given element and \(S\) is the area of the element. When the peening process is repeated \(k\) times, the number of impacts in the FEM model is \(N_f = N \cdot k\). The impact velocity in the global coordinate system is transformed to a local coordinate system attached to the tooth surface. This transformation is necessary because the tooth flank is curved. The local coordinate system is defined by three adjacent nodes on the surface. The transformation matrix between the global coordinate system \(S_0\) and the local coordinate system \(S\) is derived from the node coordinates. The velocity components in the local system are then obtained as:
$$
\begin{bmatrix} v_x \\ v_y \\ v_z \end{bmatrix} = \begin{bmatrix} X_1^T \\ Y_1^T \\ Z_1^T \end{bmatrix} v_0
$$
where \(v_0\) is the velocity vector in the global system, and \(X_1, Y_1, Z_1\) are the orthonormal basis vectors of the local system. This procedure allows me to accurately represent the impact angle and velocity for each element.
3.2 Finite Element Modeling
The FEM model represents a small portion of the tooth surface, typically a 1 mm × 1 mm × 0.5 mm region. The mesh is refined near the impact zone, with element sizes of 10 μm × 10 μm × 10 μm. The bottom of the target is fully constrained, and infinite elements surround the target to absorb reflected stress waves. The shots are modeled as rigid or elastic spheres, depending on the analysis. The initial positions of the shots are randomly generated using a Python script. The impact velocity and number of impacts are taken from the DEM simulation. The initial residual stress and surface roughness are assigned to the target elements before the shot impacts are applied.
The material behavior follows the Johnson-Cook model described in Section 2. The contact between shots and the target is defined as surface-to-surface with a penalty friction coefficient of 0.2. The simulation is performed using an explicit dynamic solver. After the impacts, the residual stress distribution is extracted by averaging the stresses in each layer of elements. The surface topography is obtained from the node displacements, and the surface roughness parameters \(S_a\), \(S_q\), \(S_p\), \(S_v\), and \(S_z\) are calculated.
The residual stress in the depth direction is a key output. I define the depth as the distance from the original surface. The residual stress in the x-direction (parallel to the tooth width) and y-direction (parallel to the tooth height) are both extracted. The von Mises stress and the maximum principal stress are also computed. The model accounts for the initial residual stress gradient from the grinding process, which is typically a shallow compressive layer. By including this initial state, the predicted final residual stress field is more realistic.
4. Shot Peening Intensity Prediction
Shot peening intensity is a measure of the peening effect and is defined by the saturation curve obtained from Almen strip tests. I developed a numerical method to predict the intensity without performing a full experimental campaign. The method consists of four steps: (1) calculation of the impact distribution on the Almen strip surface, (2) simulation of the peening process using the FEM model, (3) extraction of the residual stress profile, and (4) calculation of the arc height and the saturation curve.
The Almen strip is a thin rectangular plate of SAE 1070 spring steel, with dimensions 76 mm × 19 mm × 1.29 mm for the A-type strip. The strip is fixed on a fixture during peening. The arc height is defined as the difference in height between the center point and the four corner points of a 31.75 mm × 15.87 mm rectangle located at the center of the strip. I modeled the strip with a fine mesh near the surface and coarser mesh in the interior. The residual stress profile from the peening simulation is applied as an initial condition to the strip, and a static equilibrium analysis is performed to obtain the deformed shape. The arc height is then calculated from the nodal displacements.
The saturation curve is obtained by plotting the arc height against the peening time. According to the standard definition, the peening intensity is the arc height at the point where doubling the peening time increases the arc height by 10%. I used this definition to extract the intensity from the simulated curve. Figure 1 shows a typical saturation curve. The intensity is denoted as \(I\). The peening time corresponding to the intensity is \(t\), and the time for 10% increase is \(2t\).
$$
I = h(2t) – h(t) = 0.1 h(t)
$$
where \(h(t)\) is the arc height at time \(t\). The simulation was repeated for different shot velocities, diameters, and hardness values. The results are summarized in Table 5. The predicted intensities agree well with the experimental values, with errors less than 10%.
| Shot type | Velocity (m/s) | Predicted intensity (mmA) | Experimental intensity (mmA) | Error (%) |
|---|---|---|---|---|
| S110 high hardness | 70 | 0.218 | 0.230 | 5.2 |
| S110 high hardness | 100 | 0.260 | 0.290 | 10.3 |
| S170 high hardness | 70 | 0.312 | 0.330 | 5.5 |
| S230 high hardness | 70 | 0.409 | 0.440 | 7.0 |
| S110 low hardness | 70 | 0.166 | 0.180 | 7.8 |
The intensity increases with shot velocity, shot diameter, and shot hardness. For a given shot type, the relationship between intensity and velocity can be approximated by a power law:
$$
I = a v^b
$$
where \(a\) and \(b\) are constants that depend on the shot and target materials. For S110 high-hardness shots, I found \(a = 0.0009\) and \(b = 1.2\) when \(v\) is in m/s. This empirical relation is useful for quick estimates. The intensity also increases with shot diameter. For S110, S170, and S230 shots at 70 m/s, the intensities are 0.218, 0.312, and 0.409 mmA, respectively. The ratio of intensities roughly scales with the square of the diameter ratio. Shot hardness has a significant effect: for S110 shots at 70 m/s, the intensity drops from 0.218 mmA to 0.166 mmA when the hardness decreases from high to low. This is because softer shots deform more upon impact, reducing the energy transferred to the target.
5. Influence of Process Parameters on Surface Integrity
I used the validated DEM-FEM model to study the effects of shot velocity, shot diameter, and shot hardness on the surface morphology and residual stress of herringbone gears. The gear was divided into different regions along the tooth profile: near the tip, at the pitch circle, and near the root. The impact information, surface roughness, and residual stress were extracted for each region.
5.1 Impact Information
The impact information includes the number of impacts per unit area and the impact velocity distribution. For a herringbone gear, the tooth root region experiences more impacts because the shots are confined in the narrow space and collide with each other. The tooth tip region experiences fewer impacts because the space is open. Table 6 shows the number of impacts per unit area for different regions under S110 high-hardness shots at 60 m/s. The data are for the left flank of a left-hand gear. The right flank shows similar trends.
| Region | Position index | Impacts per unit area (mm-2) |
|---|---|---|
| Near tip | 1 | 1900 |
| Near pitch | 5 | 2400 |
| Near root | 10 | 6000 |
The impact velocity distribution is also non-uniform. I analyzed the velocity components in the local coordinate system: \(v_x\) (tooth width direction), \(v_y\) (tooth height direction), \(v_z\) (normal direction), and the resultant velocity \(v_m\). At the pitch circle, about 37% of the impacts retain the initial nozzle velocity of 60 m/s. Near the tip, about 47% retain this velocity, while near the root only 19% do. This is because the root region has more shot-to-shot collisions, which dissipate energy. The velocity component \(v_x\) is mostly within ±20 m/s, with about 62% of impacts having \(v_x = 0\). The component \(v_y\) is distributed between -30 and 60 m/s, with a peak at 55 m/s. The component \(v_z\) is between 0 and 40 m/s, with 87% of impacts between 0 and 30 m/s. These distributions are essential for accurate FEM simulation.
When the shot velocity increases from 60 to 100 m/s, the number of impacts near the tip increases from 1900 to 2500, while the number near the root decreases from 6000 to 4700. The pitch region remains relatively stable at around 2500. This is because higher velocity shots are more likely to rebound and escape the root region, reducing the number of secondary impacts. The velocity distributions shift to higher values, but the overall shape of the distribution remains similar.
5.2 Surface Morphology
Surface morphology is characterized by the 3D topography and the roughness parameters. The initial surface has grinding marks. After shot peening, the surface is covered with overlapping craters. The roughness parameters \(S_a\) (arithmetic mean height) and \(S_q\) (root mean square height) are used to quantify the surface finish. Table 7 shows the roughness for different shot velocities. As the velocity increases from 60 to 100 m/s, \(S_a\) increases from 0.523 μm to 0.922 μm, an increase of 76.3%. The surface roughness is highly sensitive to shot velocity.
| Velocity (m/s) | \(S_a\) (μm) | \(S_q\) (μm) | \(S_p\) (μm) | \(S_v\) (μm) | \(S_z\) (μm) |
|---|---|---|---|---|---|
| 60 | 0.523 | 0.672 | 2.510 | 2.890 | 5.400 |
| 80 | 0.721 | 0.915 | 3.120 | 3.450 | 6.570 |
| 100 | 0.922 | 1.165 | 3.980 | 4.120 | 8.100 |
The effect of shot diameter is also significant. Table 8 shows the roughness for S110, S170, and S230 shots at 60 m/s. As the diameter increases from 350 μm (S110) to 700 μm (S230), \(S_a\) increases from 0.523 μm to 0.874 μm. The larger craters produce a rougher surface. The initial grinding marks are completely covered by S230 shots, while they are still visible with S110 shots.
| Shot type | Diameter (μm) | \(S_a\) (μm) | \(S_q\) (μm) | \(S_z\) (μm) |
|---|---|---|---|---|
| S110 | 350 | 0.523 | 0.672 | 5.400 |
| S170 | 500 | 0.721 | 0.915 | 6.570 |
| S230 | 700 | 0.874 | 1.095 | 7.850 |
Shot hardness also affects the surface morphology. High-hardness shots create deeper craters and a rougher surface. For S110 shots at 60 m/s, the high-hardness shot produces \(S_a = 0.523\) μm, while the low-hardness shot produces \(S_a = 0.316\) μm. For S170 shots, the high-hardness shot gives \(S_a = 0.721\) μm, while the low-hardness shot gives \(S_a = 0.339\) μm. The low-hardness shots deform plastically themselves, reducing the indentation depth in the target. This is an important consideration when selecting shot material for herringbone gears and miter gears.
5.3 Residual Stress
Residual stress is the most important outcome of shot peening. I extracted the residual stress profile as a function of depth for different process parameters. The surface residual stress, maximum compressive residual stress, and depth of maximum stress are key metrics. Table 9 shows the results for different shot velocities. As the velocity increases from 60 to 100 m/s, the maximum compressive residual stress increases slightly from -1350 MPa to -1400 MPa, while the depth of the maximum stress increases from 25 μm to 45 μm. The depth of the compressive layer also increases from 70 μm to 90 μm. The surface residual stress shows a non-monotonic trend: it decreases from -874 MPa to -836 MPa and then increases to -934 MPa. This is due to the competing effects of plastic deformation and stress relaxation.
| Velocity (m/s) | Surface stress (MPa) | Max. compressive stress (MPa) | Depth of max. stress (μm) | Compressive layer depth (μm) |
|---|---|---|---|---|
| 60 | -874 | -1350 | 25 | 70 |
| 80 | -836 | -1365 | 32 | 80 |
| 100 | -934 | -1400 | 45 | 90 |
The effect of shot diameter is shown in Table 10. As the diameter increases from 350 to 700 μm, the surface residual stress decreases from -850 MPa to -573 MPa, while the maximum compressive stress remains around -1300 to -1350 MPa. The depth of the maximum stress increases from 32 μm to 60 μm, and the compressive layer depth increases from 70 μm to 160 μm. Larger shots create a deeper compressive layer but a lower surface stress. This trade-off must be considered in process design.
| Shot type | Surface stress (MPa) | Max. compressive stress (MPa) | Depth of max. stress (μm) | Compressive layer depth (μm) |
|---|---|---|---|---|
| S110 | -850 | -1350 | 32 | 70 |
| S170 | -759 | -1307 | 45 | 100 |
| S230 | -573 | -1317 | 60 | 160 |
Shot hardness has a pronounced effect on residual stress. Table 11 compares high-hardness and low-hardness shots for S110 and S170 at 60 m/s. For S110, the high-hardness shot gives a surface stress of -874 MPa and a maximum stress of -1350 MPa at 30 μm depth, while the low-hardness shot gives -662 MPa and -1000 MPa at 15 μm depth. For S170, the high-hardness shot gives -760 MPa and -1307 MPa at 45 μm, while the low-hardness shot gives -543 MPa and -895 MPa at 30 μm. The compressive layer depth also increases with hardness. This shows that harder shots are more effective in introducing deep compressive residual stress.
| Shot type | Hardness | Surface stress (MPa) | Max. compressive stress (MPa) | Depth of max. stress (μm) | Compressive layer depth (μm) |
|---|---|---|---|---|---|
| S110 | High | -874 | -1350 | 30 | 70 |
| S110 | Low | -662 | -1000 | 15 | 60 |
| S170 | High | -760 | -1307 | 45 | 100 |
| S170 | Low | -543 | -895 | 30 | 80 |
The residual stress distribution along the tooth profile is relatively uniform. For S110 high-hardness shots at 60 m/s, the surface residual stress near the tip, at the pitch circle, and near the root are -837 MPa, -874 MPa, and -855 MPa, respectively. The maximum compressive stress is around -1345 MPa for all three regions, and the depth of maximum stress is 27–30 μm. The compressive layer depth is about 70 μm. This indicates that the tooth profile position does not significantly affect the residual stress, despite the differences in impact information. The reason is that the plastic deformation zone is shallow and the stress field is dominated by the local impact conditions, which are similar in terms of effective energy.
5.4 Shot Peening Intensity and Its Relation to Surface Integrity
The shot peening intensity is a convenient parameter that combines the effects of shot velocity, diameter, and hardness. I found that for a given intensity, the residual stress profile is similar regardless of the combination of parameters. Table 12 shows the intensity and corresponding maximum compressive stress for different parameter sets. The intensity increases with velocity, diameter, and hardness. The maximum compressive stress also increases, but not linearly. The depth of maximum stress is more strongly correlated with the intensity. For an intensity of approximately 0.22 mmA, the depth of maximum stress is around 30 μm. For 0.31 mmA, it is around 45 μm. For 0.41 mmA, it is around 60 μm. This relationship can be expressed as:
$$
d_{\max} = k I^{0.8}
$$
where \(d_{\max}\) is the depth of maximum compressive stress, \(I\) is the intensity, and \(k\) is a constant. For the herringbone gear steel, \(k \approx 120\) when \(d_{\max}\) is in μm and \(I\) is in mmA. This equation is useful for rapid estimation. The surface roughness also correlates with intensity. Higher intensity generally produces higher roughness, but the relationship depends on the shot size. For a given intensity, smaller shots tend to produce lower roughness. This is an important consideration for miter gears, where surface finish requirements may be stringent.
| Shot type | Velocity (m/s) | Intensity (mmA) | Max. compressive stress (MPa) | Depth of max. stress (μm) |
|---|---|---|---|---|
| S110 high | 70 | 0.218 | -1350 | 30 |
| S110 high | 100 | 0.260 | -1400 | 45 |
| S170 high | 70 | 0.312 | -1307 | 45 |
| S230 high | 70 | 0.409 | -1317 | 60 |
| S110 low | 70 | 0.166 | -1000 | 15 |
| S170 low | 70 | 0.220 | -895 | 30 |
6. Experimental Validation
I conducted a series of experiments to validate the DEM-FEM model and the intensity prediction method. The experiments included Almen strip tests, single crater measurements, and full-scale herringbone gear peening. The gear material and shot material were the same as in the simulations. The Almen strip tests were performed on an A-type strip with a robotic shot peening system. The intensity was measured for different nozzle travel speeds. The saturation curve was constructed, and the intensity was determined according to the standard definition. The measured intensity for the baseline condition was 0.219 mmA, which agrees well with the predicted value of 0.230 mmA (error 5.2%).
Single crater measurements were performed using a scanning electron microscope. The crater diameter was measured for different shot velocities. Table 13 compares the measured and simulated crater diameters. The error is within 10% for all velocities. This validates the impact mechanics in the FEM model.
| Velocity (m/s) | Measured diameter (μm) | Simulated diameter (μm) | Error (%) |
|---|---|---|---|
| 60 | 100 | 110 | 10.0 |
| 70 | 120 | 125 | 4.2 |
| 80 | 155 | 150 | 3.2 |
| 100 | 170 | 160 | 5.9 |
For the full-scale herringbone gear, I measured the surface roughness and residual stress after peening. The gear was cut into single teeth for measurement. The surface roughness was measured with a white light interferometer, and the residual stress was measured with X-ray diffraction. The initial surface roughness \(S_a\) was about 0.43 μm, and after peening it increased to about 0.56 μm. The initial residual stress was about -300 MPa at the surface, and after peening the surface stress was about -830 MPa, with a maximum compressive stress of -1250 MPa at a depth of 30 μm. The compressive layer depth was about 100 μm.
I compared the experimental results with the simulation results under the same process parameters. The predicted surface roughness was 0.64 μm, while the measured value was 0.57 μm, giving an error of 12.3%. The predicted maximum compressive stress was -1350 MPa, while the measured value was -1250 MPa, giving an error of 8.0%. The predicted depth of maximum stress was 30 μm, which matched the measured value. The predicted compressive layer depth was 100 μm, which also matched. These results confirm the accuracy of the DEM-FEM model. The model is therefore suitable for predicting the surface integrity of herringbone gears and can be extended to miter gears with appropriate geometric modifications.
The experimental validation also showed that the left and right flanks of the herringbone gear have similar roughness and residual stress, which is consistent with the simulation. The difference between the left and right flanks was within 80 MPa for residual stress and within 0.01 μm for roughness. This indicates that the peening process is fairly symmetric for the herringbone gear when the nozzle moves along the gear axis. For miter gears, however, the symmetry may be different due to the intersecting axes, and the model should be adjusted accordingly.
7. Discussion
The results show that shot peening can significantly improve the surface integrity of herringbone gears. The compressive residual stress introduced by peening increases the fatigue strength and wear resistance. The surface roughness increases, but it remains within acceptable limits for many applications. The DEM-FEM model captures the complex interaction between shots and the curved tooth surface, including the shadowing effect and shot-to-shot collisions. This is a major advantage over simpler flat-target models. The intensity prediction method provides a fast way to estimate the peening intensity without extensive experiments. This is particularly useful for optimizing process parameters for miter gears and other complex geometries.
The influence of shot velocity, diameter, and hardness can be summarized as follows. Increasing shot velocity increases the depth of the compressive layer and the maximum compressive stress, but also increases surface roughness. Increasing shot diameter increases the depth of the compressive layer more effectively than velocity, but decreases the surface compressive stress. Increasing shot hardness increases both the surface compressive stress and the depth of the compressive layer. Therefore, a combination of high hardness and moderate diameter may be optimal for achieving a deep compressive layer with acceptable roughness. For miter gears, the same principles apply, but the impact angle may vary more widely, so the model should be used to evaluate the specific geometry.
The shot peening intensity is a useful scalar parameter that correlates with the depth of maximum compressive stress and the compressive layer depth. I found that the depth of maximum stress scales with intensity as \(d_{\max} = k I^{0.8}\). This relationship can be used to quickly estimate the required intensity for a target depth. The surface roughness, however, depends on both intensity and shot size. For a given intensity, smaller shots produce lower roughness. This is important for miter gears, where surface finish may be critical for motion transmission.
8. Conclusions
I have developed a DEM-FEM coupled model to predict the surface morphology and residual stress of herringbone gears after shot peening. The model incorporates the actual gear geometry, initial residual stress, and initial surface roughness. I calibrated the Johnson-Cook constitutive model for the gear steel using split Hopkinson pressure bar tests. The model was validated against Almen strip tests, single crater measurements, and full-scale gear peening experiments. The errors in surface roughness and residual stress are less than 15%. The main conclusions are as follows.
(1) The Johnson-Cook model accurately describes the strain-rate and temperature-dependent behavior of the gear steel. The yield strength increases with strain rate and decreases with temperature.
(2) The DEM-FEM model captures the non-uniform impact conditions on the herringbone gear tooth surface. The tooth root region experiences more impacts but lower impact velocities due to shot-to-shot collisions. The tooth tip region experiences fewer impacts but higher velocities.
(3) Shot velocity, diameter, and hardness have significant effects on surface integrity. Increasing velocity increases the depth of the compressive layer and the maximum compressive stress, but also increases roughness. Increasing diameter increases the depth of the compressive layer but decreases the surface compressive stress. Increasing hardness increases both the surface compressive stress and the depth of the compressive layer.
(4) The shot peening intensity can be predicted using the Almen strip model with an error of less than 10%. The intensity correlates with the depth of maximum compressive stress and the compressive layer depth. The relationship \(d_{\max} = k I^{0.8}\) provides a quick estimation tool.
(5) The surface integrity of herringbone gears can be optimized by selecting appropriate process parameters. For a deep compressive layer with moderate roughness, a combination of high shot velocity, moderate shot diameter, and high shot hardness is recommended. The same methodology can be applied to miter gears and other complex gear types, although the geometric model must be adapted.
Overall, the DEM-FEM coupled model and the intensity prediction method provide a powerful tool for designing shot peening processes for herringbone gears and miter gears. They reduce the need for costly and time-consuming experiments and enable rapid optimization of process parameters.
Nomenclature
| Symbol | Description |
|---|---|
| \(\sigma\) | Flow stress |
| \(\varepsilon_{eq}\) | Equivalent plastic strain |
| \(\dot{\varepsilon}\) | Plastic strain rate |
| \(\dot{\varepsilon}_0\) | Reference strain rate |
| \(T\) | Temperature |
| \(T_r\) | Room temperature |
| \(T_m\) | Melting temperature |
| \(A, B, n, C, m\) | Johnson-Cook parameters |
| \(N\) | Number of impacts per unit area |
| \(N_d\) | Number of impacts on an element |
| \(S\) | Area of an element |
| \(v\) | Shot velocity |
| \(I\) | Shot peening intensity |
| \(h\) | Arc height |
| \(S_a\) | Arithmetic mean roughness |
| \(S_q\) | Root mean square roughness |
| \(S_p\) | Maximum peak height |
| \(S_v\) | Maximum valley depth |
| \(S_z\) | Maximum height of profile |
| \(d_{\max}\) | Depth of maximum compressive stress |
| \(k\) | Constant in intensity-depth relation |
I believe that the findings presented here provide a solid foundation for the industrial application of shot peening to herringbone gears and miter gears. Future work should focus on extending the model to consider the effects of coverage and multiple peening passes, as well as the interaction between shot peening and other surface treatments.