
In this research, I studied the influence of shot peening process parameters on the surface morphology and residual stress of a miter gear with a herringbone tooth arrangement. The miter gear investigated here is made of 10CrNi2Mo3Cu2V heat-resistant steel, and it operates under high-load and high-speed conditions. For such a miter gear, surface integrity is not a secondary issue; it directly controls wear resistance, contact fatigue life, bending fatigue strength, and transmission stability. I focused on the coupled effects of shot velocity, shot diameter, shot hardness, shot type, coverage, and peening intensity. I constructed a DEM-FEM sequential coupling model, fitted a Johnson-Cook constitutive equation from Hopkinson bar tests, developed an Almen strip model for peening intensity prediction, and validated the entire framework with miter gear peening experiments. The results show that the miter gear surface can be predicted with good accuracy, and the process parameters can be selected with a clearer physical basis.
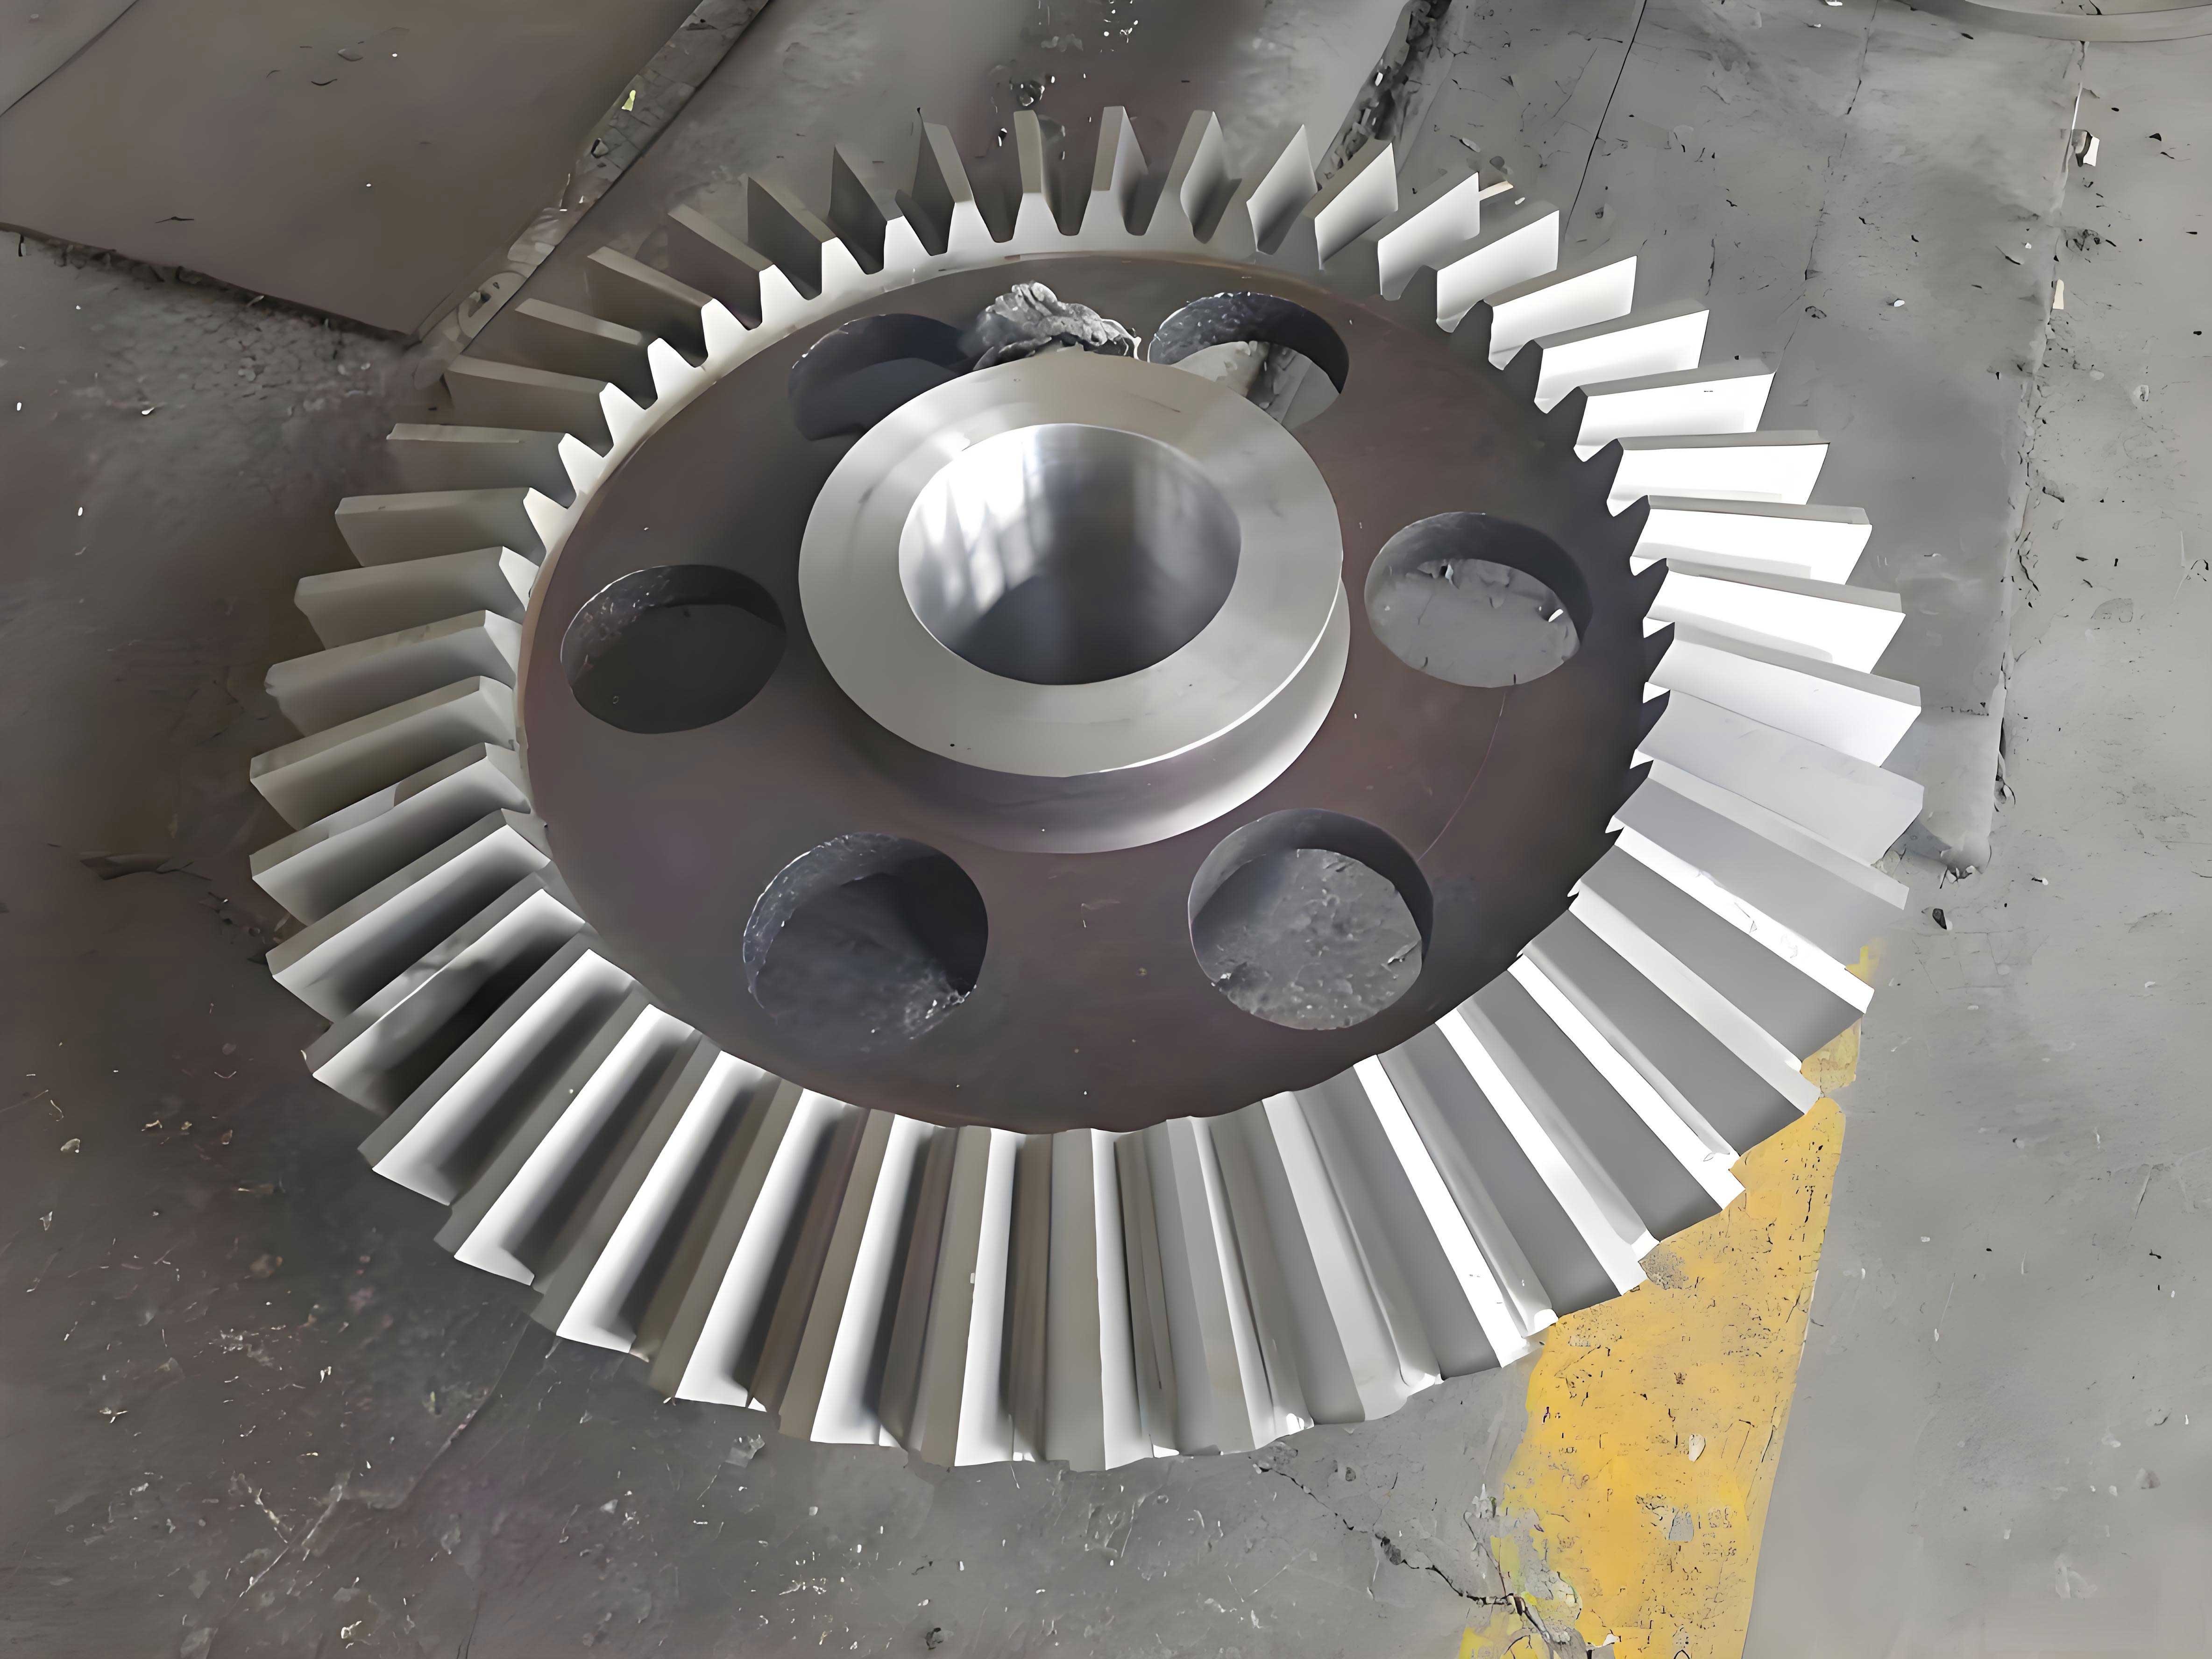
Motivation for studying the miter gear. A miter gear used in aerospace and heavy machinery must survive severe contact and bending loads. Shot peening is one of the final surface strengthening operations applied to such a miter gear. During shot peening, many hard shots impact the miter gear surface at high velocity, producing heterogeneous plastic deformation, compressive residual stress, and a changed surface morphology. These changes can improve fatigue resistance, but they can also increase roughness. For a miter gear with a complex tooth profile and narrow tooth slots, the impact conditions are not uniform. Shots collide with each other, with the tooth flank, and with the root fillet. Therefore, a simple flat-target model cannot fully represent the miter gear peening process. I therefore treated the miter gear as a curved, constrained, and initially stressed target and developed a coupled discrete element method and finite element method framework.
Material constitutive model for the miter gear. The accuracy of the miter gear peening simulation depends strongly on the target material model. I performed split Hopkinson pressure bar tests on 10CrNi2Mo3Cu2V steel. The specimens were cylindrical, with a diameter of 3 mm and a height of 3 mm. I applied strain rates of 1000, 3000, and 5000 s\(^{-1}\) at room temperature. I also performed high-temperature tests at 200, 400, and 600 \(^\circ\)C under a strain rate of 5000 s\(^{-1}\). The measured true stress-true strain curves were used to fit the Johnson-Cook constitutive equation. The Johnson-Cook model for the miter gear material is written as
$$
\sigma = \left(A + B \varepsilon_{eq}^{n}\right)\left(1 + C \ln\frac{\dot{\varepsilon}}{\dot{\varepsilon}_0}\right)\left(1 – \left(\frac{T – T_r}{T_m – T_r}\right)^m\right)
$$
where \(\sigma\) is the flow stress, \(\varepsilon_{eq}\) is the equivalent plastic strain, \(\dot{\varepsilon}\) is the equivalent plastic strain rate, \(\dot{\varepsilon}_0\) is the reference strain rate, \(T\) is the test temperature, \(T_r\) is room temperature, and \(T_m\) is the melting temperature. The fitted parameters for the miter gear material are listed in Table 1. I used these parameters in all finite element calculations of the miter gear.
| Parameter | Value | Unit |
|---|---|---|
| \(\dot{\varepsilon}_0\) | 1000 | s\(^{-1}\) |
| \(A\) | 1900 | MPa |
| \(B\) | 1523 | MPa |
| \(n\) | 0.2269 | — |
| \(C\) | 0.0613 | — |
| \(m\) | 0.945 | — |
The Hopkinson bar results showed a clear strain-rate sensitivity and temperature sensitivity for the miter gear steel. As the strain rate increased from 1000 to 5000 s\(^{-1}\), the yield strength increased from about 1851 MPa to about 2655 MPa. As the temperature increased from 25 to 600 \(^\circ\)C, the yield strength decreased from about 2655 MPa to about 1583 MPa. This behavior is important for the miter gear because shot peening generates high strain rates near the contact surface. If the miter gear material model ignores strain-rate hardening or thermal softening, the predicted residual stress and surface morphology will deviate from reality.
| Strain rate (s\(^{-1}\)) | Temperature (\(^\circ\)C) | Yield strength (MPa) |
|---|---|---|
| 1000 | 25 | 1851 |
| 3000 | 25 | 2159 |
| 5000 | 25 | 2655 |
| 5000 | 200 | 2364 |
| 5000 | 400 | 1938 |
| 5000 | 600 | 1583 |
DEM-FEM model of the miter gear. I built a sequential DEM-FEM model to simulate shot peening of the miter gear. In the DEM stage, I imported the miter gear geometry and created a triangular surface mesh. The miter gear had 27 teeth, a normal module of 2.514 mm, a normal pressure angle of 22.5\(^\circ\), and a helix angle of 30\(^\circ\). The nozzle was placed 150 mm from the tip circle. The shot flow rate was 6 kg/min, the nozzle travel speed was 120 mm/min, and the miter gear rotated at 20 rpm. The nozzle moved along the gear axis in two opposite passes. The shot stream was modeled as a conical jet with a scattering angle of 5\(^\circ\). I used S110, S170, and S230 cast steel shots with nominal diameters of 350, 500, and 700 \(\mu\)m, respectively. For the low-hardness cases, I also used S110 and S170 shots with lower yield strength.
| Miter gear parameter | Value |
|---|---|
| Normal module | 2.514 mm |
| Number of teeth | 27 |
| Normal pressure angle | 22.5\(^\circ\) |
| Helix angle | 30\(^\circ\) |
| Material | 10CrNi2Mo3Cu2V |
| Shot types | S110, S170, S230 |
| Shot flow rate | 6 kg/min |
| Nozzle travel speed | 120 mm/min |
| Miter gear rotation speed | 20 rpm |
In the DEM stage, I extracted the impact velocity, impact angle, impact position, and impact count on each surface element of the miter gear. Because the tooth flank of the miter gear is a curved surface, I transformed the global impact velocity into a local coordinate system attached to each tooth surface element. The local velocity vector was obtained as
$$
v_{\text{local}} =
\begin{bmatrix}
X_1^T \\
Y_1^T \\
Z_1^T
\end{bmatrix}
v_0
$$
where \(X_1\), \(Y_1\), and \(Z_1\) are the local base vectors of the tooth surface element, and \(v_0\) is the global impact velocity. I then computed the impact density on the miter gear surface as
$$
N = \frac{N_d}{S}, \qquad N_f = N k
$$
where \(N_d\) is the number of impacts on an element, \(S\) is the element area, \(k\) is the number of peening passes, \(N\) is the impact count per unit area, and \(N_f\) is the total number of impacts used in the finite element model. This transformation was necessary because the miter gear tooth surface is not flat, and the local normal direction changes along both the tooth profile and the tooth width.
In the FEM stage, I created a local target patch representing a small region of the miter gear surface. The patch size was 1 mm \(\times\) 1 mm \(\times\) 0.5 mm. The central impact zone was meshed with 10 \(\mu\)m \(\times\) 10 \(\mu\)m \(\times\) 10 \(\mu\)m elements. The top 200 \(\mu\)m of the miter gear patch was refined to capture the residual stress gradient. The bottom of the patch was fully fixed, and infinite elements were placed around the patch to absorb stress waves. The contact between the shot and the miter gear surface was defined as surface-to-surface contact with a penalty friction coefficient of 0.2. The initial roughness and initial residual stress of the miter gear were also included. I measured the pre-peened miter gear surface with white light interferometry and mapped the measured point cloud onto the target patch. I also measured the initial residual stress gradient and assigned it layer by layer to the miter gear patch. In this way, the simulation did not start from an ideal smooth and stress-free miter gear surface.
Shot peening intensity model for the miter gear. Peening intensity is one of the most important control parameters for the miter gear strengthening process. In industrial practice, peening intensity is usually measured with an Almen strip. However, repeated Almen tests are costly and time-consuming for every miter gear parameter combination. I therefore built a finite element model of the Almen strip and computed the arc height from the residual stress field. The Almen strip was made of SAE1070 steel. The strip dimensions were 76 mm \(\times\) 19 mm \(\times\) 1.29 mm. The target patch used for residual stress calculation had a thickness equal to the Almen strip thickness. The residual stress distribution was then mapped into the full Almen strip model, and a static equilibrium analysis gave the strip deflection. The arc height was defined as the height difference between the center point and the average of the four corner points of the 31.75 mm \(\times\) 15.87 mm central rectangle. The peening intensity was determined from the saturation curve by
$$
\frac{H(2t)-H(t)}{H(t)} = 0.10
$$
where \(H(t)\) is the arc height at peening time \(t\). The value \(H(t)\) at the point where this condition is satisfied is the peening intensity. I used this model to predict the intensity for different shot velocities, diameters, hardness values, and shot types. The predicted intensity values were compared with experimental Almen measurements.
| Almen test parameter | Setting |
|---|---|
| Strip type | A |
| Strip material | SAE1070 |
| Strip thickness | 1.29 mm |
| Shot type for validation | S110 |
| Nozzle angle | 80\(^\circ\) |
| Nozzle pressure | 2.5 bar |
| Coverage | greater than 200\% |
| Shot hardness | 55–62 HRC |
Impact information on the miter gear. The miter gear has two opposite helical tooth rows, so the left-hand and right-hand tooth flanks can experience different shot exposure. I compared the impact count distribution on the left and right tooth flanks of the miter gear. The distributions were very similar. For S110 shots at 60 m/s, the impact count per unit area near the tooth tip was about 2000, near the pitch circle it was about 2500, and near the tooth root it was about 6000. The root region of the miter gear had a much higher impact density because the tooth slot is narrow, and shots can rebound and collide repeatedly. In contrast, the tip region is more open, so fewer impacts occur there. These results confirm that the miter gear cannot be treated as a flat plate in shot peening simulation.
| Position on miter gear tooth | Impact count per unit area at 60 m/s S110 |
|---|---|
| Near tooth tip | about 2000 |
| Near pitch circle | about 2500 |
| Near tooth root | about 6000 |
I also analyzed the velocity components in the local coordinate system of the miter gear tooth. At the pitch circle, with an initial shot velocity of 60 m/s, about 37\% of the impacts retained the nozzle velocity. The \(v_x\) component, which is along the tooth width direction, was distributed mainly from \(-20\) to 20 m/s, and about 62\% of the impacts had \(v_x\) close to 0 m/s. The \(v_y\) component, along the tooth height direction, was distributed mainly from \(-30\) to 60 m/s, and about 30\% of the impacts had \(v_y\) near 55 m/s. The \(v_z\) component, along the local normal direction, was distributed mainly from 0 to 40 m/s, and about 87\% of the impacts had \(v_z\) between 0 and 30 m/s. Near the tooth tip, a larger fraction of shots retained the nozzle velocity. Near the tooth root, a smaller fraction retained the nozzle velocity because of repeated collisions. This spatial variation is a key reason why I used DEM to feed the FEM model of the miter gear.
| Velocity component | Main range (m/s) | Dominant feature at pitch circle |
|---|---|---|
| \(v_x\) | \(-20\) to 20 | about 62\% near 0 m/s |
| \(v_y\) | \(-30\) to 60 | about 30\% near 55 m/s |
| \(v_z\) | 0 to 40 | about 87\% between 0 and 30 m/s |
| \(v_m\) | 0 to 60 | about 37\% at nozzle velocity |
When the shot velocity increased from 60 to 100 m/s, the impact count near the tooth tip of the miter gear increased, while the impact count near the tooth root decreased. At the pitch circle, the impact count remained relatively stable. The fraction of shots retaining the nozzle velocity decreased from about 37\% to about 30\% as the initial velocity increased. This happened because higher shot velocity increases collisions among shots and between shots and the miter gear surface, causing more energy loss. For the miter gear, this means that increasing shot velocity does not simply increase the number of high-speed impacts at every location. The root region especially experiences a complex impact environment.
When the shot diameter increased from S110 to S230 at 60 m/s, the impact count per unit area decreased over the whole miter gear tooth. Near the root, the count dropped from about 6000 to about 640. Near the tip, it dropped from about 1900 to about 350. At the pitch circle, it dropped from about 2400 to about 370. The velocity distribution trends remained similar, but the fraction of shots retaining the nozzle velocity decreased slightly. Larger shots occupy more space in the shot stream, so fewer shots are generated for the same mass flow. In a narrow miter gear tooth slot, larger shots also collide more frequently. These effects are captured only when the miter gear geometry is included in the DEM model.
Surface morphology of the peened miter gear. Surface morphology is one of the most visible indicators of miter gear surface integrity. I quantified morphology with the areal roughness parameters \(S_a\), \(S_q\), \(S_p\), \(S_v\), and \(S_z\). These parameters are defined as
$$
S_a = \frac{1}{n}\sum_{i=1}^{n}|Z_i|
$$
$$
S_q = \sqrt{\frac{1}{n}\sum_{i=1}^{n}Z_i^2}
$$
$$
S_p = \max_i(Z_i), \qquad S_v = \min_i(Z_i), \qquad S_z = S_p + S_v
$$
where \(Z_i\) is the height of point \(i\) relative to the mean plane, and \(n\) is the number of sampled points. I measured the miter gear surface before and after peening. Before peening, the miter gear surface showed clear grinding marks. After peening, the grinding marks were partly or fully covered by craters. The initial surface roughness of the miter gear was about \(S_a = 0.43\)–\(0.45\) \(\mu\)m. After peening, the roughness increased to about \(S_a = 0.56\) \(\mu\)m. Thus, the miter gear roughness increased by roughly 30\%. The left and right tooth flanks of the miter gear showed similar roughness values, and the left-hand and right-hand tooth rows also showed similar roughness values.
| Miter gear condition | \(S_a\) (\(\mu\)m) | \(S_q\) (\(\mu\)m) | \(S_z\) (\(\mu\)m) |
|---|---|---|---|
| Unpeened left flank | 0.435 | 0.553 | 4.697 |
| Unpeened right flank | 0.429 | 0.547 | 5.250 |
| Peened left flank | 0.566 | 0.715 | 5.903 |
| Peened right flank | 0.566 | 0.705 | 6.320 |
| Peened right-hand tooth row | 0.563 | 0.724 | 6.900 |
I then studied how shot velocity changes the miter gear morphology. When the shot velocity increased from 60 to 100 m/s, the miter gear surface roughness increased from 0.523 to 0.922 \(\mu\)m, an increase of about 76\%. The crater size also became larger. At 80 m/s, the original grinding morphology was almost fully covered. At 100 m/s, the craters were larger, and the surface was more uniform, but the roughness was also higher. For the miter gear, this means that a higher shot velocity can produce deeper plastic deformation and stronger residual stress, but it also increases roughness. The process window must therefore balance fatigue performance and surface finish.
| Shot velocity (m/s) | Miter gear surface roughness \(S_a\) (\(\mu\)m) | Observed morphology |
|---|---|---|
| 60 | 0.523 | Partial coverage of grinding marks |
| 80 | Intermediate | Grinding marks mostly covered |
| 100 | 0.922 | Larger craters and more uniform peening texture |
The shot diameter also changed the miter gear surface morphology. As the shot diameter increased from S110 to S230, the miter gear roughness increased from 0.523 to 0.874 \(\mu\)m. The crater size increased, and the initial grinding marks were more completely covered. Larger shots transfer more momentum per impact, so the plastic zone is deeper and wider. However, the number of impacts per unit area decreases when the diameter increases under the same mass flow. The net effect for the miter gear was a rougher but more uniformly peened surface. This finding is important because a miter gear with a narrow root fillet may require a smaller shot to avoid excessive roughness, while a miter gear with a large tooth flank may benefit from a larger shot for deeper compression.
| Shot type | Nominal diameter (\(\mu\)m) | Miter gear \(S_a\) (\(\mu\)m) |
|---|---|---|
| S110 | 350 | 0.523 |
| S170 | 500 | 0.721 |
| S230 | 700 | 0.874 |
Shot hardness was also significant for the miter gear. With S110 shots, the high-hardness condition gave \(S_a = 0.523\) \(\mu\)m, while the low-hardness condition gave \(S_a = 0.316\) \(\mu\)m. With S170 shots, the high-hardness condition gave \(S_a = 0.721\) \(\mu\)m, while the low-hardness condition gave \(S_a = 0.339\) \(\mu\)m. Low-hardness shots deform more themselves, so they transfer less plastic deformation to the miter gear surface. As a result, the miter gear retains more of its original grinding texture and has lower roughness. High-hardness shots create larger craters and stronger surface deformation. For the miter gear, the choice of shot hardness is therefore a trade-off between compressive residual stress and surface roughening.
| Shot type | Hardness condition | Miter gear \(S_a\) (\(\mu\)m) |
|---|---|---|
| S110 | High | 0.523 |
| S110 | Low | 0.316 |
| S170 | High | 0.721 |
| S170 | Low | 0.339 |
Residual stress in the peened miter gear. Residual stress is the most important mechanical outcome of shot peening for the miter gear. I extracted the residual stress along the depth direction and evaluated surface residual stress, maximum compressive residual stress, depth of maximum compression, and influence depth. For S110 high-hardness shots, the surface residual stress was about \(-874\) MPa at 60 m/s, \(-836\) MPa at 80 m/s, and \(-934\) MPa at 100 m/s. The maximum compressive residual stress increased from about \(-1350\) MPa at 60 m/s to about \(-1400\) MPa at 100 m/s. The depth of maximum compression increased from about 25 to 45 \(\mu\)m. The influence depth increased from about 70 to 90 \(\mu\)m. Thus, higher shot velocity deepened the residual stress field in the miter gear. The surface residual stress itself did not change monotonically, but the depth parameters did.
| Shot velocity (m/s) | Surface residual stress (MPa) | Maximum compressive stress (MPa) | Depth of maximum (μm) | Influence depth (μm) |
|---|---|---|---|---|
| 60 | \(-874\) | \(-1350\) | 25 | 70 |
| 80 | \(-836\) | \(-1365\) | 32 | 80 |
| 100 | \(-934\) | \(-1400\) | 45 | 90 |
Shot diameter had a strong effect on the residual stress depth in the miter gear. With S110, S170, and S230 shots at 60 m/s, the surface residual stress decreased from about \(-850\) to \(-759\) to \(-573\) MPa as the diameter increased. The maximum compressive residual stress remained around \(-1300\) MPa, but the depth of the maximum moved from about 32 to 45 to 60 \(\mu\)m. The influence depth increased from about 70 to 100 to 160 \(\mu\)m. This means that larger shots introduce compression deeper into the miter gear, but they can reduce the surface compressive stress. For a miter gear subjected to bending fatigue, a deeper compressive layer may be beneficial. For a miter gear dominated by surface contact fatigue, the near-surface stress state may be more important. The optimal diameter therefore depends on the failure mode of the miter gear.
| Shot type | Surface residual stress (MPa) | Maximum compressive stress (MPa) | Depth of maximum (μm) | Influence depth (μm) |
|---|---|---|---|---|
| S110 | \(-850\) | \(-1350\) | 32 | 70 |
| S170 | \(-759\) | \(-1307\) | 45 | 100 |
| S230 | \(-573\) | \(-1317\) | 60 | 160 |
Shot hardness also changed the residual stress in the miter gear. For S110 shots, increasing the shot hardness increased the surface residual stress from about \(-662\) to \(-874\) MPa, increased the maximum compressive stress from about \(-1000\) to \(-1350\) MPa, increased the depth of maximum compression from about 15 to 30 \(\mu\)m, and increased the influence depth from about 60 to 70 \(\mu\)m. For S170 shots, increasing the shot hardness increased the surface residual stress from about \(-543\) to \(-760\) MPa, increased the maximum compressive stress from about \(-895\) to \(-1307\) MPa, increased the depth of maximum compression from about 30 to 45 \(\mu\)m, and increased the influence depth from about 80 to 100 \(\mu\)m. These results show that harder shots are more effective at introducing deep compression into the miter gear. Softer shots tend to deform themselves and transfer less energy to the miter gear.
| Shot type | Hardness condition | Surface residual stress (MPa) | Maximum compressive stress (MPa) | Depth of maximum (μm) | Influence depth (μm) |
|---|---|---|---|---|---|
| S110 | High | \(-874\) | \(-1350\) | 30 | 70 |
| S110 | Low | \(-662\) | \(-1000\) | 15 | 60 |
| S170 | High | \(-760\) | \(-1307\) | 45 | 100 |
| S170 | Low | \(-543\) | \(-895\) | 30 | 80 |
Peening intensity and process parameter relationships. The peening intensity of the miter gear process was calculated from the Almen arc height saturation curve. I found that peening intensity increased with shot velocity. For S110 high-hardness shots, the intensity increased from about 0.209 to 0.260 mmA as the velocity increased from 60 to 100 m/s. The intensity also increased with shot diameter. At 70 m/s, increasing the shot diameter from 300 to 700 \(\mu\)m increased the intensity from about 0.218 to 0.409 mmA. Shot hardness increased the intensity as well. For S110 shots, the difference between high-hardness and low-hardness intensity increased from about 0.052 to 0.077 mmA as velocity increased. For S170 shots, the difference increased from about 0.056 to 0.105 mmA. The shot type also mattered: at the same velocity, S110 high-hardness cast steel shot produced higher intensity than AZB300 ceramic shot. These results provide a practical map for selecting a peening intensity for the miter gear.
| Process parameter | Change | Peening intensity trend |
|---|---|---|
| Shot velocity | 60 to 100 m/s | 0.209 to 0.260 mmA |
| Shot diameter | 300 to 700 μm at 70 m/s | 0.218 to 0.409 mmA |
| S110 hardness | Low to high | Difference 0.052 to 0.077 mmA |
| S170 hardness | Low to high | Difference 0.056 to 0.105 mmA |
| Shot type | S110 versus AZB300 | S110 produced higher intensity |
Experimental validation of the miter gear model. To validate the miter gear simulation, I first compared the single crater diameter produced by a given shot velocity. The experimental crater diameters were measured with scanning electron microscopy. At 60 m/s, the measured crater diameter was about 100 \(\mu\)m and the simulated value was about 110 \(\mu\)m, giving an error of about 10\%. At 70 m/s, the values were 120 and 125 \(\mu\)m, with an error of about 4\%. At 80 m/s, the values were 155 and 150 \(\mu\)m, with an error of about 3.3\%. At 100 m/s, the values were 170 and 160 \(\mu\)m, with an error of about 5.9\%. These results show that the impact model captured the crater formation of the miter gear reasonably well.
| Shot velocity (m/s) | Measured crater diameter (μm) | Simulated crater diameter (μm) | Error (\%) |
|---|---|---|---|
| 60 | 100 | 110 | 10.0 |
| 70 | 120 | 125 | 4.2 |
| 80 | 155 | 150 | 3.3 |
| 100 | 170 | 160 | 5.9 |
I also compared Almen strip arc heights and intensities. At 70 m/s, the simulated intensity was 0.218 mmA and the measured intensity was 0.230 mmA, an error of about 5.2\%. At 100 m/s, the simulated intensity was 0.260 mmA and the measured intensity was 0.290 mmA, an error of about 10.3\%. The strip bending trends were also consistent. In the long direction of the strip, the measured curvature height was about 165 \(\mu\)m and the simulated value was about 175 \(\mu\)m. In the short direction, the measured value was about 55 \(\mu\)m and the simulated value was about 50 \(\mu\)m. For the 100 m/s case, the long-direction height was about 190 \(\mu\)m experimentally and 210 \(\mu\)m numerically, while the short-direction height was about 80 \(\mu\)m experimentally and 70 \(\mu\)m numerically. The differences were within about 13\%. This validated the intensity prediction model used for the miter gear.
| Shot velocity (m/s) | Simulated intensity (mmA) | Measured intensity (mmA) | Error (\%) |
|---|---|---|---|
| 70 | 0.218 | 0.230 | 5.2 |
| 100 | 0.260 | 0.290 | 10.3 |
After the Almen validation, I performed shot peening on the actual miter gear. The miter gear was fixed vertically on a rotating table, and the nozzle angle was set to 80\(^\circ\). The peening process used S110 shots, a flow rate of 6 kg/min, a nozzle travel speed of 120 mm/min, a miter gear rotation speed of 20 rpm, and a nozzle pressure of 2.5 bar. The coverage exceeded 200\%. Part of the miter gear was protected so that I could compare unpeened and peened regions on the same miter gear. After peening, the miter gear was cut into single teeth for surface integrity characterization.
Surface roughness and residual stress after miter gear peening. The measured miter gear surface roughness increased from about \(S_a = 0.43\)–\(0.45\) \(\mu\)m before peening to about \(S_a = 0.56\) \(\mu\)m after peening. The \(S_q\) value increased from about 0.55 to about 0.72 \(\mu\)m. The left and right flanks of the miter gear showed similar roughness, and the two opposite tooth rows also showed similar roughness. This is consistent with the DEM result that the left-hand and right-hand tooth rows experience similar impact statistics under the same nozzle motion. The roughness increase was moderate, so the miter gear still satisfied the high surface integrity requirement.
| Miter gear region | Condition | \(S_a\) (\(\mu\)m) | \(S_q\) (\(\mu\)m) |
|---|---|---|---|
| Left flank | Unpeened | 0.435 | 0.553 |
| Right flank | Unpeened | 0.429 | 0.547 |
| Left flank | Peened | 0.566 | 0.715 |
| Right flank | Peened | 0.566 | 0.705 |
The residual stress measurements showed a large improvement after peening. Before peening, the miter gear surface residual stress was about \(-300\) MPa, and it decreased to about \(-150\) MPa at a depth of 24 \(\mu\)m. After peening, the miter gear surface residual stress reached about \(-800\) MPa. The maximum compressive residual stress was about \(-1150\) MPa at a depth of about 30 \(\mu\)m. The influence depth extended to about 100 \(\mu\)m. The left and right flanks showed similar trends, with a difference of about 80 MPa. The tooth width and tooth height directions also showed similar trends, with a difference of about 100 MPa. These results confirm that the selected peening process is effective for the miter gear.
| Miter gear condition | Surface residual stress (MPa) | Maximum compressive stress (MPa) | Depth of maximum (μm) |
|---|---|---|---|
| Unpeened | \(-300\) | about \(-300\) near surface | near surface |
| Peened left flank | about \(-800\) | about \(-1150\) | 30 |
| Peened right flank | about \(-800\) | about \(-1150\) | 30 |
Finally, I compared the simulated and experimental miter gear surface integrity under the same process conditions. The simulated surface morphology showed crater patterns similar to the measured miter gear surface. The measured roughness was about 0.57 \(\mu\)m and the simulated roughness was about 0.64 \(\mu\)m, giving an error of about 12.3\%. The measured maximum compressive residual stress was about \(-1250\) MPa and the simulated value was about \(-1350\) MPa, giving an error of about 8\%. The surface residual stress in both cases was about \(-830\) MPa, and the depth of maximum compression was about 30 \(\mu\)m. These comparisons show that the DEM-FEM miter gear model is reliable for predicting both surface morphology and residual stress.
| Quantity | Experimental value | Simulated value | Error (\%) |
|---|---|---|---|
| Miter gear surface roughness \(S_a\) | 0.57 μm | 0.64 μm | 12.3 |
| Maximum compressive residual stress | \(-1250\) MPa | \(-1350\) MPa | 8.0 |
| Surface residual stress | about \(-830\) MPa | about \(-830\) MPa | small |
| Depth of maximum compression | about 30 μm | about 30 μm | small |
Interpretation for miter gear process design. The results show that the miter gear response to shot peening is controlled by a coupled set of parameters. Shot velocity mainly controls impact energy and crater size. Higher velocity increases roughness and deepens the residual stress field. Shot diameter mainly controls the depth of plastic deformation. Larger shots produce deeper compression but lower surface compressive stress and higher roughness. Shot hardness controls the energy transfer efficiency. Harder shots produce higher intensity, larger craters, and deeper compression. Shot type also matters because density and elastic modulus affect the contact mechanics. For the miter gear, an optimized process should therefore specify not only a single parameter but a combination that yields the required intensity and surface integrity. The Almen intensity prediction model developed here provides a fast way to screen parameter combinations before expensive miter gear experiments.
Role of initial surface integrity. I found that the initial grinding texture of the miter gear was still visible after some peening conditions. This means that initial roughness and initial residual stress should not be ignored. In my miter gear model, I mapped the measured initial morphology onto the target patch and assigned the measured initial residual stress gradient to the elements. If the initial state had been omitted, the predicted final roughness would have been too low and the predicted residual stress redistribution would have been inaccurate. For a miter gear that has already undergone grinding or heat treatment, this initial-state representation is essential. The miter gear peening model therefore starts from a realistic surface rather than an ideal one.
Comparison with flat-target assumptions. A flat target model cannot capture the shot-to-shot collisions that occur inside the miter gear tooth slots. In a miter gear, the root region is narrow, and rebounding shots can hit the neighboring tooth flank. The DEM stage showed that the impact count near the root of the miter gear can be several times higher than near the tip. The velocity distribution also changes from tip to root. These spatial variations influence both roughness and residual stress. Therefore, the coupled DEM-FEM approach is more suitable for a miter gear than a simple unit-cell finite element model. I consider the miter gear geometry, nozzle motion, shot flow, and initial surface state as inputs, and I obtain surface morphology and residual stress as outputs.
Practical implications for miter gear manufacturing. The miter gear manufacturing chain often ends with a surface strengthening step. If the peening intensity is too low, the miter gear will not receive enough compressive residual stress. If it is too high, the miter gear surface may become too rough or even damaged. My model shows that intensity can be predicted from shot velocity, diameter, hardness, and type with an error below about 13\%. This allows a miter gear process engineer to estimate intensity without running a full Almen test for every parameter setting. The miter gear model also shows how different combinations can produce the same intensity but different residual stress depths and roughness values. For example, a large shot at low velocity and a small shot at high velocity may give similar intensity, but the large shot will produce a deeper compressive layer and a rougher miter gear surface. The choice should depend on the dominant failure mode of the miter gear.
Limitations and further work. The current miter gear study focused on S110, S170, and S230 shots. Micro-shot peening with much smaller shots was not deeply investigated, although it may be useful for fine miter gear surfaces. The current model also did not couple peening with other surface strengthening processes such as rolling, grinding optimization, or heat treatment. Future work on the miter gear could combine shot peening with a finishing process to reduce roughness while preserving compressive residual stress. Another direction is to integrate sensors and digital process control into the miter gear peening system so that intensity and coverage can be monitored in real time. Such a digital miter gear process would make the strengthening operation more stable and efficient.
Conclusions. I studied the shot peening of a miter gear with a herringbone tooth arrangement made of 10CrNi2Mo3Cu2V steel. The main conclusions are as follows. First, the Johnson-Cook constitutive model fitted from Hopkinson bar tests provides an accurate material description for the miter gear. Second, the DEM-FEM model captures the non-uniform impact count and velocity distribution on the miter gear tooth surface. Third, the Almen strip model predicts peening intensity with an error below about 13\%, enabling rapid parameter screening for the miter gear. Fourth, shot velocity, diameter, hardness, and type have distinct effects on miter gear roughness and residual stress. Higher velocity increases roughness and deepens compression. Larger diameter deepens compression but reduces surface compression and increases roughness. Higher hardness increases intensity and compression depth. Fifth, the experimental validation on the actual miter gear shows that the predicted roughness and residual stress agree with measurements within about 15\%. These findings provide a practical and physically based method for selecting shot peening parameters for high-performance miter gears.