In the field of mechanical manufacturing, high-performance gears play a crucial role, often operating under high-speed and heavy-load conditions. To enhance the fatigue life and service performance of gears, the shot peening process is typically incorporated at the end of the manufacturing process. This process involves the use of high-speed projectiles to impact the surface of the parts, inducing uneven plastic deformation on the surface of the workpiece and generating residual compressive stress. A better distribution of residual stress can improve the contact fatigue strength, bending fatigue strength, and anti-scuffing ability of gears, thereby enhancing the service performance of the parts.
To accurately calculate the residual stress field on the tooth surface after shot peening, a simulation model for the shot peening process of spiral bevel gears was proposed in this study based on the coupling of the discrete element method and the finite element method. The model calculation results had an error within 10% compared to the experimental results, indicating that the model could accurately predict the distribution of residual stress on the tooth surface. Based on this model, the correlation between shot peening process parameters and the characteristics of the residual stress field was investigated using a spiral bevel gear made of AISI 9310 material. The following are the key findings:
- The shot peening process mainly affects the residual stress field within a depth of 50 μm on the surface of the gear teeth.
- When the shot peening coverage rate is 200%, changes in the diameter and speed of the shot have a relatively small impact on the surface residual compressive stress of the parts used in this study.
- When the initial speed and diameter of the shot increase, the surface residual compressive stress value of the target plate changes slightly, but the maximum residual compressive stress value and the maximum depth of the residual compressive stress on the surface layer of the target plate are significantly improved. The maximum residual compressive stress value can be increased to -1251.5 MPa, and the maximum depth of the residual compressive stress can be increased to 40 μm.
Shot Peening Process Test
Test Specimens
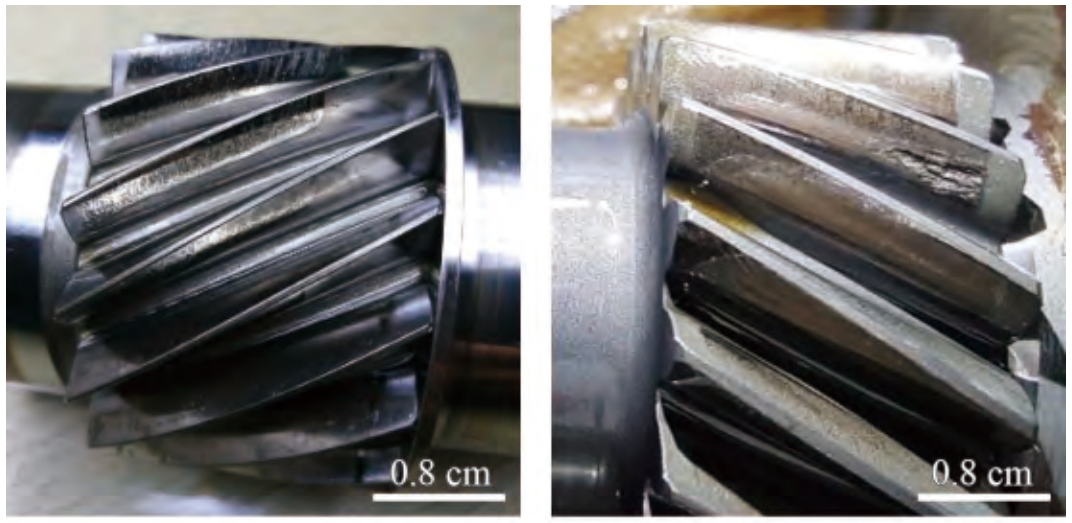
The shot peening specimens were a certain type of spiral bevel gear, made of AISI 9310 high-strength alloy steel, with the tooth part undergoing carburizing and quenching treatment. The tooth surface was an important area for shot peening reinforcement, and within a depth of 0.56 mm from the surface, the hardness was all higher than 60 HRC.
Test Parameters
The tests were carried out using the MP1000Ti model numerical control shot peening machine. The type of shot used was ASH110 (55 to 62 HRC), with a shot peening strength of 0.178 to 0.228 mmA, a coverage rate of 200%, a nozzle angle of 17°, an air pressure of 0.25 MPa, a moving speed of 70 mm/min, and a shot peening time of 144 seconds. Strengthening was performed on the tooth root, convex surface, and concave surface respectively. The nozzle was perpendicular to the target surface and at a distance of 150 mm, and the gear turntable rotational speed was 30 r/min, with a shot flow rate of 5 kg/min.
Residual Stress Measurement
Residual stress measurements were conducted on the tooth surface, and the positions of the measurement points are shown in Figure 1. Points a, b, and c were all located on the pitch cone line of the tooth surface, successively being the quarter points of the tooth width, with point a close to the large end of the gear tooth. To obtain the residual stress field on the surface layer of the gear, electrolytic polishing was performed on the gear teeth along the normal direction of the tooth surface, and the depth of electrolytic polishing was measured by a white light interferometer.
The residual stress on the tooth surface was measured using an X-ray diffractometer from the Canadian Proto company. The tube voltage was 25 kV, the tube current was 5 mA, the X-ray tube was Cr_K-Alpha, the aperture diameter was 1 mm, the wavelength was 2.291 A, the exposure time was 3 seconds, the exposure count was 7, and the maximum β angle was 20°. The test photos are shown in Figure 2. The electrolytic polishing instrument used was the 8818-V3 model electrolytic polishing machine, with a set voltage of 40 V, a flow rate of 8, a polishing time of 3 seconds, and a polishing current of 2.8 to 3 A.
Simulation Model Establishment
Due to the complex curved surface of the spiral bevel gear, the projectiles were prone to collide with each other near the tooth surface, thereby affecting the actual impact speed and frequency of the projectiles. To improve the calculation accuracy, a shot peening process simulation model was established in this paper based on the coupling of the discrete element and the finite element methods to calculate the distribution of the residual stress on the surface layer of the spiral bevel gear after shot peening. The calculation process is shown in Figure 3. A discrete element model for the shot peening of the spiral bevel gear was established to obtain the impact velocity vector and the number of impacts per unit area on the tooth surface. The discrete element calculation results were used as input, combined with the three-dimensional roughness, residual stress field before shot peening, gear and shot material models before shot peening, to establish a finite element model to calculate the residual stress field on the surface layer of the gear after shot peening, and analyze the influence of shot peening time, shot velocity, and shot diameter on the residual stress field on the tooth surface after shot peening.
Discrete Element Model
Model Establishment
The discrete element model was set up using the EDEM simulation software to simulate the process of the projectiles from the nozzle to the tooth surface.
Data Extraction and Processing
The calculation results were exported using the EDEM software, and the impact point position was determined by the unit number, and the impacts at the quarter points on the pitch cone line of the tooth surface were screened out for data processing.
(1) Impact velocity vector: Due to the curved surface of the gear, the angle between each position and the shot beam was different, and the target plate in the finite element model was a local area on the tooth surface. Therefore, it was necessary to convert the absolute velocity of the shot into the relative velocity between the tooth surface unit and the shot. As shown in Figure 5, the curved surface OABC was a certain area on the tooth surface, which was simplified to a quadrilateral OABC after being divided into meshes. Taking o as the coordinate origin, OA as the x’ axis, oc as the y’ axis, and determining the z’ axis according to the right-hand rule of the spatial coordinate system, a Cartesian coordinate system was established. The unit vectors of the coordinate axes were expressed as ox (x1, y1, z1), 1 (x2, y2, z2), and oz (x3, y3, z3) in the geodetic coordinate system. In the geodetic coordinate system, the velocity vector of the shot i was represented as vi (x, yi, zi, 0), and in the new coordinate system, it was represented as vi’ (xi’, yi’, zi’, 0). According to the principle of axis transformation, it can be obtained as follows: vi’ = vi · [x1 x2 x3 0; y1 y2 y3 0; z1 z2 z3 0; 0 0 0 1].
(2) Impact count: When the actual shot peening time was t1, the number of impacts per unit area at the target position, n0, was calculated using Equation (3): n = (n1 / S1) × (t1 / tdem), where n1 was the number of impacts that occurred between the unit and the shot, S1 was the area of the unit, and tdem was the calculation time of the EDEM model.
Finite Element Model
The finite element model was established based on the ABAQUS/CAE commercial finite element software to calculate the residual stress field on the tooth surface of the gear after shot peening.
Mesh Division and Boundary Conditions
The diameter of the shot was 0.3 mm, and the unit type was C3D8R. The size of the target plate is shown in Figure 6. Excluding the infinite element mesh, the size of the target plate was 1 mm × 1 mm × 0.5 mm, and the unit type was also C3D8R. A predefined field was set in this area, and the measured residual stress value on the tooth surface before shot peening was used as the initial residual stress of the model. Region I was used to limit the position of the shot impact center point and extract the residual stress calculation results. Region I and Region II were the mesh refinement parts, and the unit size was 10 μm × 10 μm × 10 μm. Region III was the transition area of the finite element mesh from fine to coarse. The mesh type of Region IV was the infinite element CIN3D8, which was used to eliminate the reflection of the stress wave at the boundary of the target plate.
In the model, the bottom surface of the target plate was completely fixed. The contact relationship between the shot and the target plate was Surface to Surface, the normal behavior was defined as “hard” contact, and the tangential behavior was defined as penalty friction, with a friction coefficient set at 0.2.
Material Model
The shot was set as an elastoplastic body, using the isotropic constitutive model, and the shot parameters were set as Young’s modulus E = 210 GPa, Poisson’s ratio μ = 0.3, density ρ = 7800 kg / m³, and yield strength σs = 1400 MPa. The target material was 9310 carburized and quenched steel, and the material parameters were set as Young’s modulus E = 210 GPa, Poisson’s ratio μ = 0.3, density ρ = 7800 kg / m³, and the plastic stress-strain curve adopted the Johnson-Cook model. The basic model is shown in Equations (4) and (5), and the parameters were obtained from the Hopkinson pressure bar test, which were A = 1234.38, B = 881, C = 0.018, n = 0.238, and m = 0.686, respectively. To prevent stress wave oscillation, the damping of the target plate material was set as α = 6 × 10^6 s^-1. σ = (A + Bε^n) (1 + C ln (ε / ε0)) (1 – (T^)^m), where T = (T – Tr) / (Tmelt – Troom), A, B, n, C, and m were the material physical characteristic parameters obtained by fitting the results of the pressure bar test; A was the yield strength under the reference strain rate; B was the strain hardening coefficient; n was the strain hardening index; C was the strain rate hardening coefficient; m was the temperature softening index; ε was the test strain rate; ε0 was the reference strain rate; T was the test temperature; Tmelt was the melting point of the material (the melting point of 9310 alloy steel was 1510 °C); and Troom was the reference temperature, with a value of 25 °C.
Shot Impact Information
The shot impact angle, velocity, and count were determined by the calculation results in Section 2.1.2. According to the shot size standard of the ASH110 model, the shot was set as a spherical shape with a diameter of 0.3 mm. Considering the random distribution of the shot impact position in the actual situation, in the simulation, the Python language programming was used, and the Random function was used to generate random positions, and the shot impact center points were all within Region I shown in Figure 6.
Results and Discussion
Simulation and Experimental Results Comparison
To verify the accuracy of the simulation model, the same process parameters as the experiment were set in the established shot peening process simulation model. Figure 7 shows the measured and simulated three-dimensional morphologies of point b on the convex surface after shot peening. The three-dimensional roughness Sa value was calculated according to Equation (6), with a measured value of 0.35 μm and a simulated calculation result of 0.386 μm, with an error of 10.3%. Among them, in the x and y directions, the resolution of the simulation result was lower than the measured result, because the sampling interval of the measured data was 0.5 μm, and the mesh size of the target plate in the finite element model was 10 μm × 10 μm. Sa = (1 / n) ∑ | Zi |, where n was the number of data points, and Zi was the height value of the i-th node.
The comparison of the measured and simulated residual stress values along the direction of the tooth height on the surface of the gear teeth after shot peening is shown in Table 1. Among them, the positions of points a, b, and c were consistent with those marked in Figure 1. The results showed that the surface residual stress at each point of the gear teeth was between -800 and -880 MPa, and the calculation error was within 6%. Figure 8 shows the measured and simulated calculated residual stress distributions along the depth at point b on the convex and concave surfaces, where σx was the residual stress in the tooth width direction, and σy was the residual stress in the tooth height direction. After shot peening treatment, the change trends of the residual stresses on the convex and concave surfaces of the gear teeth were consistent, and the residual compressive stress value on the concave surface was slightly larger than that on the convex surface. Moreover, the distributions of the residual stress in the tooth width direction and the tooth height direction were similar, with a surface residual stress of approximately -800 to -850 MPa, a maximum residual compressive stress value between 1200 and 1300 MPa, and a depth of approximately 20 to 30 μm. The surface residual compressive stress and the maximum residual compressive stress values of the gear teeth were statistically analyzed, as shown in Table 2, and the errors between the measured values and the simulation results were both less than 10%, which proved that the simulation model could accurately predict the residual stress field on the surface layer of the gear teeth after shot peening of the spiral bevel gear.
Influence of Shot Peening Time
The shot peening coverage rate was affected by the shot flow rate and the shot peening time. An increase in both the shot flow rate and the shot peening time would increase the number of shot impacts and increase the shot peening coverage rate. This paper mainly studied the influence of shot peening time on the residual stress field, and the results are shown in Figure 9. Based on the method of Miao et al, the shot peening coverage rate was calculated.
Under the condition of an initial shot velocity of 40 m/s, when the shot peening time reached 72 seconds, the number of shot impacts was 360 / mm², and the shot peening coverage rate reached 98%, that is, the full coverage rate [11]. When the shot peening time was 144 seconds, the coverage rate was 200%. With the increase of the shot peening time: (1) the residual compressive stress on the target plate surface increased, and when the shot peening time reached 72 seconds, it gradually stabilized at about 800 MPa; (2) the residual compressive stress at a depth of 10 μm showed a gradually increasing trend, and it stabilized at approximately 1000 MPa after the shot peening time reached 96 seconds; (3) the residual compressive stress at a depth of 20 μm continued to increase, and after 72 seconds, the residual compressive stress at a depth of 20 μm was higher than that at a depth of 10 μm, indicating that the maximum depth of the residual compressive stress increased from 10 μm to 20 μm. This indicates that increasing the shot peening time can effectively increase the value of the residual compressive stress in the subsurface layer of the material and increase the depth of the maximum residual compressive stress layer.
Influence of Shot Velocity
It can be known from Equation (3) that the initial shot velocity was determined by the nozzle air pressure, the shot flow rate, and the shot diameter, among which the nozzle air pressure was the main factor [20]. An increase in the nozzle air pressure would significantly increase the shot velocity and improve the shot peening strength.
Referring to the test shot velocity range of Nordin et al. to set the initial shot velocity, the residual stress calculation results are shown in Figure 10, and the cloud diagram is shown in Figure 11. The results showed that when the shot velocity increased from 30 m/s to 40 m/s and 50 m/s, the residual compressive stress induced by shot peening increased, and the change in the surface residual compressive stress value was small, with the maximum residual compressive stress values being -1104.7 MPa, -1144.9 MPa, and -1167.3 MPa, respectively, and the maximum depths of the residual compressive stress being 20 μm, 25 μm, and 30 μm, respectively. The results indicate that with the increase in the shot velocity, the change in the surface residual compressive stress value of the target plate is not significant, but the maximum residual compressive stress value and the maximum depth of the residual compressive stress will continuously increase.