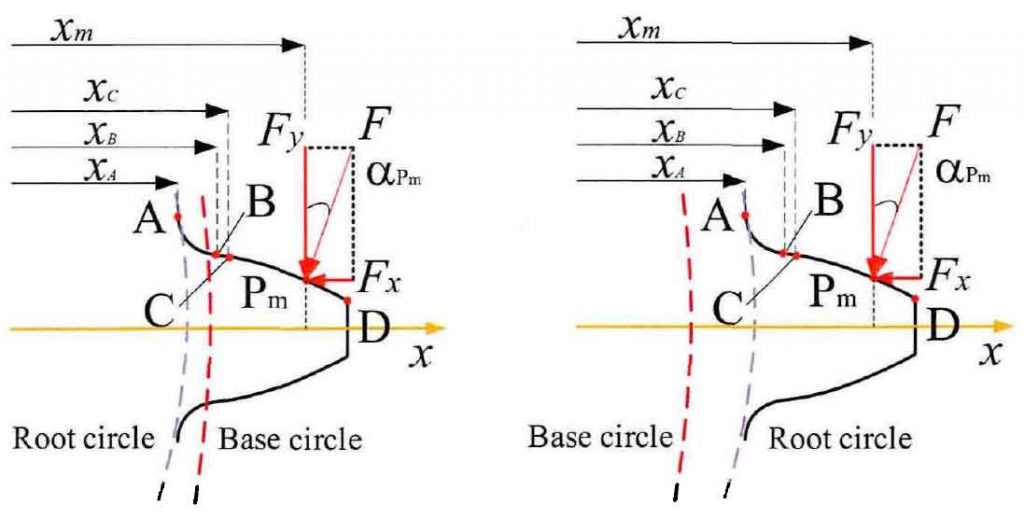
(b) The base circle is smaller than the root circle
The gear pair parameters are selected for tooth stiffness simulation analysis. The selected gear pair parameters cover two different tooth geometric forms shown in Figure 1. The numerical calculation method is used to calculate the tooth stiffness of the selected example parameters.
From the tooth stiffness curve of gear pair 1 drawn in Fig. 2, it can be seen that in the process of meshing from B2 point to B1 point along the meshing action area, the axial stiffness (Fig. 2 (a)), shear stiffness (Fig. 2 (b)) and bending stiffness (Fig. 2 (c)), the driving gear stiffness presents a nonlinear decreasing trend, while the driven gear presents a nonlinear increasing trend. The changing trend of the stiffness curve reflects the nonlinear decreasing trend of the three stiffness curves along the tooth root meshing point C to the tooth top meshing point D in the tooth profile model. According to the comparison of the three stiffness values under the gear pair 1 parameter, it can be seen that the anti compression stiffness value is the largest, while the anti shear stiffness value is smaller, and the bending stiffness is in the middle, and the difference between the axial stiffness and bending stiffness is relatively large, while the difference between the shear stiffness is relatively small. In Fig. 2 (d), it can be seen that the single tooth stiffness formed by the superposition of the three stiffness series also shows a downward trend of the driving gear and an upward trend of the driven gear. The meshing stiffness of a pair of teeth from meshing in to meshing out is shown in Figure 2 (E) without considering the co-existence of two pairs of teeth. It can be seen from the figure that the meshing stiffness of a pair of teeth first increases and then decreases. The magnitude of the combined meshing stiffness of a single pair of gear teeth is smaller than that of its component stiffness, which is similar to the “barrel short plate effect”, indicating that the shear resistance of gear teeth should be improved first if the comprehensive stiffness of gear teeth is improved. In Fig. 2 (f), considering the effect of single double meshing region, the anti deformation ability of the gear teeth in the double pair meshing region of B2C and CD is greater than that in the single pair meshing region. From the stiffness variation amplitude in the figure, the stiffness series basically maintains at 1000000000 level, which is related to the material properties and geometric dimensions of the gear. Whether in the single pair or double pair meshing area, the stiffness values show a convex curve change, that is, the change trend first increases and then decreases, which further shows the nonlinear effect of tooth stiffness change.
Similarly, the tooth stiffness of gear pair 2 and gear pair 3 is shown in Fig. 3, and their comprehensive stiffness change effect and time-varying stiffness effect are consistent with that of gear pair 1. However, due to the different parameters of the three pairs of gear pairs, their meshing line and meshing angle range are inconsistent.


