
In mechanical engineering, gear transmission stands as one of the most widely utilized forms of power transmission, particularly in applications requiring precise motion control and torque conversion. As an engineer, I have often encountered the challenges associated with traditional computational methods for gear design, which frequently fail to accurately capture the true stress and strain distribution patterns due to the complex geometry of gears. This limitation can lead to over-design or potential failures in practical scenarios. To address this, I turned to modern computer-aided engineering tools, specifically SolidWorks, to perform a detailed finite element analysis (FEA) on a pair of spur and pinion gears. This article documents my firsthand experience in modeling these gears using two distinct approaches—a combined CAXA and SolidWorks method and a formula-driven curve method—and subsequently conducting a static strength analysis to evaluate their performance under operational loads. The focus is on ensuring accuracy in modeling while leveraging FEA to derive insights that traditional calculations might miss, all centered around the spur and pinion gear system commonly found in machine tool spindle boxes.
The importance of gears in machinery cannot be overstated; they are critical components in everything from automotive transmissions to industrial equipment. However, the intricate shape of gear teeth, especially in spur gears, introduces stress concentrations that are difficult to predict analytically. In my work, I aimed to overcome this by employing SolidWorks, a powerful 3D CAD and simulation software, to model and analyze a spur and pinion gear pair. The gears in question are typical of those used in lathe spindle boxes, where reliability and efficiency are paramount. By using FEA, I sought to visualize stress and strain distributions, thereby validating the design against material limits. This process not only enhances design confidence but also aligns with industry trends toward digital prototyping and simulation-driven development.
Before diving into the analysis, it is essential to establish accurate 3D models of the spur and pinion gears. Inaccuracies in geometry can lead to erroneous FEA results, so I prioritized precise modeling techniques. I explored two methods: first, a collaborative approach using CAXA for 2D gear profile generation and SolidWorks for 3D extrusion; second, a direct method within SolidWorks utilizing parametric equations for gear tooth generation. Both methods aim to create faithful representations of the spur and pinion gear teeth, which are based on standard involute profiles. The choice of method often depends on available software and user preference, but as I will show, both can yield models suitable for advanced analysis.
To provide context, the specific spur and pinion gear pair I analyzed has parameters detailed in Table 1. These parameters are fundamental to the modeling process, as they define the gear geometry and material properties. The spur gear, often referred to as the larger gear in this pair, and the pinion gear, the smaller one, interact to transmit motion and force. Understanding these parameters is crucial for both modeling and subsequent load calculations in FEA.
| Gear Name | Module (mm) | Pressure Angle (°) | Tooth Width (mm) | Elastic Modulus (MPa) | Poisson’s Ratio |
|---|---|---|---|---|---|
| Spur Gear (Large) | 3 | 20 | 25 | 2.1 × 10⁵ | 0.28 |
| Pinion Gear (Small) | 3 | 20 | 20 | 2.1 × 10⁵ | 0.28 |
The first modeling method I employed involves using CAXA, a 2D drafting software, in conjunction with SolidWorks. This approach is advantageous when starting from a 2D gear profile, as CAXA has built-in functions for generating involute gear shapes. For the spur gear, I input the parameters from Table 1 into CAXA’s gear drawing tool, which produced a precise 2D tooth profile. I saved this profile as a DWG file (e.g., clk.dwg) and then imported it into SolidWorks as a new part file. In SolidWorks, I extruded the 2D sketch to a depth of 25 mm, matching the tooth width of the spur gear. Subsequently, I added features such as the shaft hole and keyway to complete the 3D model. This method is relatively straightforward and leverages the strengths of both software packages, ensuring that the spur gear’s geometry adheres to standard involute principles. The resulting model is accurate enough for FEA, as it captures the essential tooth form without manual curve fitting.
The second modeling method relies entirely on SolidWorks and uses parametric equations to define the involute tooth profile. This approach offers more control and is ideal for users who prefer to work within a single software environment. For the pinion gear, I started by deriving the parametric equations for an involute curve. As illustrated in gear theory, an involute is generated by unwrapping a taut string from a base circle. The coordinates (x, y) of any point on the involute can be expressed as:
$$ x = R_b \cos \theta + R_b \theta \sin \theta $$
$$ y = R_b \sin \theta – R_b \theta \cos \theta $$
where \( R_b \) is the base circle radius and \( \theta \) is the angle in radians. For a standard spur or pinion gear, the base radius relates to the module and pressure angle. Specifically, \( R_b = \frac{m Z \cos \alpha}{2} \), where \( m \) is the module, \( Z \) is the number of teeth, and \( \alpha \) is the pressure angle. In my case, for the pinion gear with 43 teeth, module 3 mm, and pressure angle 20°, the base radius calculates to approximately 60.61 mm. I used these equations in SolidWorks’ “Equation Driven Curve” tool, setting \( \theta \) to range from 0 to \( \pi/2 \) to capture a sufficient portion of the involute for one tooth. After sketching the root circle and extruding it to 20 mm, I added the involute curve, along with the tip and root circles, to form a single tooth profile. This profile was then extruded, and a circular pattern was applied to create all teeth. Finally, I added the shaft hole and keyway features. This method, while more mathematically intensive, yields a highly precise model of the pinion gear, suitable for detailed analysis.
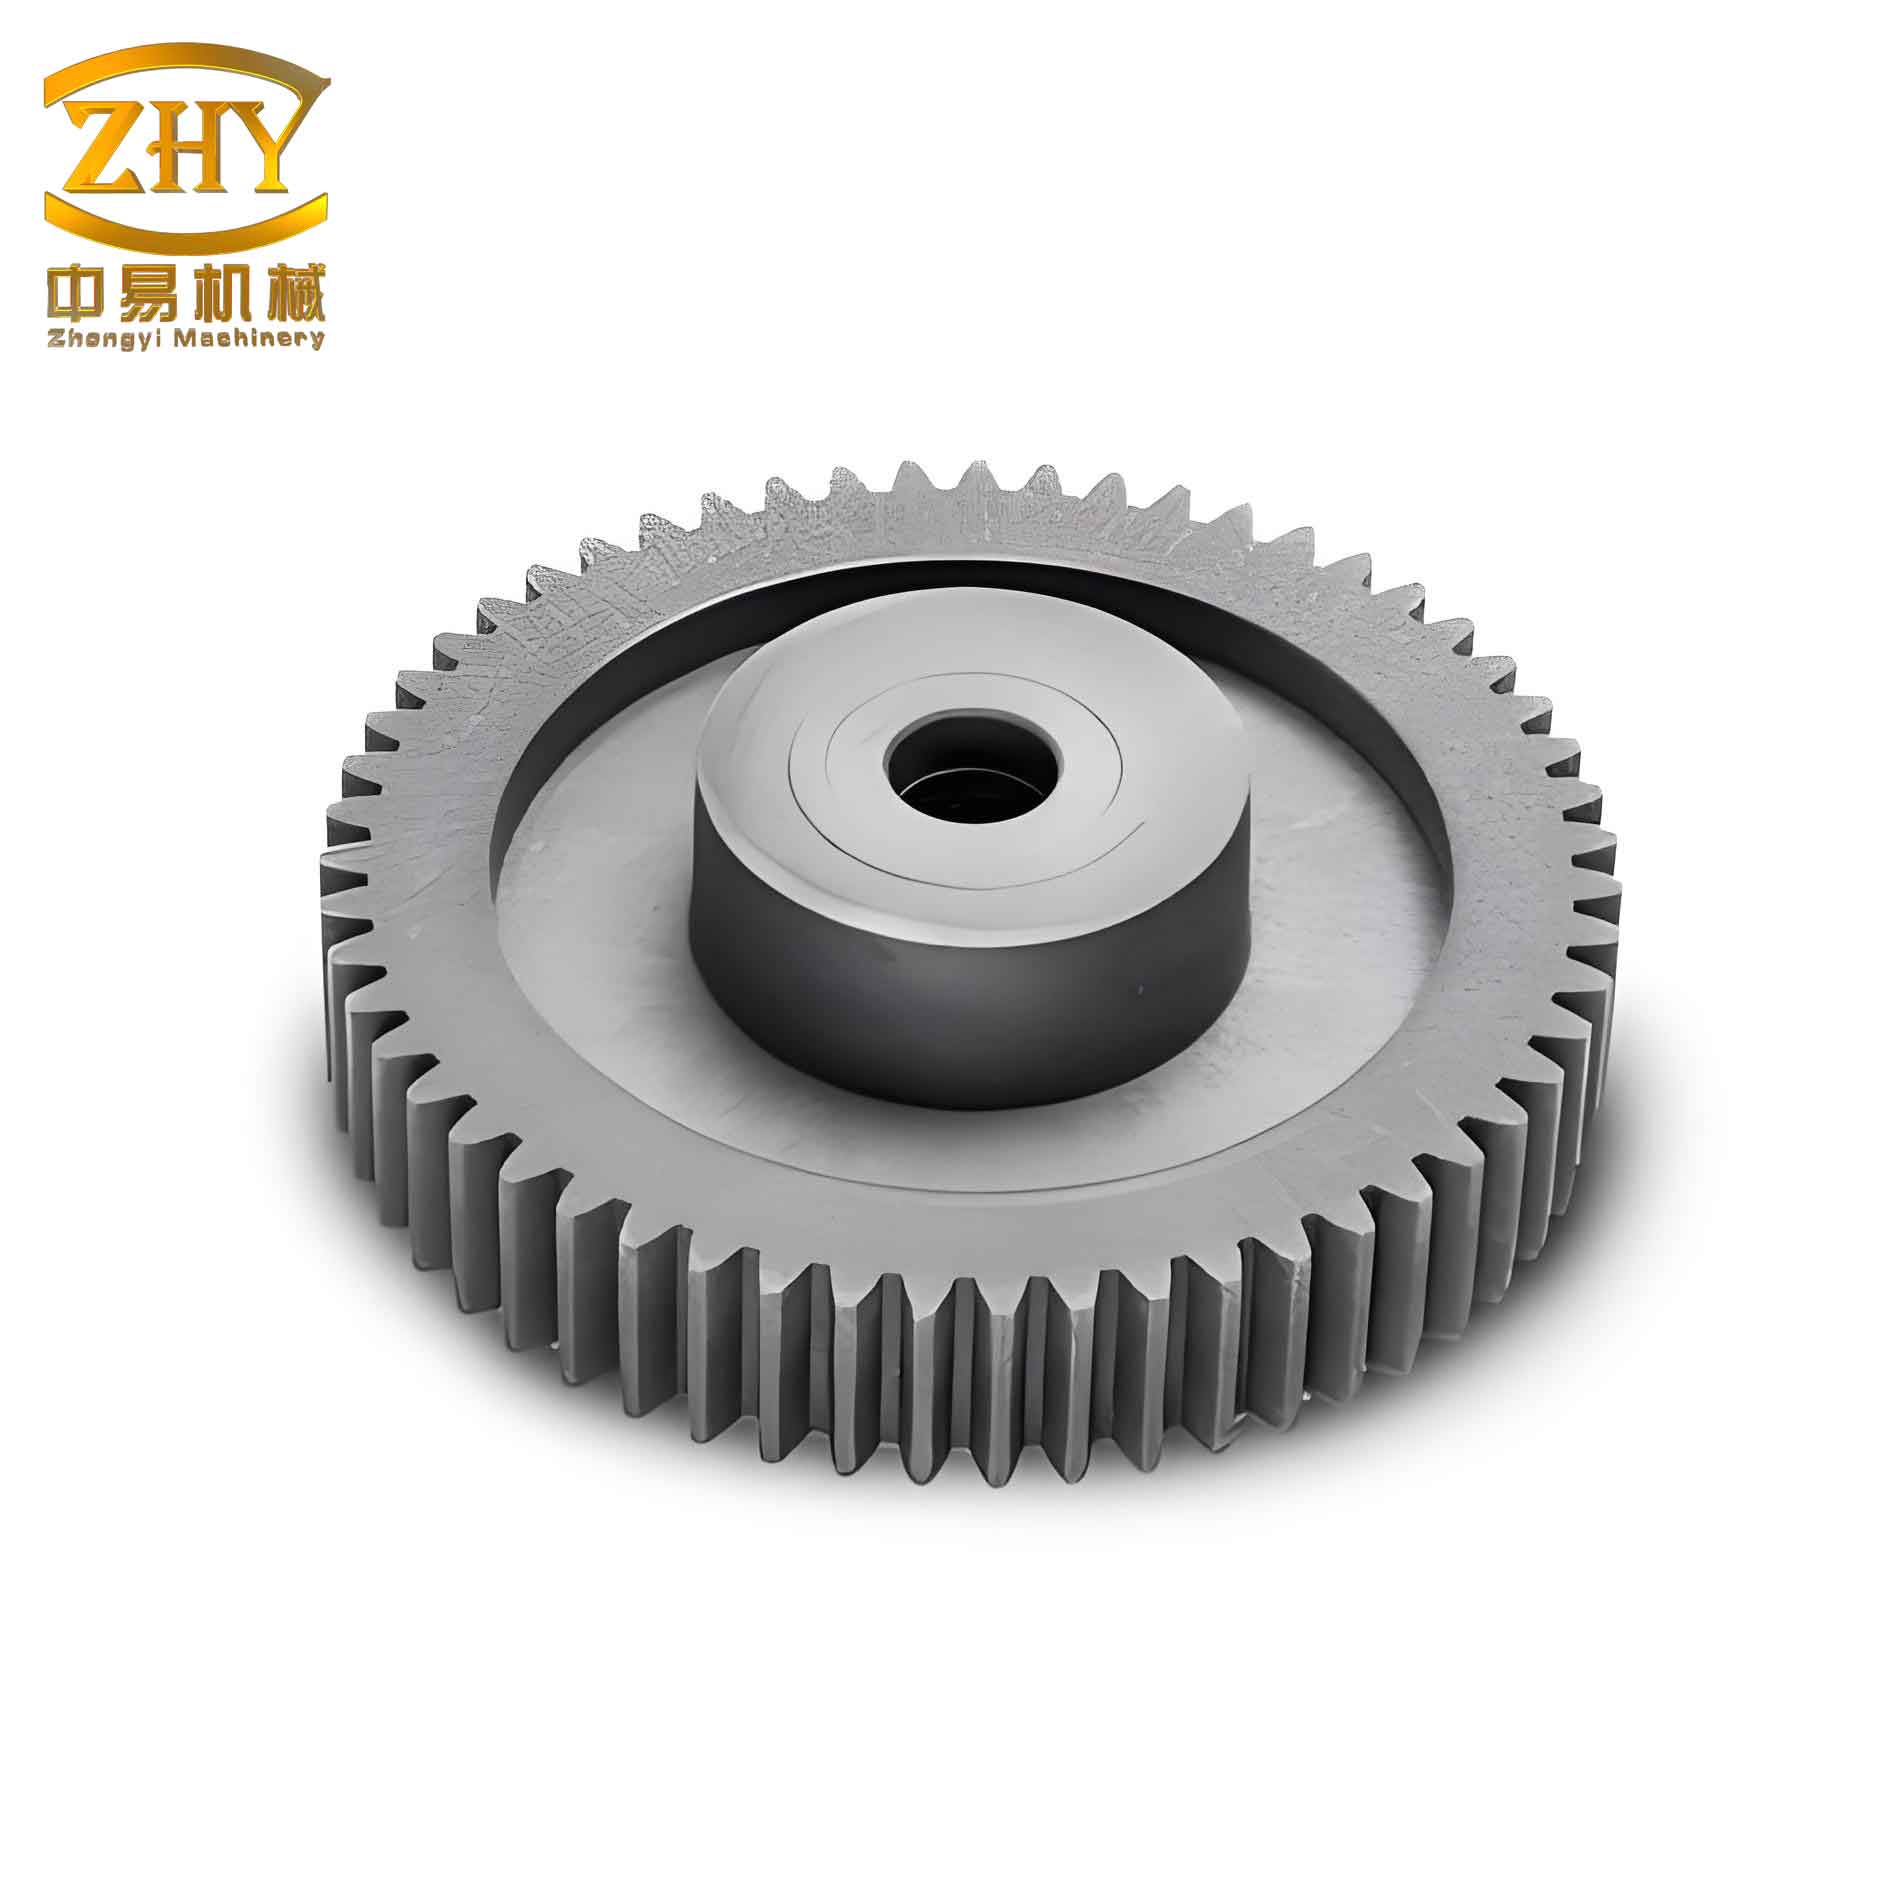
Comparing the two methods, the CAXA-SolidWorks approach is quicker for those familiar with 2D drafting, while the formula-driven method offers deeper insights into gear geometry. Both methods effectively produce 3D models of spur and pinion gears that can be used in subsequent simulations. To visualize the outcome of such modeling, consider the following representation of a spur and pinion gear pair, which highlights the meshing interaction critical to transmission systems.
With individual gear models ready, the next step in my analysis was to assemble them into a mating pair within SolidWorks. This assembly mimics the real-world interaction between the spur and pinion gears, allowing for accurate load application in FEA. I created a new assembly file and imported both the spur gear and pinion gear parts. To ensure proper meshing, I applied several mate constraints: first, I fixed the spur gear’s axis at the origin of the assembly coordinate system and aligned its front plane with the assembly’s front plane. Second, I positioned the pinion gear’s axis parallel to the spur gear’s axis, with a center distance calculated as \( \frac{m (Z_1 + Z_2)}{2} = 141 \) mm, based on the gear parameters. I also aligned the pinion’s front plane with the spur gear’s front plane and constrained the pinion’s axis to lie on the assembly’s top plane. Finally, I adjusted the angular orientation so that a tooth space on the pinion gear symmetrically engaged with a tooth on the spur gear. This careful assembly ensures that the gears are correctly positioned for analysis, reflecting typical operational conditions where the spur and pinion gear transmit torque smoothly.
Once the assembly was complete, I proceeded to the finite element analysis phase, focusing on the pinion gear for static strength evaluation. The pinion gear is often the more critical component due to its smaller size and higher stress concentrations. In this analysis, I assumed operating conditions typical of a lathe spindle box: a rotational speed of 300 rpm and a transmitted power of 4 kW. These values allow for the calculation of loads acting on the pinion gear teeth during meshing. The primary objective was to determine the stress and displacement distributions under these loads, using FEA within SolidWorks Simulation.
The first step in FEA is defining boundary conditions and applying loads. For the pinion gear, I fixed its inner bore, restricting all translational and rotational degrees of freedom (i.e., setting displacements and rotations to zero along X, Y, and Z axes). This simulates the gear being mounted on a shaft that is rigidly supported. The load application is more nuanced, as gears experience a normal force \( F_n \) along the line of action during meshing. To simplify this for FEA, I decomposed \( F_n \) at the tooth tip into tangential (circumferential) and radial components. The tangential force \( F_t \) is responsible for torque transmission, while the radial force \( F_r \) arises from the pressure angle. The calculations are as follows:
$$ T = 9.55 \times 10^6 \times \frac{P}{n} $$
where \( T \) is the torque in N·mm, \( P \) is power in kW, and \( n \) is speed in rpm. Substituting the values:
$$ T = 9.55 \times 10^6 \times \frac{4}{300} = 127,333.33 \, \text{N·mm} $$
The tangential force is then:
$$ F_t = \frac{2T}{D} $$
with \( D \) being the pitch diameter. For the pinion gear, \( D = m Z = 3 \times 43 = 129 \) mm. Thus:
$$ F_t = \frac{2 \times 127,333.33}{129} \approx 1974.16 \, \text{N} $$
The radial force is:
$$ F_r = F_t \tan \alpha $$
Given \( \alpha = 20^\circ \):
$$ F_r = 1974.16 \times \tan 20^\circ \approx 718.71 \, \text{N} $$
For conservatism in analysis, I applied these forces at the tooth tip of the pinion gear, simulating a worst-case scenario where stress concentrations are highest. This approach ensures that the spur and pinion gear analysis accounts for potential overloads.
Next, I assigned material properties to the pinion gear. Both gears are made of 45 steel, a common choice for mechanical components due to its balance of strength and machinability. The material properties, as listed in Table 1, include an elastic modulus \( E = 2.1 \times 10^5 \) MPa and a Poisson’s ratio \( \nu = 0.28 \). These values are critical for FEA, as they define how the material deforms under stress. I input these into SolidWorks Simulation, ensuring consistency with real-world conditions.
Mesh generation is a crucial step in FEA, as it discretizes the 3D model into finite elements for numerical solution. I opted for a high-quality mesh with tetrahedral elements, which are well-suited for complex geometries like gear teeth. The mesh settings were refined to capture details in the tooth root and fillet areas, where stresses tend to concentrate. After meshing, the model comprised 55,393 elements and 83,604 nodes, providing a fine resolution for accurate results. Table 2 summarizes the mesh statistics and material data for reference.
| Aspect | Value |
|---|---|
| Material | 45 Steel |
| Elastic Modulus (E) | 2.1 × 10⁵ MPa |
| Poisson’s Ratio (ν) | 0.28 |
| Mesh Type | Tetrahedral |
| Number of Elements | 55,393 |
| Number of Nodes | 83,604 |
| Applied Tangential Force (Ft) | 1974.16 N |
| Applied Radial Force (Fr) | 718.71 N |
With the setup complete, I ran the static analysis in SolidWorks Simulation. The results provide valuable insights into the stress and displacement behavior of the pinion gear. The von Mises stress distribution, a common metric for ductile materials like steel, shows the maximum stress occurring at the tooth root edge, with a value of approximately 84.54 MPa. This is expected, as gear teeth experience bending stresses that peak at the root due to the cantilever effect. The displacement results indicate a maximum deformation of about 7.13 × 10⁻³ mm at the tooth tip, which is negligible for most engineering applications. To put these numbers in perspective, the yield strength of 45 steel is typically around 220 MPa, meaning the maximum stress is well within the elastic limit. This suggests that the pinion gear, and by extension the spur gear, is safe under the given operating conditions.
To further interpret the results, I analyzed the stress patterns across the gear teeth. The von Mises stress contour reveals that stresses are highest at the root but gradually decrease toward the tooth tip and flank. This pattern aligns with theoretical expectations for spur and pinion gears under load. The displacement plot shows that deformations are minimal and symmetric, indicating stable meshing without excessive deflection. These findings reinforce the reliability of the gear design and validate the modeling approach. For a quantitative summary, Table 3 lists key results from the FEA.
| Parameter | Value |
|---|---|
| Maximum von Mises Stress | 84.54 MPa |
| Location of Maximum Stress | Tooth Root Edge |
| Maximum Displacement | 7.13 × 10⁻³ mm |
| Location of Maximum Displacement | Tooth Tip Edge |
| Material Yield Strength | 220 MPa (approx.) |
| Safety Factor (based on yield) | 2.6 (approx.) |
The safety factor, calculated as the ratio of yield strength to maximum stress, is about 2.6, indicating a robust design for the spur and pinion gear pair. However, it’s important to note that FEA provides a static snapshot; in dynamic operations, factors like fatigue, shock loads, and wear could affect performance. Therefore, while this analysis offers confidence, additional studies such as dynamic analysis or fatigue testing might be warranted for critical applications.
Beyond the specific results, this exercise highlights the broader advantages of using SolidWorks for gear analysis. The software integrates modeling and simulation seamlessly, allowing for iterative design improvements. For instance, if the stress had exceeded limits, I could easily modify gear parameters (e.g., tooth width or fillet radius) and re-run the analysis. This capability is invaluable for optimizing spur and pinion gear designs for weight reduction, cost efficiency, or performance enhancement. Moreover, the use of parametric equations enables quick adjustments to gear geometry, facilitating exploration of different module sizes or pressure angles.
In reflecting on the modeling methods, both the CAXA-SolidWorks approach and the formula-driven method proved effective. The former is efficient for users with access to 2D gear libraries, while the latter offers greater flexibility for custom gear profiles. For spur and pinion gears with standard involute teeth, either method suffices, but the formula-driven approach may be preferable for non-standard gears or when high precision is required. In my experience, combining these methods with FEA creates a powerful workflow for gear design and validation.
To extend the analysis, one could consider thermal effects, lubrication, or multi-tooth contact scenarios. For example, in high-speed applications, gear teeth generate heat due to friction, which can alter material properties and stress distributions. SolidWorks Simulation includes thermal analysis modules that could be coupled with structural analysis for a more comprehensive assessment. Additionally, analyzing the spur gear alongside the pinion gear would provide a complete picture of the gear pair’s behavior, though the pinion is often the limiting component due to its smaller size.
In conclusion, this project demonstrates the practical application of SolidWorks for modeling and analyzing spur and pinion gears. By employing two distinct modeling techniques and conducting a detailed finite element analysis, I was able to verify the structural integrity of a pinion gear under typical loads. The results show that the gear operates within safe stress limits, with maximum von Mises stress at 84.54 MPa and minimal displacement. This approach not only validates the design but also underscores the value of simulation in modern engineering. For designers working with spur and pinion gears, tools like SolidWorks offer a efficient pathway from concept to validation, reducing reliance on physical prototypes and accelerating development cycles. As gear systems continue to evolve in complexity and demand, such digital methodologies will become increasingly indispensable for ensuring reliability and performance.