
Under the action of cyclic load, cracks begin to appear and grow, and the remaining life of the sample is also decreasing. When the applied load is higher than the bearing capacity of the specimen, the specimen will undergo fatigue fracture. The number of cycles and crack length test data continuously recorded by the extensometer clamped on the sample under different stress ratios are plotted in origin software. The relationship between the two groups of data is shown in the figure.
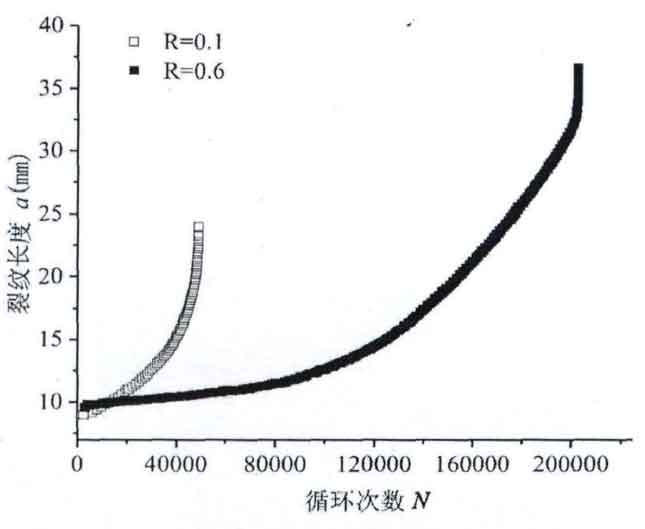
At the formal beginning of cyclic loading, the crack length tends to increase when the stress ratio is 0.1 and 0.6. When the stress ratio is 0.1, the crack length increases faster with the increase of the number of cycles, and the number of cycles is less under the same crack length. The crack length increases sharply when the number of cycles reaches about 50000, and the data acquisition point disappears, which proves that the fatigue failure of the specimen occurs at this time. According to the test data, the fatigue life of the specimen is 48913 cycles, and the crack length at this time α= 24.05mm; When the stress ratio becomes 0.6 under the same other conditions, the growth rate of crack length is slow. To reach the same stress ratio r = 0.1 and the same crack length, the number of cycles is more. When the number of cycles is 80000 times, the crack hardly expands. After 80000 times, the crack presents the growth form of positive proportional function. When the number of cycles is about 200000, When the number of cycles continues to accumulate, the crack length increases rapidly, resulting in the failure of the sample. According to the test data, the fatigue life of the specimen is 203587 cycles, and the crack length at this time α= 35.94mm。 Due to the different stress ratio, the crack length of the two curves is different with the increase of the number of cycles, but the development trend of the two curves is the same.