
In this thesis, I focus on the measurement and evaluation method of symmetry error of herringbone gear from the perspective of service performance. The herringbone gear, also known as double helical gear, is widely used in marine propulsion, aerospace and other large power equipment because of its high load-carrying capacity and low axial load. However, due to manufacturing errors, the tooth surfaces on the left and right helical sides are not perfectly symmetric about the central plane, which leads to uneven load distribution, axial vibration, noise and reduced service life. Therefore, it is of great significance to accurately measure and evaluate the symmetry error of herringbone gear. In this work, I first define the contact line of the herringbone gear and its symmetry error. Then, I establish a mathematical model of the contact line and propose an evaluation method based on least-squares fitting. I also develop a measurement principle and a software program implemented on a CNC gear measuring machine. Finally, I conduct experiments on two gears with different moduli and compare the proposed contact-line method with the cross-section method. The results show that the proposed method provides higher precision and stability, although it is more time-consuming. I also present the measurement uncertainty analysis to validate the effectiveness.
1. Introduction
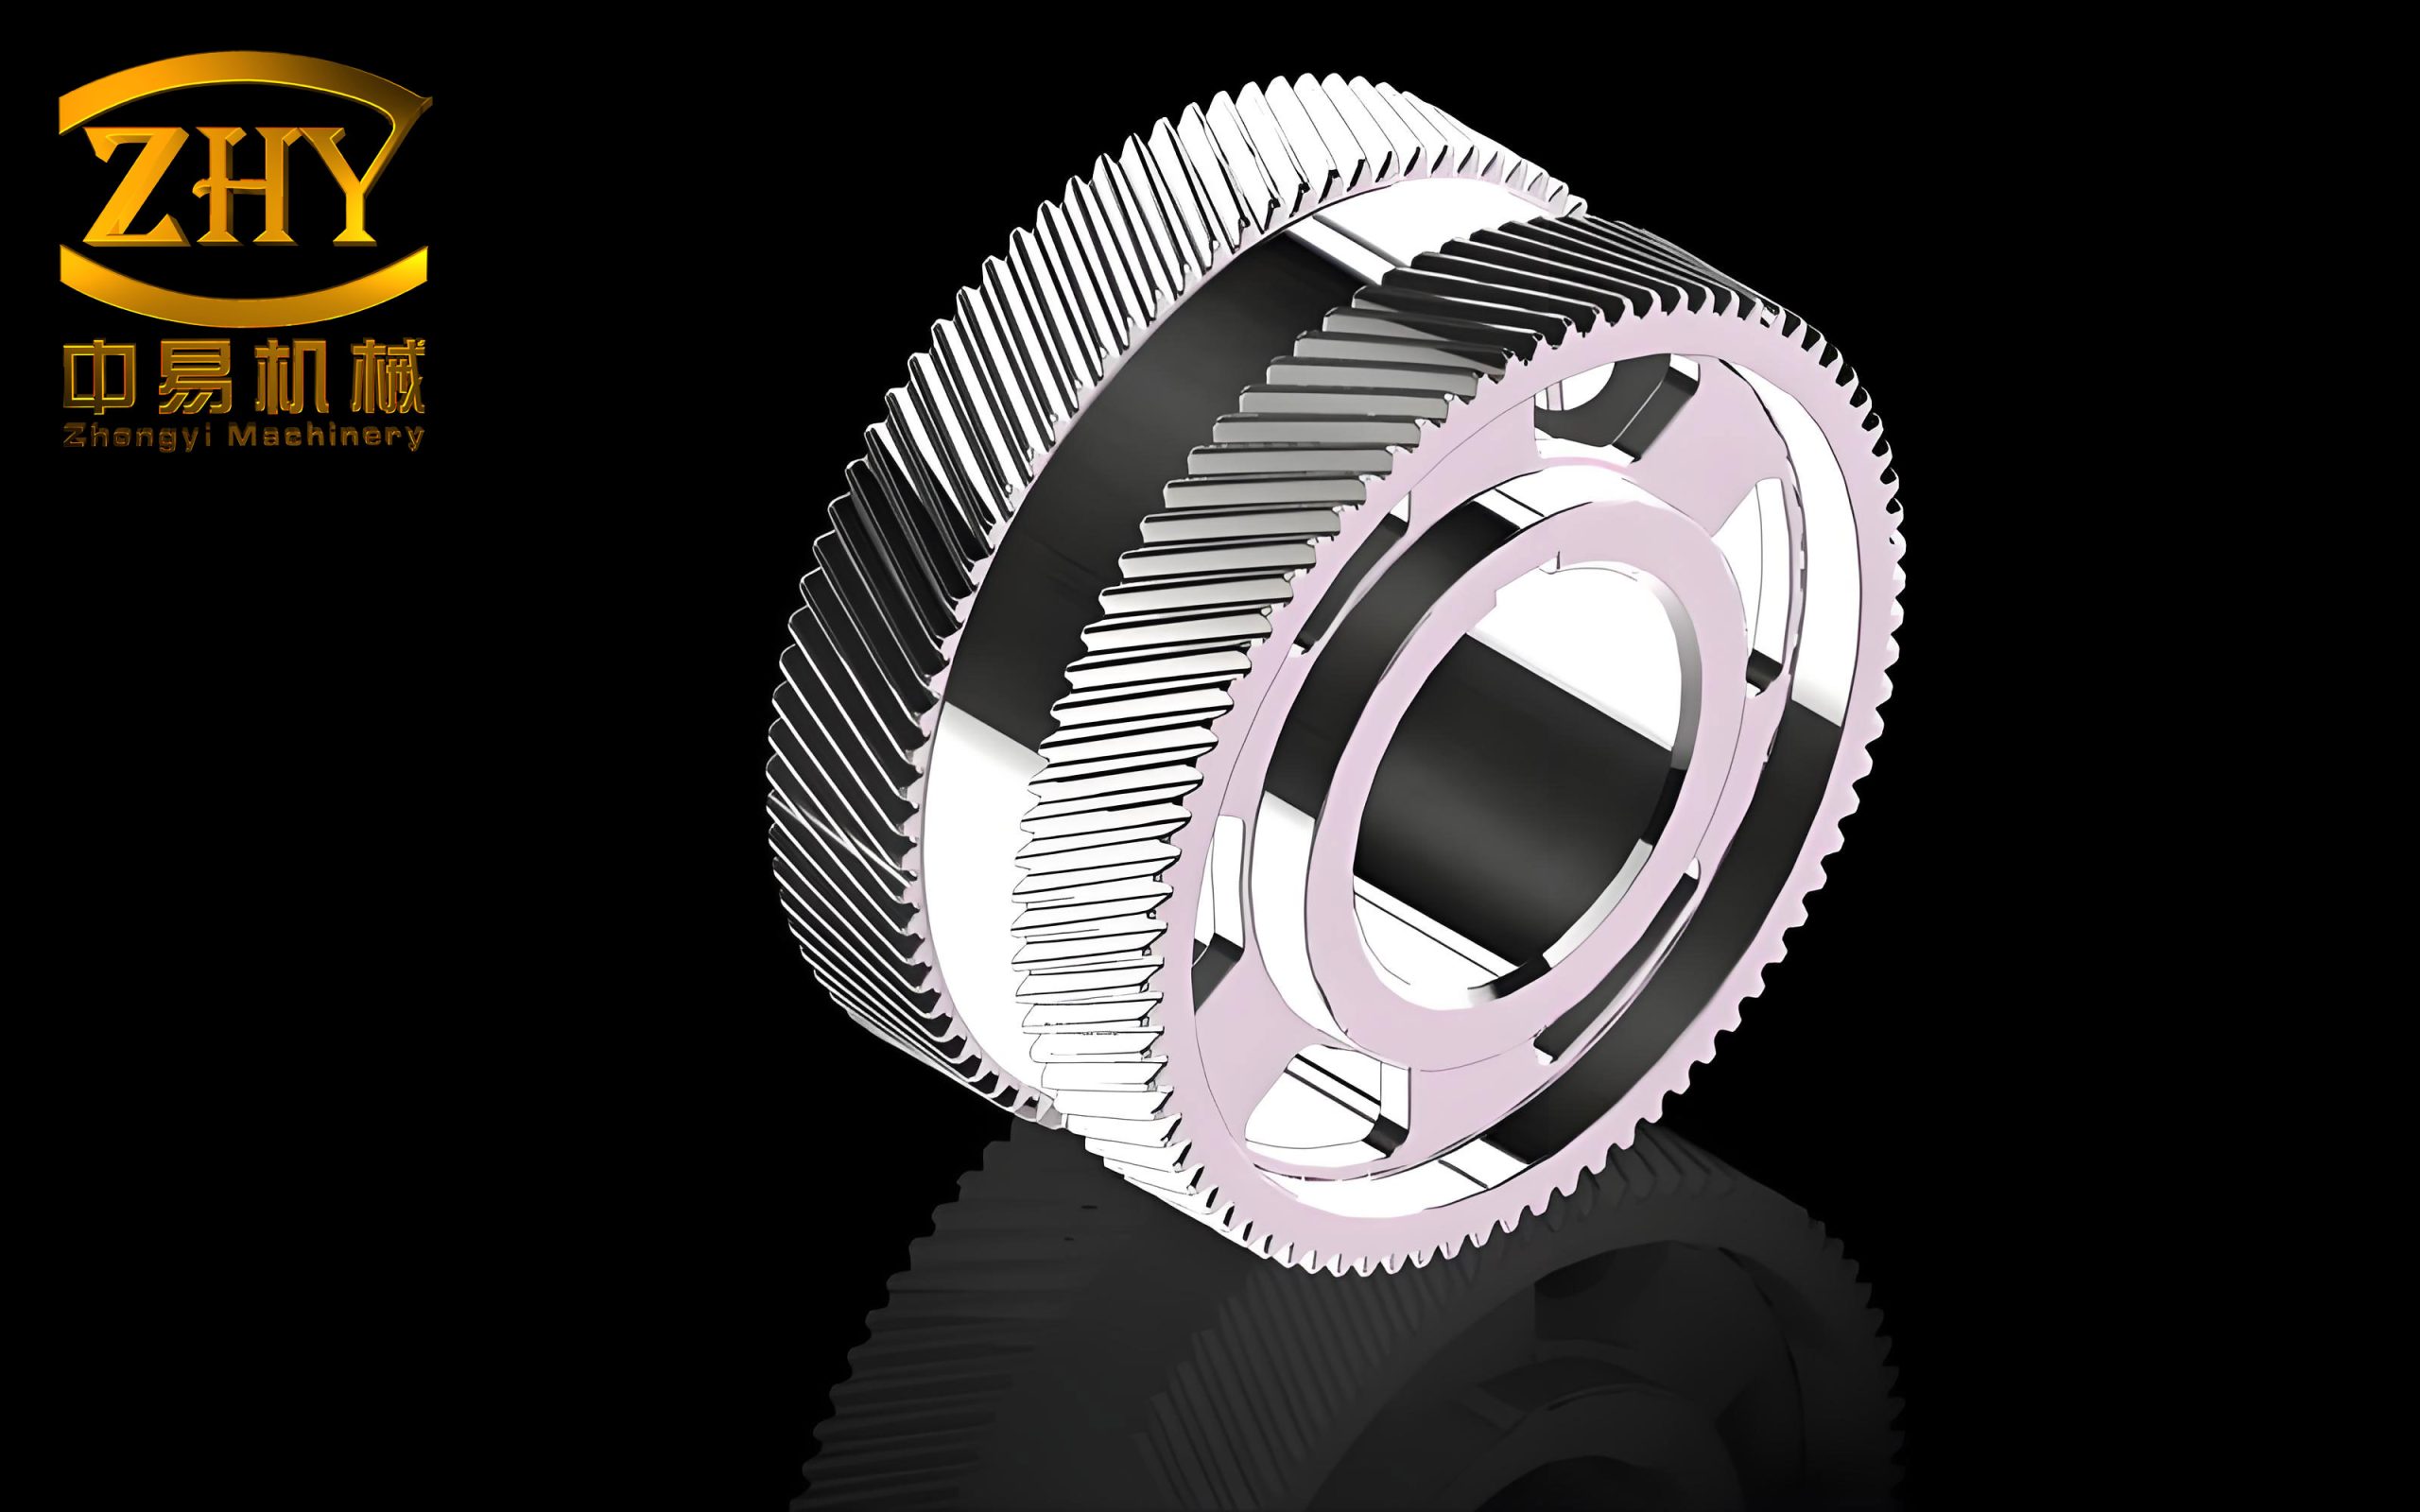
Herringbone gears are essentially two helical gears of opposite hand rigidly connected together. This configuration cancels the axial thrust produced by each helical half, making the gear very attractive in heavy-duty and high-speed transmission systems. Nevertheless, the two helical halves must be precisely aligned at the center plane. If the left-handed and right-handed teeth are not perfectly symmetrical about the gear center plane, the contact forces on the two halves will differ. This asymmetry generates an undesired axial force and results in axial vibration, noise and non-uniform load sharing. Therefore, the symmetry performance of a herringbone gear directly influences its transmission quality and service life.
Traditional measurement standards for cylindrical gears treat each helical half of a herringbone gear independently. The symmetry between the two halves, however, cannot be evaluated by simply applying the standard helical gear tolerances. Several studies have focused on the dynamic response of herringbone gear systems with misalignment, while other works proposed methods to control the symmetry during manufacturing, such as measuring the intersection point of the tooth flanks or using on-machine probing. Nevertheless, few methods have been developed to measure the symmetry error of the actual tooth contact lines, which are the lines instantaneously in contact during meshing and thus directly related to the service performance.
From the viewpoint of service performance, the contact lines of the same-side tooth flanks on the two helical halves should intersect on the gear center plane. If the intersection point is shifted along the gear axis, then the gear will experience axial moving when meshing. Thus, I define the symmetry error of the herringbone gear as the axial distance from the intersection point to the gear center plane. The aim of this thesis is to propose a complete measuring and evaluating method for this error based on the contact lines.
The rest of this thesis is organized as follows. In Section 2, I give the definitions of the contact line and the symmetry error. Section 3 presents the theoretical evaluation method using a mathematical model and least-squares fitting. Section 4 describes the measurement principle on a gear measuring machine. Section 5 explains the design of the measurement software. Section 6 reports the experimental results and uncertainty analysis. Section 7 concludes the work.
2. Definitions of Contact Line and Symmetry Error
For an ideal helical gear, the instantaneous contact line between two meshing teeth lies in the plane tangent to the base cylinder and makes an angle equal to the base helix angle with the gear axis. Since a herringbone gear is composed of two helical gears of opposite hands, each tooth has two contact lines on the same-side flank (the left-hand side and the right-hand side). Figure 1 illustrates the contact lines on a herringbone gear, where \(r_b\) is the base radius and \(\beta_b\) is the base helix angle.
Definition of the contact line: For a herringbone gear, the contact line of a single tooth flank is the intersection line between that flank and the plane tangent to the base cylinder. For one tooth, the left-handed flank and the right-handed flank have two contact lines, which are straight lines mirror-symmetric about the gear center plane when the gear is ideal.
Symmetry error of a single tooth: The extensions of the two opposite-handed contact lines on the same-side flank intersect at point \(A_i\) for the \(i\)-th tooth. The distance along the gear axis from \(A_i\) to the gear center plane is defined as the single-tooth symmetry error, denoted \(f_{Ai}\). A positive value indicates that the intersection is located on one side of the center plane, while a negative value indicates the opposite side.
Based on this fundamental definition, I also introduce the following derived parameters:
- \(f_{Au}\): the maximum absolute difference of the symmetry errors between adjacent teeth, which reflects the short-range variation and causes local load unevenness.
- \(F_A\): the total symmetry error, obtained as the maximum difference among all teeth, which affects long-period axial vibration.
- \(f_{As}\): the average of all single-tooth symmetry errors, which indicates the systematic axial offset of the gear.
These parameters provide a complete characterization of the symmetry quality from a functional viewpoint. In the next section I present the evaluation algorithm.
3. Theoretical Evaluation Method
3.1 Mathematical Model of Contact Lines
I establish a Cartesian coordinate system to describe the contact lines. As shown in Figure 2, the origin \(O\) is placed at the intersection of the gear axis and the center plane. The \(Z\)-axis coincides with the gear axis, while the \(T\)-axis lies in the plane tangent to the base cylinder and is perpendicular to the \(Z\)-axis. The \(R\)-axis is normal to the tangent plane. Within the tangent plane \(TOZ\), the contact lines can be represented as straight lines.
For the left-handed tooth, the contact line equation is:
\[
Z’ = k_L T’ + b_L
\tag{1}
\]
where \(T’\) and \(Z’\) are the coordinates in the tangent plane, \(k_L\) and \(b_L\) are respectively the slope and intercept. For the right-handed tooth:
\[
Z’ = k_R T’ + b_R
\tag{2}
\]
The slopes are:
\[
k_L = \tan\bigl(90^\circ – \beta_b\bigr)
\tag{3}
\]
\[
k_R = -\tan\bigl(90^\circ – \beta_b\bigr)
\tag{4}
\]
where
\[
\beta_b = \tan^{-1}\!\left[ \tan\beta \cos\!\left( \tan^{-1}\!\left( \frac{\tan\alpha_n}{\cos\beta} \right) \right) \right]
\tag{5}
\]
Here, \(\alpha_n\) is the normal pressure angle and \(\beta\) is the helix angle at the pitch cylinder.
3.2 Evaluation Interval
To avoid edge effects and to focus on the effective contact zone, I choose the evaluation interval centered at the middle of each single helical gear width. The interval is set as \(\pm 0.3B\), where \(B\) is the width of one helical half. Therefore, the measured contact line is taken between \(0.5 W + 0.2 B\) and \(0.5 W + 0.8 B\), where \(W\) is the width of the central runout groove.
3.3 Discrete Measurement Points
I first obtain the theoretical contact lines. The lower end of the left-handed gear intersects the base tangent plane at point \(M\); by substituting the coordinates of \(M\) into Equation (1), I obtain the theoretical left contact line. Similarly, the right-handed contact line is obtained. Along each theoretical line, I select \(n\) points equally spaced in the \(T’\) direction. These points are called theoretical measuring points \(P_{Lj}\) and \(P_{Rj}\) for \(j=1,\dots,n\).
Due to manufacturing errors, the actual measuring points deviate from the theoretical ones in a direction normal to the theoretical contact line. I construct the actual measuring points by adding a random disturbance \(\delta_j\) along that normal direction. The actual points are denoted as \(G_{Lj}\) and \(G_{Rj}\).
3.4 Least-Squares Fitting and Error Computation
The measured data for each side are fitted by a straight line using the least-squares criterion. For the left side, I minimize:
\[
\phi(b_L,k_L)=\sum_{j=1}^{n} \left[ Z_j – (b_L + k_L T_j) \right]^2
\tag{6}
\]
Taking partial derivatives with respect to \(b_L\) and \(k_L\) and setting them to zero yields:
\[
b_L = \frac{\sum T_j^2 \sum Z_j – \sum T_j \sum T_j Z_j}{n\sum T_j^2 – (\sum T_j)^2}
\tag{7}
\]
\[
k_L = \frac{n\sum T_j Z_j – \sum T_j \sum Z_j}{n\sum T_j^2 – (\sum T_j)^2}
\tag{8}
\]
Similarly, I obtain \(b_R\) and \(k_R\) for the right side. Thus, the fitted lines are obtained.
The intersection point \(A(T,Z)\) of the two fitted lines is found by solving the two line equations. The symmetry error for that tooth is simply:
\[
f_A = Z
\tag{9}
\]
where \(Z\) is the axial coordinate of the intersection point relative to the gear center plane.
3.5 Example Verification
To validate the proposed method, I applied it to an actual herringbone gear with parameters given in Table 1. I selected two teeth separated by 120° (tooth No.1 and tooth No.10). On each tooth, I generated 41 theoretical points and added random errors corresponding to the actual errors measured by the cross-section method. The fitting procedure gave symmetry errors of \(-0.0275\,\mathrm{mm}\) and \(-0.0256\,\mathrm{mm}\) for tooth No.1 and No.10, respectively. These values agree well with the cross-section method results of \(-0.0278\,\mathrm{mm}\) and \(-0.0258\,\mathrm{mm}\). Thus, the proposed evaluation method is feasible and correct.
| Parameter | Symbol | Value |
|---|---|---|
| Normal module | \(m_n\) | 2.2 mm |
| Number of teeth | \(z\) | 27 |
| Normal pressure angle | \(\alpha_n\) | 22° |
| Helix angle | \(\beta\) | 30° |
| Single helical width | \(B\) | 30 mm |
| Runout groove width | \(b_t\) | 20 mm |
The theoretical contact lines for both selected teeth produced a zero symmetry error, which confirms the correctness of the theoretical model. The actual simulated data are given in Appendix A.
4. Measurement Principle
4.1 Measurement Machine and Coordinate System
The measurement experiments were carried out on a CNC gear measuring machine. The gear is mounted on a rotary spindle whose axis coincides with the gear axis. The machine has three linear axes: \(R\) (radial), \(T\) (tangential), and \(Z\) (axial), plus a rotary axis \(\theta\). I establish the measuring coordinate system in accordance with the evaluation coordinate system described in Section 3.1.
4.2 Axial Measurement Reference
The first step is to locate the gear center plane, which is the symmetry plane between the upper and lower end faces of the toothed portion. The measuring procedure is as follows: The probe touches the upper end face and records its \(Z\) coordinate \(Z_U\). Then the probe moves to the lower end face and records \(Z_D\). The center plane is obtained by:
\[
Z_{\mathrm{mid}} = \frac{Z_U + Z_D}{2}
\tag{10}
\]
The \(Z\)-axis is then set so that \(Z_{\mathrm{mid}}\) becomes zero. This gives an accurate axial reference for all subsequent measurements.
4.3 Contact Line Measurement Principle
For each tooth \(i\), the machine measures two contact lines located on the same-side flank: one on the left-handed helical portion and one on the right-handed helical portion. The probe travels along the theoretically expected contact line while the spindle rotates to keep the probe within the tangent plane. The machine records the \(T\) and \(Z\) coordinates at several points along each contact line. Then, using the least-squares fitting algorithm described in Section 3.4, the two lines are obtained. Their intersection point \(A_i(T_i,Z_i)\) is calculated, and the symmetry error \(f_{Ai}=Z_i\) is obtained.
For all teeth, the results are plotted as a graph where the horizontal axis represents the tooth index and the vertical axis represents the symmetry error. This graph is then used to derive \(f_{Au}\), \(F_A\), and \(f_{As}\).
5. Measurement Software
5.1 Overall Architecture
I designed and implemented a software package for the CNC gear measuring machine to automate the contact line symmetry measurement. The software consists of three main modules: parameter input, measurement reference establishment, and measurement motion control with data processing.
| Module | Function |
|---|---|
| Input parameter module | Accepts gear parameters, measurement range, tooth face selection, and speed parameters. |
| Reference establishing module | Performs zero calibration and determines the axial measurement reference. |
| Motion control module | Executes the probing sequence, records measurement data, and performs data processing. |
5.2 Library Functions
I used the machine manufacturer’s library to control the hardware. Key functions include:
StartLampOn,EndLampOnfor controlling indicator lights.IsStartHit,IsEndHitfor detecting start/end signals.motordrvfor interpolating the rotary axis and linear axes.is_motor_stopfor checking the motor status.TouchProbefor automatic probing along a specified axis.sample11for obtaining machine coordinate readings.counterwrite,counterstefor setting the coordinate origin.
5.3 Measurement Procedure
The measurement program follows the flow chart shown in Figure 3. After clearing previous data, the program reads the input parameters and switches the motors to automatic mode. The gear is probed at the upper and lower end faces to set the axial zero. Then, for each tooth, the probe moves to the starting point of the left-handed contact line and travels along the line while sampling coordinates at a predefined density. The same is repeated for the right-handed contact line. When all teeth on one helical side are measured, the probe moves to the other side and continues. The measured data are saved in a data file.
5.4 Data Processing Program
The raw data consist of the \(T\), \(Z\), and \(\theta\) coordinates. For each tooth, I compute the horizontal coordinate \(X_j\) as the cumulative sum of the \(T\)-axis values:
\[
X_j = \sum_{k=1}^{j} P_{T_k} + p
\tag{11}
\]
where \(p\) is the pitch distance on the reference circle. The vertical coordinate is \(Z_j\). Then I apply the least-squares line fitting to get the two contact lines and compute the intersection point. Finally, the program generates the symmetry error graph and exports the results.
6. Measurement Experiments
6.1 Experimental Setup
I performed experiments on two herringbone gears with different module sizes. Their basic parameters are listed in Table 3. The gears were mounted on the CNC gear measuring machine with the right-handed side facing upward. I measured the contact lines on the inner flanks of the teeth, in the evaluation interval defined in Section 3.2.
| Parameter | Small module gear | Large module gear |
|---|---|---|
| Normal module \(m_n\) | 2.2 mm | 3.9 mm |
| Number of teeth \(z\) | 27 | 27 |
| Pressure angle \(\alpha_n\) | 22° | 22° |
| Helix angle \(\beta\) | 30° | 30° |
| Single gear width \(B\) | 30 mm | 47 mm |
| Runout groove width \(W\) | 20 mm | 20 mm |
6.2 Results for the Small Module Gear
The evaluation interval for the small gear was set to \([16,34]\,\mathrm{mm}\). Figure 4 shows the measured symmetry error curve. The single-tooth symmetry errors vary from \(-0.0201\,\mathrm{mm}\) to \(-0.0002\,\mathrm{mm}\). The total symmetry error is \(F_A=0.0199\,\mathrm{mm}\), the adjacent difference is \(f_{Au}=0.0101\,\mathrm{mm}\), and the average error is \(f_{As}=-0.0113\,\mathrm{mm}\). These values indicate that the gear satisfies its design tolerance.
6.3 Results for the Large Module Gear
For the large gear, the evaluation interval was \([19,48]\,\mathrm{mm}\). The measured errors range from \(-0.0322\,\mathrm{mm}\) to \(-0.0235\,\mathrm{mm}\). The derived values are \(F_A=0.0077\,\mathrm{mm}\), \(f_{Au}=0.0056\,\mathrm{mm}\), and \(f_{As}=-0.0281\,\mathrm{mm}\). Thus, both gears meet the symmetrical requirement.
6.4 Comparison with the Cross-Section Method
I also measured the same gears using the cross-section method, which is a conventional rapid technique that measures the intersection lines of the tooth surfaces with the reference cylinders. Table 4 compares the results obtained by the two methods.
| Error item | Small module gear | Large module gear | ||
|---|---|---|---|---|
| Contact-line method | Cross-section method | Contact-line method | Cross-section method | |
| \(f_{Ai}\) range (mm) | −0.0201 ~ −0.0002 | −0.0309 ~ −0.0020 | −0.0322 ~ −0.0235 | −0.0369 ~ −0.0271 |
| \(f_{Au}\) (mm) | 0.0101 | 0.0215 | 0.0056 | 0.0101 |
| \(F_A\) (mm) | 0.0199 | 0.0228 | 0.0087 | 0.0098 |
| \(f_{As}\) (mm) | −0.0113 | −0.0243 | −0.0281 | −0.0301 |
| Measuring time (min) | 105 | 10 | 105 | 10 |
It can be seen that the contact-line method gives smaller error values and more stable results. The differences between the two methods are within several micrometers for the large gear and about ten micrometers for the small gear. However, the contact-line method takes about ten times longer than the cross-section method. Therefore, the contact-line method is preferable when high precision is required, while the cross-section method is suitable for rapid on-site inspection.
6.5 Verification Experiments
To verify the repeatability of the proposed method, I repeated the measurement with the left-handed side facing upward, keeping all other conditions unchanged. The resulting symmetry errors were almost the same as those obtained with the right-handed side upward. For the small gear, the errors changed by less than 0.003 mm; for the large gear, the difference was less than 0.001 mm. This confirms that the measurement is independent of the mounting orientation.
6.6 Measurement Uncertainty Analysis
Following the Guide to the Expression of Uncertainty in Measurement (GUM), I evaluated the standard uncertainty of the measured symmetry errors using Type A evaluation. Five repeated measurements were taken for each gear. For each measurement item, the arithmetic mean, standard deviation, standard uncertainty, and extended uncertainty were calculated using the following formulas:
\[
\bar{x} = \frac{1}{n}\sum_{k=1}^{n} x_k
\tag{12}
\]
\[
\sigma = \sqrt{\frac{\sum_{k=1}^{n}(x_k-\bar{x})^2}{n-1}}
\tag{13}
\]
\[
u = \frac{\sigma}{\sqrt{n}} \quad \text{(for mean value)}
\tag{14}
\]
\[
U = k u \quad \text{(k=2 for 95% confidence)}
\tag{15}
\]
Since I used single measurements for the final results, I took \(u = \sigma\) for the single-tooth error. Table 5 lists the uncertainty for the main parameters of the small gear, and Table 6 lists those for the large gear.
| Error parameter | Standard uncertainty \(u\) (mm) | Extended uncertainty \(U\) (mm) | Confidence level |
|---|---|---|---|
| \(f_{Au}\) | 0.0007 | 0.0014 | 95% |
| \(F_A\) | 0.0012 | 0.0024 | 95% |
| \(f_{As}\) | 0.0003 | 0.0006 | 95% |
| Error parameter | Standard uncertainty \(u\) (mm) | Extended uncertainty \(U\) (mm) | Confidence level |
|---|---|---|---|
| \(f_{Au}\) | 0.0007 | 0.0014 | 95% |
| \(F_A\) | 0.0003 | 0.0006 | 95% |
| \(f_{As}\) | 0.0003 | 0.0006 | 95% |
I also analyzed the uncertainty of each individual tooth. The results show that tooth No. 15 of both gears always exhibits a relatively large error compared to the other teeth. This is because that tooth was used as the grinding test tooth during manufacturing, which introduced an additional deviation. The uncertainty analysis thus verifies the reliability of the proposed measurement method.
7. Conclusions and Outlook
In this thesis, I have presented a comprehensive study on the measurement and evaluation of the symmetry error of herringbone gears based on the contact lines. The main conclusions are:
- I defined the symmetry error of a herringbone gear as the axial offset of the intersection point of the two opposite-handed contact lines from the gear center plane. This definition directly links the manufacturing quality to the service performance, since it reflects the potential axial vibration and non-uniform load distribution during meshing.
- I established a mathematical model for the contact lines and proposed a least-squares fitting algorithm to evaluate the symmetry error. The method was validated by comparing simulation data with the cross-section method, achieving agreement within 0.5 micrometers.
- I developed a measurement principle and implemented it on a CNC gear measuring machine. The software allows automatic measurement of all teeth and provides the single-tooth errors, adjacent differences, total error, and average error.
- Experimental results on two gears with different moduli confirmed that the proposed method is practical and accurate. The measured errors met the design requirements.
- The comparison with the cross-section rapid method shows that the contact-line method provides higher precision and better stability, although it requires more measurement time. Thus, there is a trade-off between accuracy and efficiency, and the choice depends on the specific application.
- I carried out a repeatability verification by changing the mounting direction, and the results were consistent. The measurement uncertainty analysis indicated that the extended uncertainty is less than 0.003 mm for the main error parameters.
Future work will focus on optimizing the measurement algorithm to reduce the measurement time without sacrificing accuracy. In addition, the relationship between the measured symmetry error and the axial vibration characteristics of the herringbone gear transmission system will be investigated experimentally, providing a direct quantitative link between the geometry and the dynamic behavior.