
Characterized by exceptional load-bearing capacity, inherent cancellation of axial forces, and smooth power transmission, the herringbone gear system has established itself as a critical component in the drive systems of heavy machinery, such as marine vessels. The dynamic behavior of these systems serves as a paramount indicator for evaluating the quality of transmission design. Therefore, in-depth research into the vibrational load characteristics of herringbone gear transmissions is of significant importance for reducing gear noise and enhancing system fatigue life. Within the study of herringbone gear dynamics, the time-varying meshing stiffness of the gear teeth stands out as the most influential internal excitation parameter affecting system vibration, garnering extensive attention from experts and scholars globally.
The unique double-helical structure of the herringbone gear presents both advantages and analytical complexities. The primary challenge lies in accurately modeling the coupled interaction between the left and right helical sections, which is significantly influenced by manufacturing tolerances and assembly conditions. A common, yet often oversimplified, approach treats the herringbone gear as two independent helical gears. In practical applications, however, the meshing states of the left and right helical teeth are not identical due to inevitable errors, leading to a complex coupling relationship. A critical design feature to mitigate this is the axial floating installation of the pinion, typically the component with lower inertia. This allows for self-alignment and automatic load distribution between the two helical halves. Accurately calculating the time-varying meshing stiffness, while accounting for this axial float, is fundamental for precise dynamic analysis.
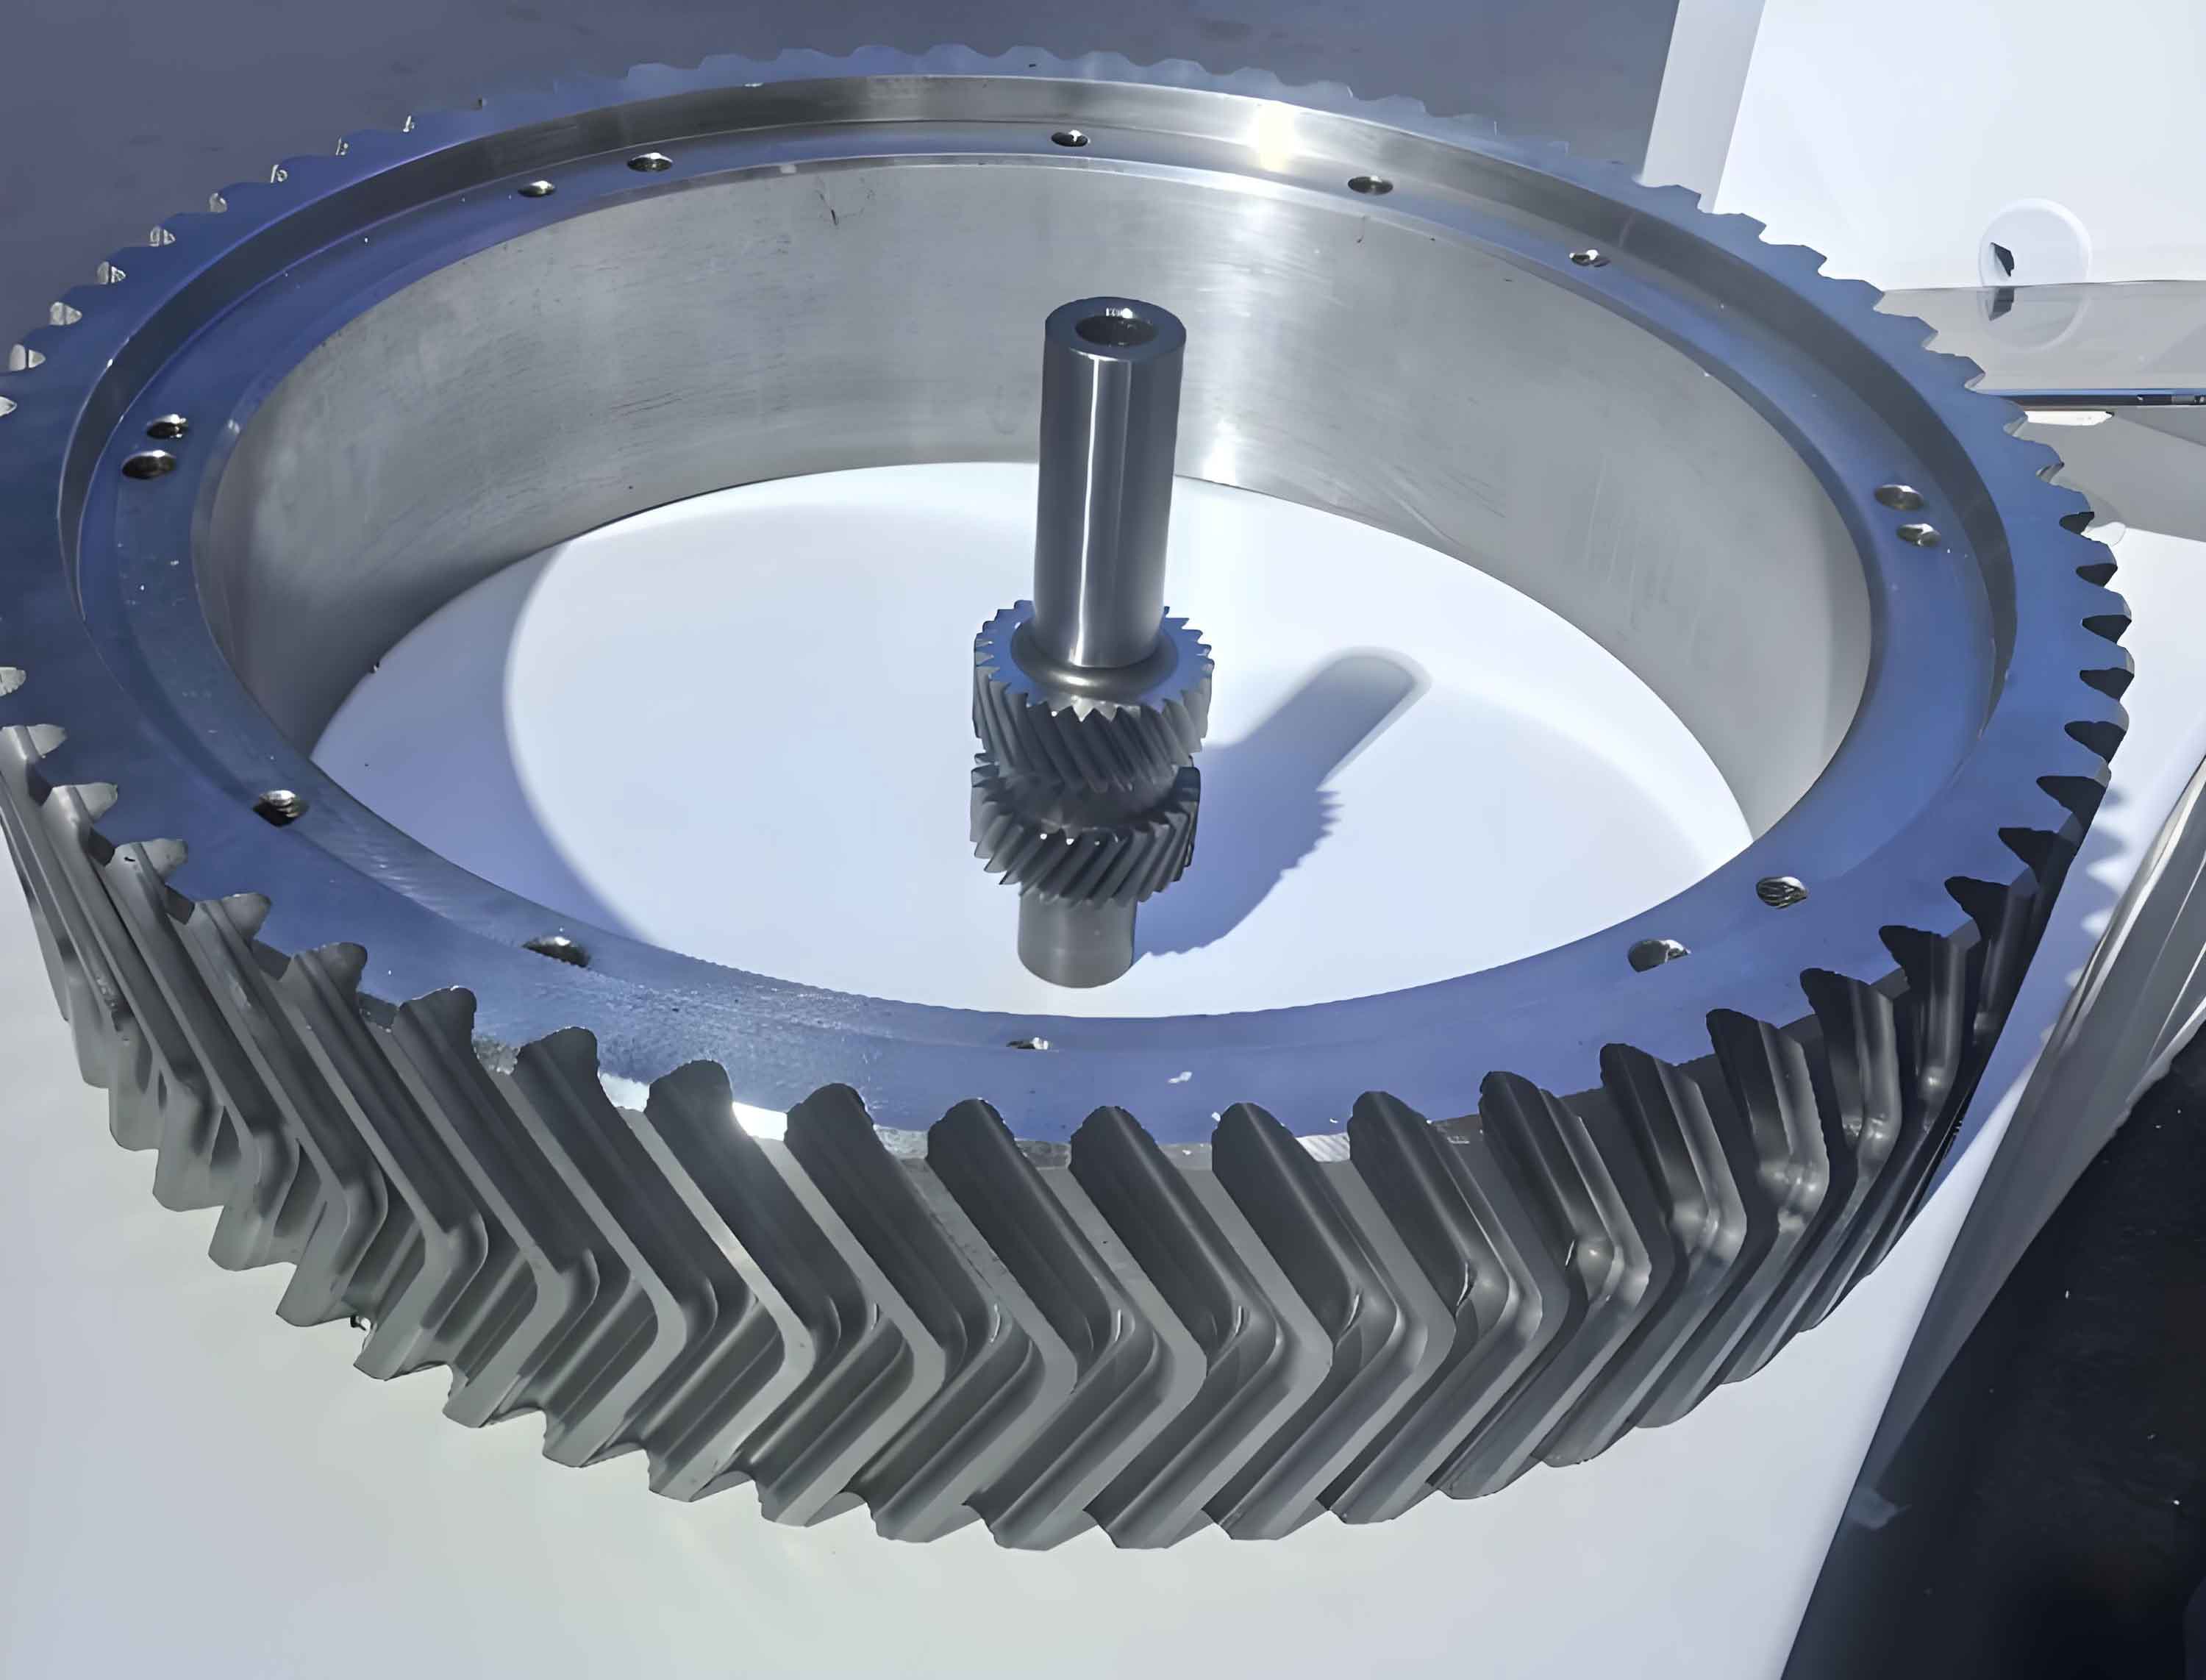
Modeling Meshing Stiffness with Axial Float
To accurately compute the meshing stiffness of a herringbone gear pair, a Loaded Tooth Contact Analysis (LTCA) model that incorporates axial float must be established. This model builds upon the foundation of cylindrical helical gear contact mechanics. Considering a herringbone gear pair where the pinion is axially floating, we assume simultaneous contact for two tooth pairs on the left flank (I, II) and two on the right flank (III, IV). The contact problem is analyzed in a cross-section expanded along the major axis of the contact ellipse.
Let \(i\) denote the index of the instantaneous contact ellipse center, and \(j\) denote the index of discrete data points along the ellipse’s major axis. The parameter \(w\) represents the initial separation before loading, derived from an unloaded Tooth Contact Analysis (TCA). After deformation under load, the actual remaining gap between tooth pairs is denoted by \(d\), and \(p\) is the discrete contact pressure. Due to the continuity of the herringbone gear transmission, the comprehensive normal deformation of the left and right flanks must be equal, represented by \(Z\). The governing equations include the displacement compatibility equation, force equilibrium equations, and the non-embedment condition, forming the following system for \(k = I, II, III, IV\):
$$ [F]_k[p]_k + [w]_k = [Z] + [d]_k $$
$$ \sum_{j=1}^{n} p_j^I + \sum_{j=1}^{n} p_j^{II} = P_L $$
$$ \sum_{j=1}^{n} p_j^{III} + \sum_{j=1}^{n} p_j^{IV} = P_R $$
$$ P_L + P_R = P $$
$$ p_j^k \cdot d_j^k = 0 \quad \text{and} \quad p_j^k, d_j^k \text{ are not simultaneously zero} $$
Here, \([F]_k\) is the surface contact compliance matrix, \([p]_k\) is the normal force vector, \([w]_k\) is the initial gap vector, \([Z]\) is the normal deformation vector, \([d]_k\) is the remaining gap vector after loading, \(P_L\) and \(P_R\) are the total loads on the left and right helical flanks respectively, and \(P\) is the total transmitted load on the herringbone gear.
In an ideal, error-free scenario, the parameters for the left and right flanks are identical, leading to \(P_L = P_R\). However, real-world manufacturing and installation errors disrupt this symmetry, causing uneven load distribution (\(P_L \ne P_R\)). The axial floating installation of the pinion compensates for this. The simulation process involves iteratively adjusting a small axial float displacement \(\varepsilon\) of the pinion. This displacement is converted into an equivalent normal direction adjustment \(\varepsilon_n\) on the tooth flanks, effectively modifying the initial gap vector for the left and right contacts in opposite directions:
$$ [w’]_k = [w]_k \pm [\varepsilon_n] \quad \text{for} \quad k = I, II $$
$$ [w’]_k = [w]_k \mp [\varepsilon_n] \quad \text{for} \quad k = III, IV $$
The modified gap \(w’\) is substituted into the LTCA equations. The loads \(P_L\) and \(P_R\) are solved, and their difference is checked. The axial float \(\varepsilon\) is iteratively adjusted until \(P_L = P_R\) within a specified tolerance, indicating balanced loading. This final \(\varepsilon\) is the axial float for that specific meshing position. The comprehensive deformation \(Z(\phi)\) is obtained from this converged LTCA solution.
The time-varying meshing stiffness \(k(\phi)\) can then be derived from the gear’s geometric parameters and the computed deformation:
$$ k(\phi) = \frac{T_m}{r_b \cdot Z(\phi)} $$
where \(T_m\) is the load torque on the bull gear, \(r_b\) is the base circle radius of the bull gear, and \(\phi\) is the rotation angle.
Analysis of Meshing Stiffness Under Multiple Loads
The meshing stiffness of a herringbone gear system is not linear with respect to load, contrary to some simplified models. As load increases, the contact ellipse on the tooth flank expands, altering the effective contact area and compliance. The nonlinear relationship between load and stiffness is a critical characteristic that must be captured for accurate dynamic simulation. Using the developed LTCA-based method, the meshing stiffness of a herringbone gear pair can be calculated across its meshing cycle for various load levels. The fundamental parameters for an example single-stage herringbone gear system are provided below:
| Parameter | Pinion | Bull Gear |
|---|---|---|
| Normal Module (mm) | 6 | 6 |
| Transverse Pressure Angle (°) | 20 | 20 |
| Helix Angle (°) | +24.43 | -24.43 |
| Number of Teeth | 17 | 44 |
| Face Width B (mm) | 55 | 55 |
Calculations were performed for load torques \(T_m\) of 621 N·m, 828 N·m, 1035 N·m, and 1242 N·m. The resulting time-varying meshing stiffness curves reveal a distinct nonlinear trend. The stiffness increases with the applied load, but the rate of increase diminishes as the load grows higher. Eventually, both the mean stiffness value and the amplitude of its fluctuation tend to stabilize. This indicates that the meshing stiffness approaches a saturated state under high loads, a crucial consideration for the herringbone gear system operating under heavy-duty conditions.
Tooth Surface Modification for Optimal Meshing Stiffness
The fluctuation amplitude of the time-varying meshing stiffness is a direct source of parametric excitation, significantly influencing the vibration, noise, and operational stability of the herringbone gear system. Tooth surface modification is an essential technique to improve meshing quality by smoothing the transition of tooth contact and thereby reducing dynamic load. For herringbone gears, where the line of contact is diagonally distributed across the tooth face, a three-dimensional modification that combines profile (lead) and longitudinal (crowning) corrections is necessary for optimal results.
An optimization can be formulated with the objective of minimizing the fluctuation amplitude of the meshing stiffness. The design variables are the amounts and lengths of modification at the tip, root, and both ends of the tooth face in the profile and longitudinal directions. A genetic algorithm is well-suited for solving this multimodal optimization problem. The objective function \(f_{opt}\) is defined as:
$$ f_{opt}(\mathbf{y}) = \min(A_{max} – A_{min}) $$
subject to constraints on modification amounts and lengths:
$$ y_1 – y_3 \le Q_{y0}, \quad y_2 – y_4 \le l_{y0} $$
$$ Q_{ymin} \le y_1, y_3 \le Q_{ymax}, \quad l_{ymin} \le y_2, y_4 \le l_{ymax} $$
$$ y_5 – y_7 \le Q_{z0}, \quad y_6 – y_8 \le l_{z0} $$
$$ Q_{zmin} \le y_5, y_7 \le Q_{zmax}, \quad l_{zmin} \le y_6, y_8 \le l_{zmax} $$
Here, \(A_{max}\) and \(A_{min}\) are the peak and trough values of the meshing stiffness curve (calculated from the LTCA model), \(\mathbf{y} = [y_1, y_2, …, y_8]\) is the vector of optimization variables (modification amounts and lengths), and the \(Q\) and \(l\) constants represent practical limits on modification. The optimization process iteratively evaluates candidate modification geometries, calculates the resulting meshing stiffness, and seeks the design that minimizes its peak-to-peak variation.
For the example herringbone gear under a design load of 828 N·m, the optimization yielded the following 4th-order parabolic modification parameters for the pinion:
| Direction | Tip Amount \(y_1\) (µm) | Tip Length \(y_2\) (mm) | Root Amount \(y_3\) (µm) | Root Length \(y_4\) (mm) |
|---|---|---|---|---|
| Profile | 15 | 14.1 | 15 | 8 |
| Direction | End1 Amount \(y_5\) (µm) | End1 Length \(y_6\) (mm) | End2 Amount \(y_7\) (µm) | End2 Length \(y_8\) (mm) |
|---|---|---|---|---|
| Longitudinal | 15.2 | 13 | 14 | 13.8 |
A comparison of the meshing stiffness for the standard (unmodified) and optimized tooth surfaces at the design load shows a significant smoothing effect. The fluctuation amplitude is markedly reduced, with a relative reduction rate of 13.3%. This demonstrates the effectiveness of the three-dimensional modification in improving the meshing characteristics of the herringbone gear. It is important to note that the optimal modification is load-dependent. At loads significantly lower than the design point, the modified surface may exhibit poorer contact and even higher stiffness fluctuation than the standard surface, highlighting the necessity of designing the modification for the intended operational load range of the herringbone gear system.
Experimental Measurement and Validation
To validate the theoretical models, experimental measurement of herringbone gear meshing stiffness is essential. A closed power flow test rig is ideally suited for this purpose, as it allows for stable static loading with minimal energy consumption. The basic principle involves applying a known static torque via a torsion bar and precisely measuring the rotational angles of both the pinion and bull gear using high-precision rotary encoders (e.g., Heidenhain circular gratings).
If the gear teeth were infinitely rigid, the angular output would follow the gear ratio exactly. However, due to elastic deformation under load, an angular transmission error occurs. This error, derived from the difference between the measured angles and the theoretical rigid-body motion, is directly related to the comprehensive tooth deformation \(Z(\phi)\). The meshing stiffness can then be calculated from the measured data. The formulas for processing encoder signals and calculating stiffness are as follows. The rotation angle \(\phi(t_{i,j})\) at a sampled instant is determined from the encoder’s sinusoidal signal:
$$ \phi(t_{i,j}) = \phi(t_{i,j-1}) + \frac{360}{N} \cdot \frac{\theta(t_{i,j}) – \theta(t_{i,j-1})}{2\pi} $$
where \(N\) is the number of grating lines, and \(\theta(t_{i,j})\) is the corresponding radian value. The time-varying meshing stiffness \(k(t)\) is then:
$$ k(t) = \frac{T_m}{r_b^2} \cdot \frac{\pi}{180} \cdot \left[ (\varphi_2(t) – \varphi_{20}) – (\varphi_1(t) – \varphi_{10}) \cdot \frac{z_1}{z_2} \right]^{-1} $$
where \(\varphi_1\) and \(\varphi_2\) are the measured rotation angles of the pinion and bull gear, \(\varphi_{10}\) and \(\varphi_{20}\) are their initial reference angles, and \(z_1\), \(z_2\) are the tooth numbers. To isolate the gear mesh frequency, frequency components related to shaft rotation are filtered out.
For the standard tooth surface under an 828 N·m load, the theoretical and experimentally measured meshing stiffness curves show excellent agreement in their periodic variation trend. The maximum deviation was found to be 0.23 × 10⁹ N/m, representing a relative deviation of 8.8%. Furthermore, this maximum relative deviation decreases and stabilizes (around 4.5%) as the load increases. This is because the larger deformation at higher loads provides a larger signal base, making measurement errors relatively less significant.
A critical validation is the comparison of stiffness fluctuation amplitude before and after modification, across multiple loads. The experimental results consistently corroborate the theoretical predictions, as summarized below:
| Load Torque (N·m) | Theoretical Fluctuation Amp. (×10⁹ N/m) | Experimental Fluctuation Amp. (×10⁹ N/m) | ||||
|---|---|---|---|---|---|---|
| Standard | Modified | Reduction | Standard | Modified | Reduction | |
| 621 | 0.43 | 0.46 | -6.9% | 0.51 | 0.55 | -7.1% |
| 828 | 0.60 | 0.52 | 13.3% | 0.76 | 0.65 | 14.2% |
| 1035 | 0.64 | 0.56 | 12.5% | 0.81 | 0.70 | 13.9% |
| 1242 | 0.65 | 0.58 | 10.7% | 0.85 | 0.74 | 12.3% |
The data confirms that the modification achieves its best performance (greatest reduction in fluctuation) near the design load of 828 N·m, with both theory and experiment showing a consistent trend.
Conclusion
The accurate determination of time-varying meshing stiffness is fundamental to understanding and optimizing the dynamics of herringbone gear systems. This analysis has demonstrated that a comprehensive model must account for the axial float of the pinion, which is essential for achieving load balance between the two helical halves under real-world manufacturing and assembly errors. The Loaded Tooth Contact Analysis (LTCA) approach provides a robust framework for this, revealing the nonlinear relationship between meshing stiffness and applied load, where stiffness increases with load but saturates at higher levels.
Furthermore, targeted three-dimensional tooth surface modification, optimized using algorithms like the genetic algorithm with the objective of minimizing meshing stiffness fluctuation, proves to be a highly effective method for improving the vibrational performance of herringbone gears. The optimization must be conducted for the intended operational load range to ensure effectiveness.
Finally, experimental validation using a closed power flow test rig and high-precision angular encoders confirms the accuracy of the theoretical models. The strong agreement between calculated and measured meshing stiffness, both in waveform and in the trend of modification effects, provides confidence in the proposed methodologies for the analysis and design of high-performance herringbone gear transmissions.