
0 Introduction
During the gear transmission process, the time-varying meshing stiffness is the driving force of the vibration of the transmission system.One of the main internal incentive sourcesIt is also used to determine the load distribution between teeth.The key is to accurately and quickly determine the time-varying meshing stiffness for gear dynamics analysisand strength calculation are of great significance.The calculation method of gear meshing stiffness mainly includes the method of material mechanicshavefinite element methodApproximate substitution methodBasic ideas of potential energy method in material mechanicsIt is thought that the gear tooth is regarded as a variable cross-section cantilever beam on the base circle, and the bending potential energy, shear potential energy, and compressive potential energy stored in the gear tooth during the gear meshing process are derived.The energy of contraction and Hertzian contact can be used to calculate the meshing stiffness of gears, which is more accurate than the method ofThe finite element method is fast and efficient, but due to its limitations, it cannot be directly usedTo calculate the meshing stiffness of helical gears.Based on differentialThoughts discretize helical gears along the tooth width slice, and use potential energy method to calculate the sliceThe meshing stiffness of a spur gear is obtained by parallel superimposing the stiffness of thin slices to obtain a helical gearBased on the slicing model and potential energy method,By improving the calculation method of the length and position of the meshing line of helical gears, aA calculation model for the meshing stiffness of helical gears with tooth profile modification considering axial deformationIt can not only calculate the meshing stiffness of helical gears, but also determine the tooth profile modificationThe finite element method can consider the three-dimensional effect of helical gear deformation, quasiIt is highly accurate, but it usually requires the use of high-performance computers and takes a long time.Based on the finite element method, a linear programming method is proposedAn improved method for calculating the meshing stiffness by calculating theThe meshing stiffness of internal and external helical gears is studied, and the influence of meshing stiffness on the meshing process is analyzed.and proposed a method toCalculation method for the meshing stiffness of helical gears based on the combination of finite element method and elastic contact theoryThe method was validated by comparing with the results of aeronautical standard calculations.
At present, in the study of dynamics and fault characteristics of helical gears, in order to achieveThe fast calculation of meshing stiffness adopts approximation substitutionThe method replaces the change in gear meshing stiffness with the change in gear contact line length, andThe mesh stiffness is approximated as a harmonic-like form by Fourier series expansion, butThe approximate substitution method does not consider the meshing stiffness per unit length during gear meshing.The accuracy of the calculation needs further research.Based on the variation law of gear contact line, combined with the meshing of single tooth unit lengthStiffness parabolic model and ISO6336-1 standard are used to establish the helical gearQuasi-static elastic model, and approximate substitution based on quasi-static rigid modelComparative study was conducted using alternative methods, and compared with ISO standard results,The accuracy of the quasi-static elastic model;analysis and discussion of geometric parameters and fractureThe influence of tooth failure on the meshing stiffness and load distribution coefficient of helical gearsThe study of the dynamics of helical gear failure provides a foundation for the study of helical gear failure dynamics.
1 Quasi-static rigid model of helical gear
The approximate substitution method of helical gear meshing stiffness assumes that during the gear meshing processThe load on the gear is evenly distributed along the contact line, and the deformation of the gear is along the contact lineIt is also evenly distributed, and the gear meshing stiffness per unit length is constant.The meshing stiffness of the gear is only related to the length of the contact line.The meshing plane of the helical gear is developed according to the base circle, as shown in Figure 1.In 1, εα is the end face coincidence degree, εβ is the axial coincidence degree, and εγ is the total coincidence degree.Suitable, βb is the base circle helix angle, b is the tooth width, and μ is the end face meshingThe coordinate, whose size is the projection of the intersection point of the tooth contact line and the end surface on the base circle,Distance to enter end B2.
Figure 1 Change in length of contact line on the meshing plane of helical gears
2 Quasi-static elastic model of helical gear
Due to the spiral effect, the meshing area of helical gears usually has two pairs or twoWhen the above gear teeth are meshed at different tooth heights simultaneously, although the gear meshingThe combined stiffness is proportional to the length of the tooth contact line, but the contact length varies with different tooth heights.The meshing stiffness of the points is different.Study in detailThe meshing stiffness of spur gears and helical gears is derived, and the formula for the meshing stiffness of a single pair of teeth is derived and verified by numerical methods.
Figure 2 Comparison of meshing stiffness models per unit length of a single tooth
3. Comparison and analysis of calculation results
Taking a pair of meshing gears as an example, the parameters are shown in Table 1.To study the influence of αk, we calculated the effect of αk= 0.55 and αk= 0.8Two cases are calculated, and Figure 3 shows the meshing stiffness calculated by the two models.The results of the comparison show that kR, kE, KR, and KE in the figure are respectively the quasi-static rigidSingle tooth meshing stiffness and gear synthesis meshing of model and elastic modelStiffness.
Figure 3 Comparison of gear meshing stiffness models
To verify the accuracy of the model, the two modes were simulated at different helical angles.The average value of the comprehensive meshing stiffness of the model is calculated and compared with the standard ISO6336-1The results are compared as shown in Table 2.It can be seen from the comparison that αk= 0.55Quasi Static Elastic ModelThe average meshing stiffness obtained by QSEM and the result of standard ISO6336-1The error is minimized, with a maximum error of no more than 4%;αkCalculation result when = 0.8The relative error with the standard results is about 6% on average, and the quasi-static rigid modulusThe calculation results of quasi static rigid model (QSRM) and ISOThe standard deviation of the results is relatively large, with an overall error of over 10%.Figure 4 shows the load distribution coefficient of two models during helical gear transmission.It can be seen that the load distribution coefficient changes with the helical gearSimilar to the change in single tooth meshing stiffness, it gradually increases to a peak value and then gradually decreases.The curve becomes smaller and the smaller αk is, the steeper the curve changes.
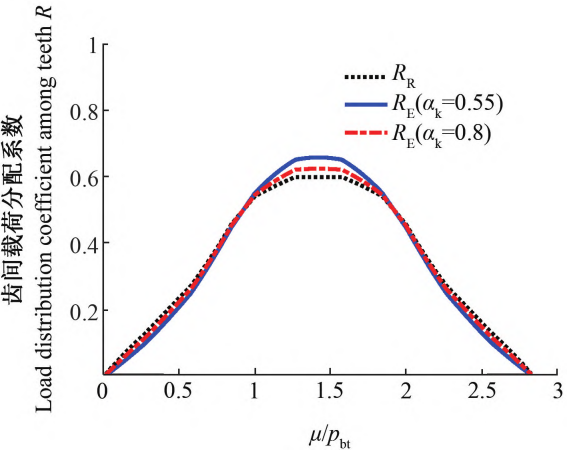
Figure 4 Comparison of load distribution coefficient models for helical gears
4. Analysis of the influence of main geometric parameters
From the above analysis, αkThe quasi-static elastic model with = 0.55The consistency between the results and the ISO standard is good. Based on this model, we will analyze severalThe influence of parameters is analyzed.Figure 5 shows the comprehensive influence of helical angle on helical gearThe influence of meshing stiffness and load distribution coefficient.As shown in Figure 5a, withAs the helical angle increases, the comprehensive meshing stiffness of the helical gear decreases first and then increases. WhenWhen β = 13°, the comprehensive meshing stiffness fluctuation is the smallest.According to Figure 5b, the screwThe larger the rotation angle, the smaller the peak value of the load distribution coefficient and the flatter the curve.
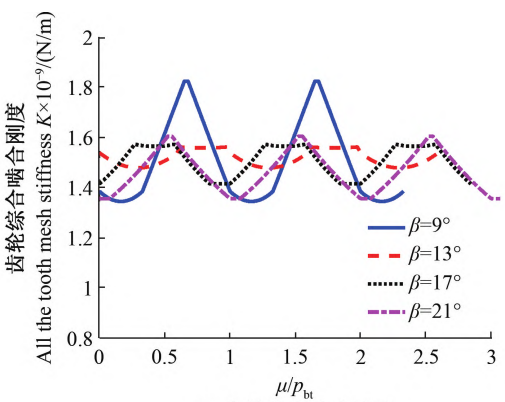
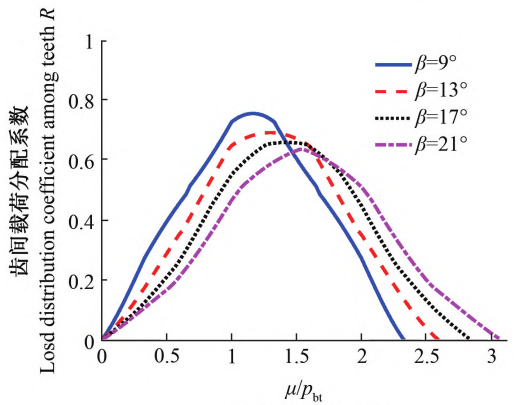
Figure 6 shows the influence of tooth width on the comprehensive meshing stiffness and load distribution coefficient.As shown in Figure 6a, with the increase of tooth width, the comprehensive meshingThe stiffness is continuously increasing, when b = 60 mm, the comprehensive meshing stiffness of the helical gearIt is approximately a straight line with minimal fluctuations.In Figure 6b, as the tooth width increases, the load distributionThe peak value of the fitting coefficient decreases continuously, and the larger the tooth width, the flatter the curve.
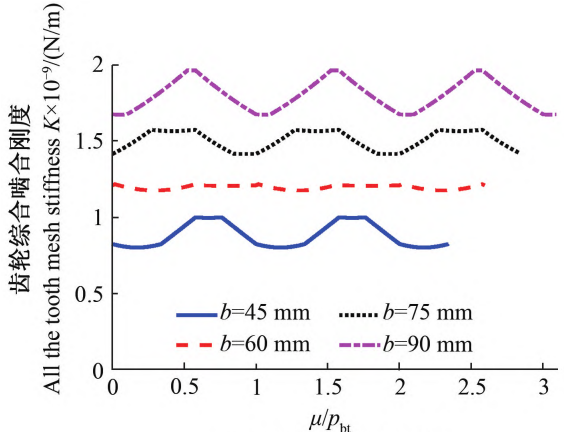
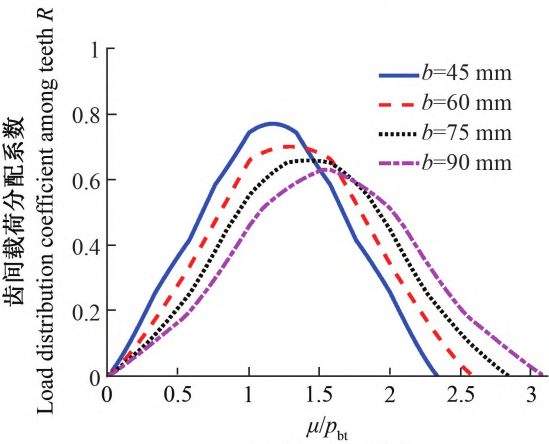
Figure 6 Effect of tooth width
When β=13° in Figure 5a and b=60 mm in Figure 6a, the comprehensive meshingThe fluctuation of the meshing stiffness is small, so in order to further analyze the fluctuation of the meshing stiffness,The dynamic law, defining the integrated meshing stiffness fluctuation factor Δ = (K max-K min ) / Ka.Figure 7 shows the variation of stiffness fluctuation factor with geometric parametersRegularity.As shown in Figure 7a and Figure 7b, as the helix angle and tooth width increase,In addition, the fluctuation factor of meshing stiffness first decreases, then increases, and then decreases againFluctuation;β equals 13° and 27° in Figure 7a and tooth width in Figure 7bWhen b equals to 60 mm and 120 mm, the axial coincidence degree is close toPositive integer 1 or 2, stiffness fluctuation factor Δ is located at the valley, meshing stiffnessThe fluctuation is the smallest.
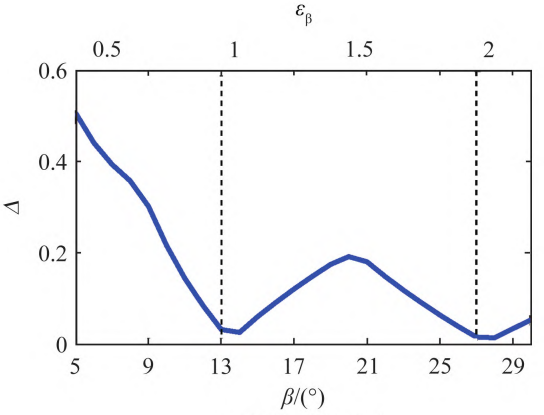
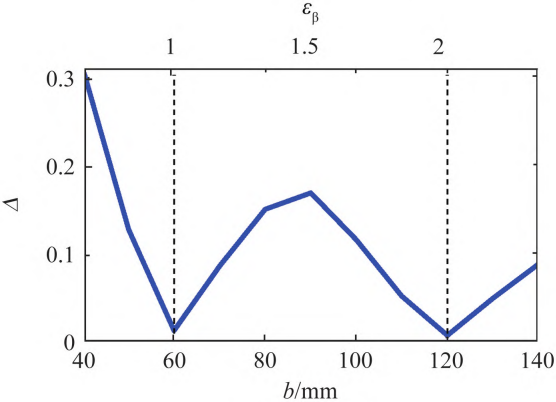
Figure 7 The influence of geometric parameters on the fluctuation of meshing stiffness
5. Analysis of the impact of broken teeth
5.1 Typical tooth breakage failure model of helical gear
Gear tooth breakage is a relatively serious gear failure that will cause the gearThe internal stiffness excitation and meshing state have undergone significant changes.Two typical types of tooth breakage are investigated. The first type is along the contact lineThe first is partial tooth breakage, and the second is partial or complete tooth breakage along the tooth width direction.as shown in Figure 8.
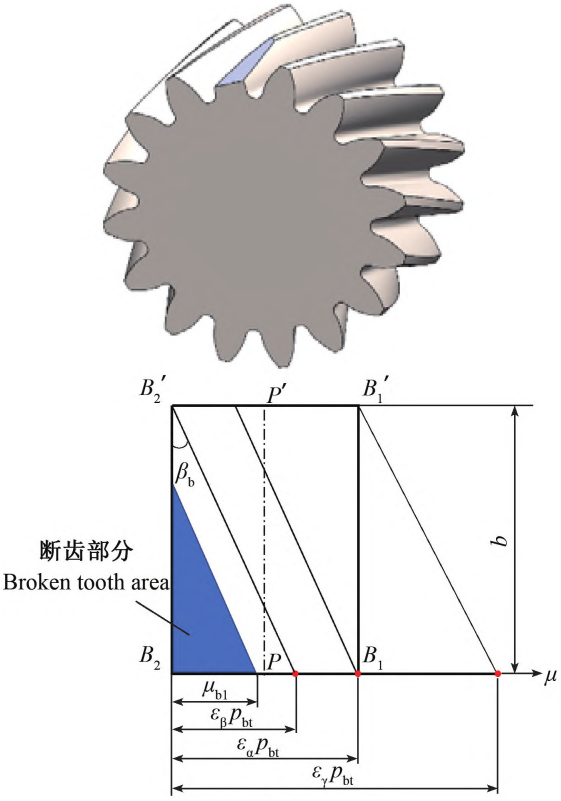

Figure 8. Fault model of helical gear tooth breakage
5.2 The influence of different tooth breakage forms and sizes
Firstly, according to Figure 8a, the coordinates of the broken tooth position μb1 on the end surface are taken as0, 1 / 3εαpbt, 2/3εαpbt, εαpbt, when calculating the broken tooth along the contact lineThe comprehensive meshing stiffness and load distribution coefficient of helical gears are shown in Figure 9As shown in Figure 9a, the larger μb1 is, the longer the broken tooth length is, and the larger the tooth contact area of the helical gear is.The greater the decrease in the comprehensive meshing stiffness, the influence domain of tooth breakage is [0, μb1], and when the meshing stiffness is less than μb1, the influence domain of tooth breakage is [0, μb1].After the impact of the broken tooth is removed, the overall stiffness returns to normal.Figure 9b showsIt can be seen that when the helical gear is broken along the contact line, the load within the influence area of the broken tooth isThe load distribution coefficient is 0, and the load distribution coefficient after the broken tooth affects the domain is the same as the positiveThe common gear is the same.
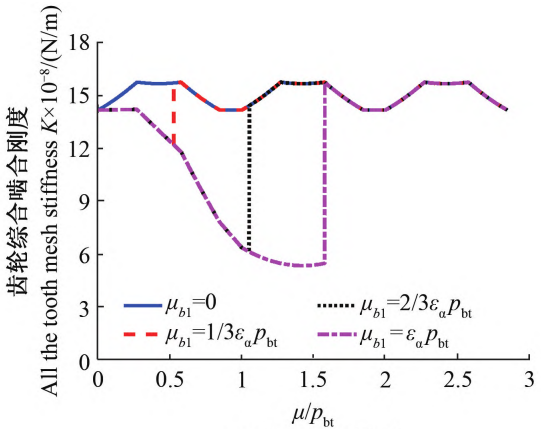
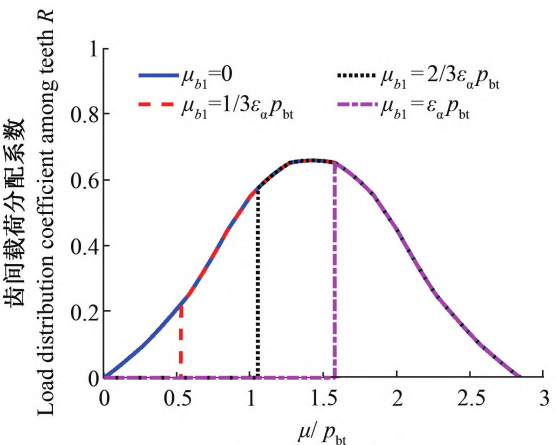
Figure 9 Comprehensive stiffness and load distribution coefficient of gears when the tooth is broken along the contact line directionThe change
Figure 10 shows the comprehensive meshing stiffness of helical gears when the tooth is broken along the tooth width directionand the variation of load distribution coefficient.Comparing Figure 10a and Figure 9a,It can be seen that at the same end face tooth break position, tooth break along the tooth width direction has a greater impact on the comprehensiveThe influence domain of meshing stiffness is larger, and the influence domain of tooth breakage of meshing stiffness is[0, μb2+ εβpbt].Comparing Figure 10b and Figure 9b, it can also be clearly seen thatThe influence domain of the load distribution coefficient also increases, and the load within [0, μb2]The distribution coefficient is 0 as the tooth is broken along the contact line, and it is [μb2 ,μb2+εβIn the pbt, the load distribution coefficient is significantly higher than that when the tooth is broken along the contact line direction.Reduce.
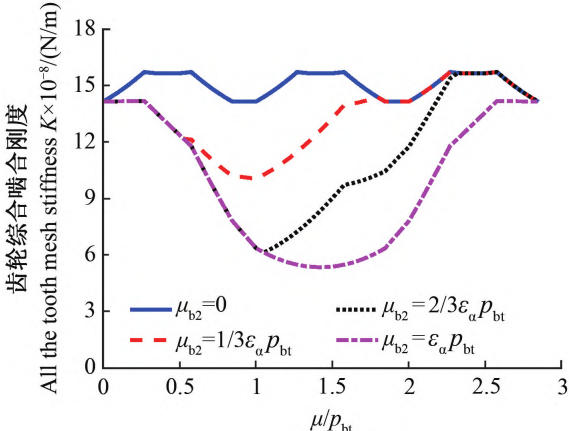

Figure 10 Variation of the comprehensive stiffness and load distribution coefficient of the gear when a tooth is broken along the tooth width direction
6 Conclusion
Based on the variation law of the contact line length of helical gears, combined with the single toothThe parabolic model of unit length meshing stiffness and ISO standard are established to establish the slopeGear quasi-static elastic model, and the quasi-static rigid model based on theA comparative study was conducted on the quasi-replacement method and ISO6336-1 standard.What parameters affect the comprehensive meshing stiffness and inter-tooth load distribution coefficient of helical gearsThe influence of different tooth breakage modes on the meshing stiffness and load distribution was discussed.The influence of the matching coefficient changes.1) Through model comparison, αkQuasi-static elastic model calculation at = 0.55The calculation results are in good agreement with the ISO standard results;based on quasi-static rigidThe approximate substitution method of the model has a smaller error compared to the ISO standard result.The overall error between the two is more than 10%.2) Parameter analysis shows that as the helix angle and tooth width increase, the meshingThe stiffness fluctuation factor showed a fluctuation change of first decreasing, then increasing, and then decreasing again,When the axial coincidence degree is an integer, the stiffness fluctuation factor is at the trough, and the meshingThe stiffness fluctuation is minimal.As the helix angle and tooth width increase, the load distribution on the tooth surfaceThe peak value of the matching coefficient decreases continuously, and the curve tends to be flat.Reasonable parameter optimizationcan effectively improve the stiffness excitation and inter-tooth load distribution of gears.3) The analysis of the tooth breakage fault indicates that the fault is mainly caused by the stress concentration along the contact line and along the tooth width direction.Both tooth breakages will cause a significant decrease in the overall meshing stiffness of the gears in the tooth breakage region.Low;at the same end face tooth break position, tooth break along the tooth width direction for helical gearThe influence of the comprehensive meshing stiffness and load distribution coefficient is greater in the broken tooth domain.Within the range of [0, μb], the influence of the two types of tooth breakage is the same, and within the range of [μb,μb+ εβThe comprehensive meshing stiffness and the maximum meshing stiffness of the gear under the condition of tooth breakage along the tooth width direction in the PBT gear areThe load distribution coefficient is significantly lower than that when the tooth is broken along the contact line.