
As a critical transmission component in aero-engines, bevel gears are prized for their stable power transmission, low operational noise, and compact structural design. Their failure, whether due to bending fracture, contact fatigue, or excessive wear, can lead to catastrophic engine shutdowns. Traditional deterministic design approaches often struggle to account for the inherent uncertainties present in real-world operations, such as fluctuations in load, variations in material properties, and manufacturing tolerances. This paper presents a comprehensive framework for the failure analysis and reliability-based design optimization (RBDO) of an aero-engine bevel gear transmission system, aiming to enhance its safety and efficiency under uncertain conditions.
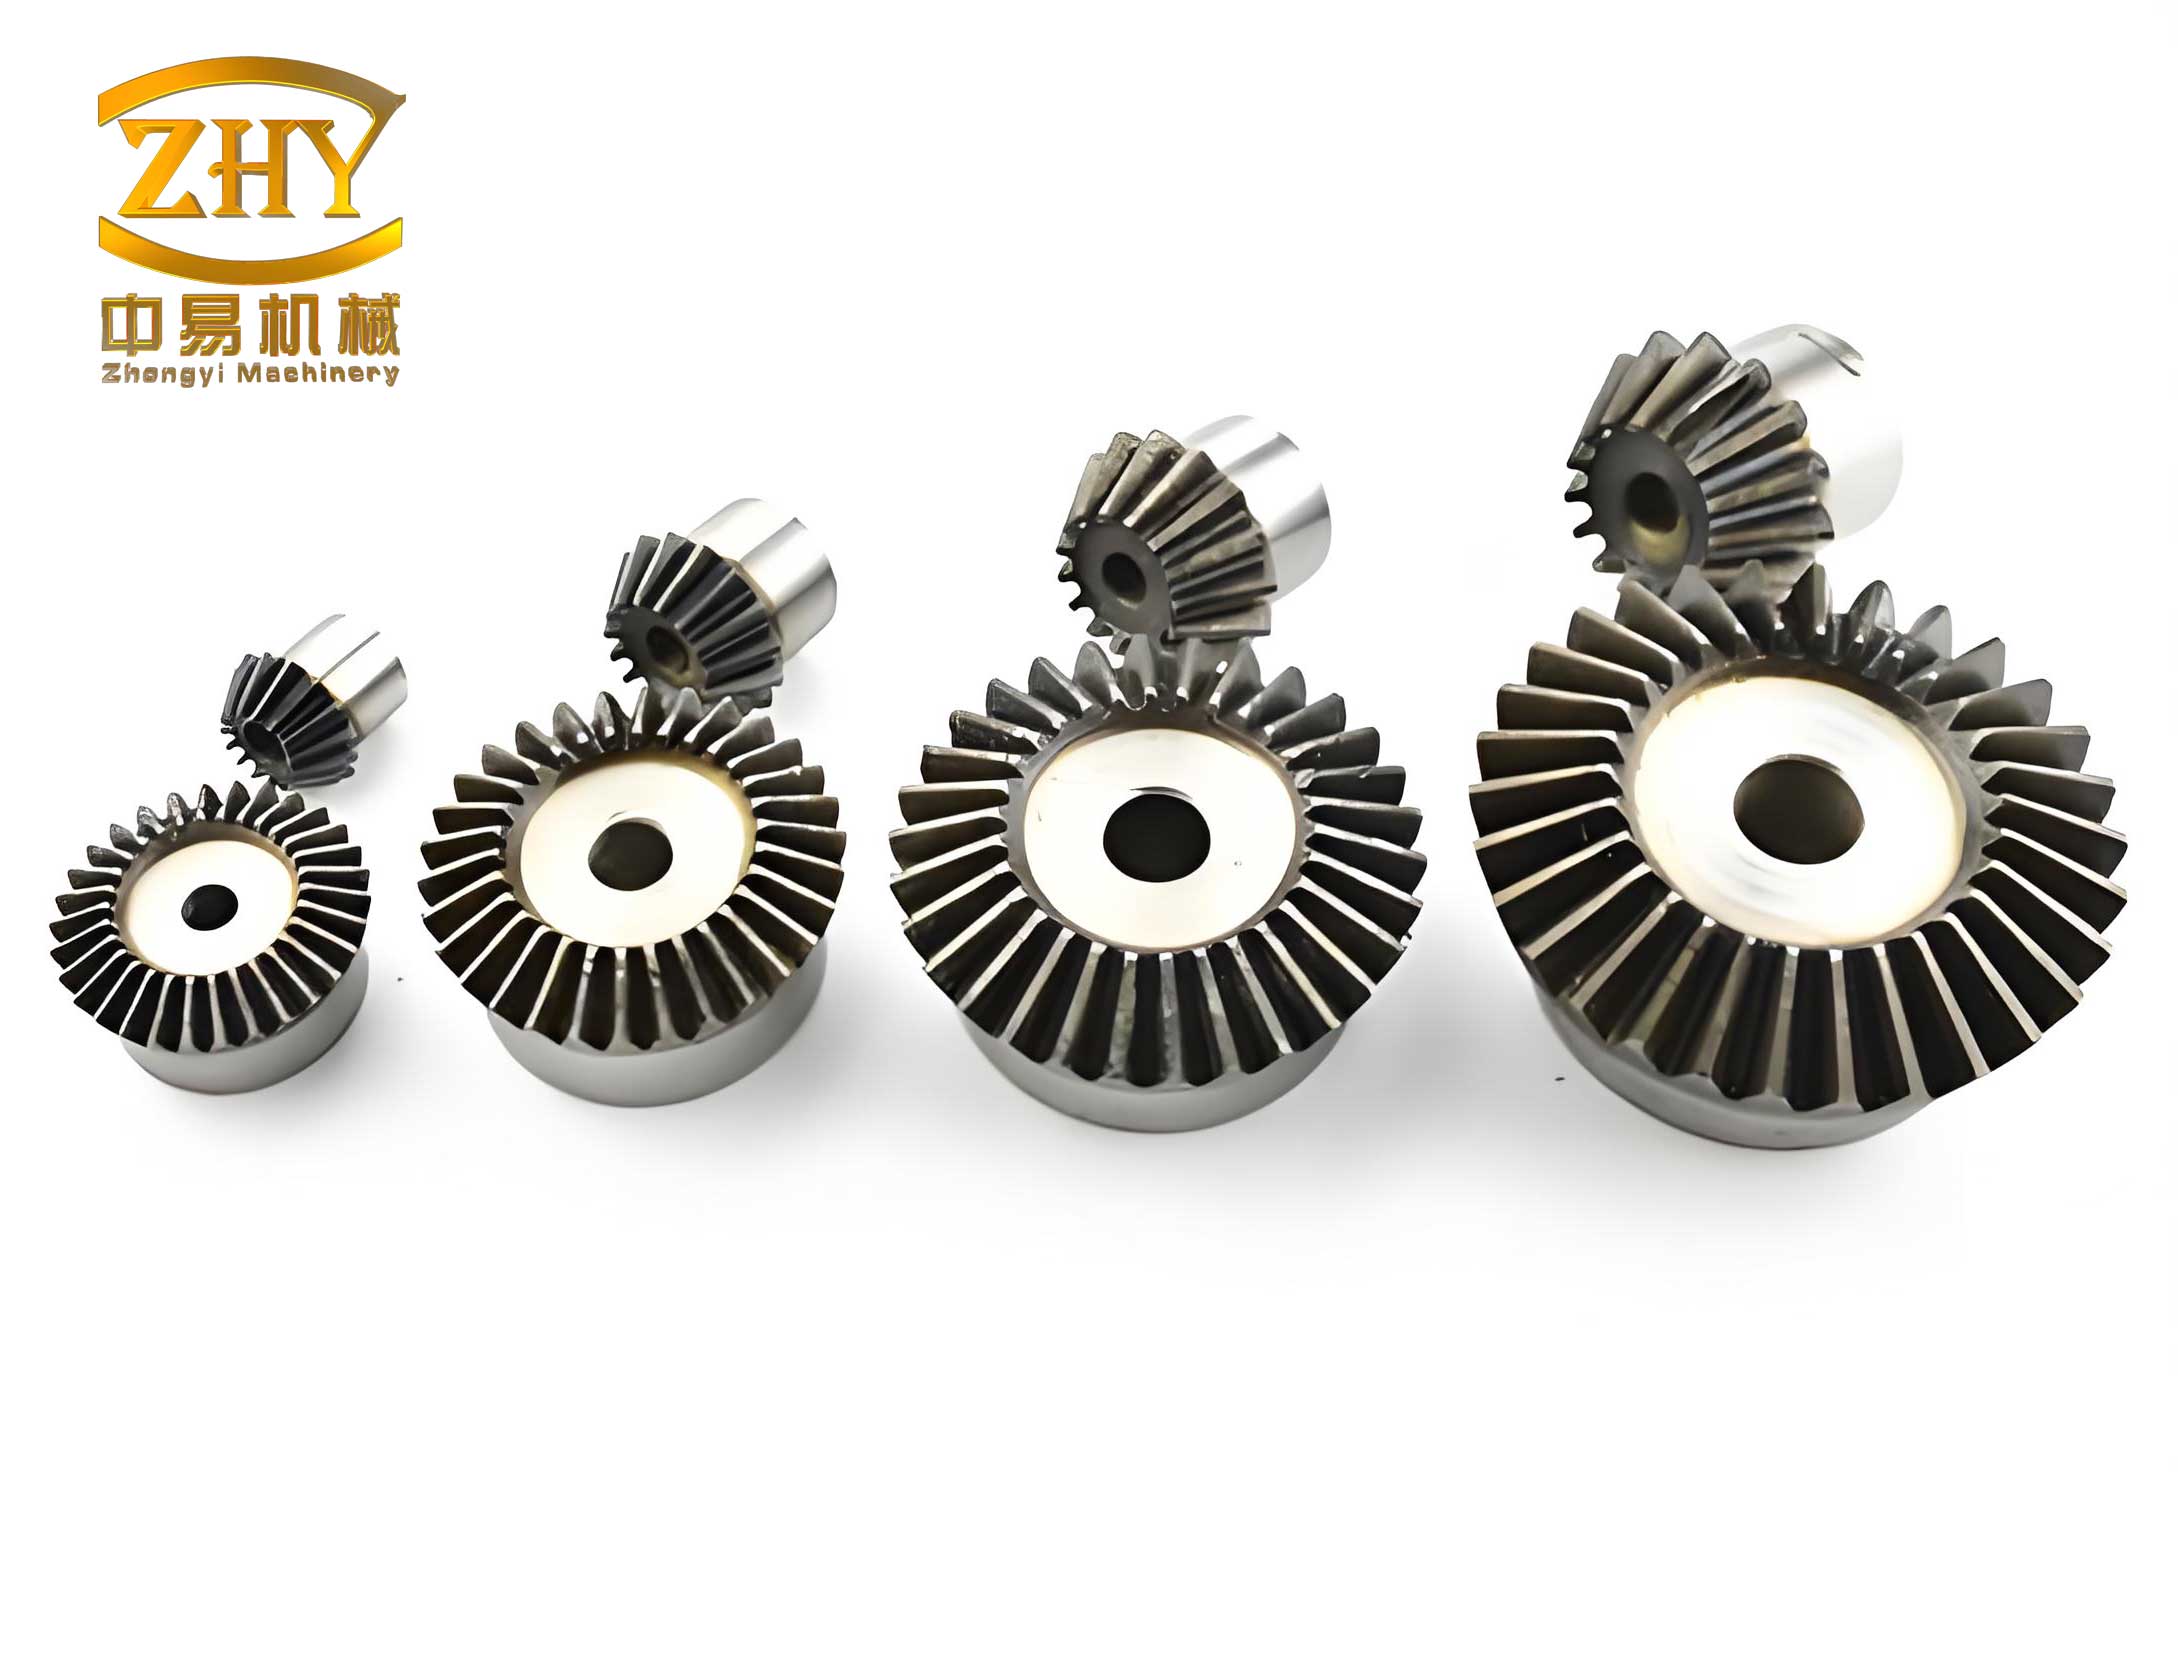
1. Geometric Parametric Modeling of Bevel Gears
An accurate geometric model is foundational for subsequent finite element analysis and optimization. The modeling of the spiral bevel gear pair begins with defining the tooth profile. For the specific case studied, a spherical involute profile is used. The tooth flank is generated by sweeping the transverse tooth profile along a predefined path. The key geometric parameters for the driving and driven bevel gears are parameterized to allow for dynamic adjustments during the optimization process.
| Parameter | Symbol | Value (Driving/Driven) |
|---|---|---|
| Module | $m_n$ | 3.2 mm |
| Number of Teeth | $z$ | 37 / 42 |
| Pressure Angle | $\alpha$ | 20° |
| Spiral Angle | $\beta$ | 35° |
| Addendum Coefficient | $h_a^*$ | 0.85 |
| Tip Clearance Coefficient | $c^*$ | 0.188 |
| Profile Shift Coefficient | $x$ | +0.04 / -0.04 |
| Face Width | $b$ | 24.0 mm |
| Pitch Circle Radius | $R$ | 184.0 mm |
The parametric equations for the tooth profile curves, including the addendum, dedendum, and fillet, are implemented. Separate three-dimensional models for the driving and driven bevel gears are constructed and then assembled in a crossed-axis configuration (typically 90°) to simulate the meshing condition. Interference checks confirm the correctness of the assembly. This parametric modeling approach is crucial as it allows the geometry to be automatically updated during the reliability optimization loop, ensuring model consistency.
2. Failure Mode Analysis for Bevel Gears
For the intermediate gearbox (IGB) bevel gears in an aero-engine, several critical failure modes are identified. We focus on three primary, mechanically-driven modes: bending fatigue fracture, contact fatigue (pitting), and progressive surface wear.
| Failure Mode | Primary Causes | Potential Consequences |
|---|---|---|
| Bending Fatigue Fracture | Resonance, poor contact pattern, excessive load. | Tooth breakage, complete transmission failure. |
| Contact Fatigue (Pitting) | Insufficient lubrication, misalignment, improper case depth. | Surface spalling, increased vibration, debris generation. |
| Progressive Surface Wear | Abrasive particles, poor lubrication, marginal surface hardness. | Increased backlash, loss of transmission accuracy, noise. |
2.1 Bending Strength Analysis
The bending stress at the root of the gear tooth is the governing factor for bending fatigue. To evaluate this, a static finite element analysis (FEA) of the driving bevel gear under an extreme load case is performed. The gear body is fixed at its shaft connection, and a concentrated force representing the maximum meshing load is applied at the worst-case contact point on the tooth flank. The material is AISI 9310 steel. The FEA results show the maximum bending stress occurs at the tooth root fillet. The deterministic safety factor is calculated as:
$$ \text{SF}_{\text{bend}} = \frac{\sigma_{\text{allow}}}{\sigma_{\text{bend, max}}} $$
where $\sigma_{\text{allow}}$ is the allowable bending stress for the material. While the deterministic analysis shows a safe design, it does not account for uncertainties in load, material strength, or geometry, which could push the gear towards failure.
2.2 Contact Strength Analysis
Contact stress, leading to pitting, is analyzed using a dynamic explicit FEA of the gear pair in mesh. A refined mesh is applied to the contacting tooth surfaces. The driving gear is given an angular velocity, and a resisting torque is applied to the driven gear. The analysis simulates several meshing cycles. The Hertzian contact stress distribution is observed to move across the tooth flank. The maximum contact stress $\sigma_{H, max}$ typically occurs at the initiation of contact for a tooth pair. The contact safety factor is:
$$ \text{SF}_{\text{contact}} = \frac{\sigma_{H, \text{allow}}}{\sigma_{H, \text{max}}} $$
Again, the deterministic model meets the strength requirement, but the margin under uncertainty is unknown.
2.3 Wear Analysis
Progressive wear is modeled using the Archard wear equation, which relates wear volume to sliding distance and contact pressure. The wear depth $h$ at a point on the tooth surface after $N$ cycles is given by:
$$ h = k \cdot p \cdot s $$
where $k$ is the dimensionless wear coefficient (dependent on materials and lubrication), $p$ is the contact pressure (from FEA), and $s$ is the cumulative sliding distance at that point. The sliding distance is calculated from the kinematics of the spiral bevel gear mesh. Wear is typically non-uniform, with higher depths near the tooth root and tip, and varying along the face width. The acceptability is judged by comparing the maximum wear depth after a specified service life against a functional limit.
3. Reliability-Based Design Optimization (RBDO) Framework
The deterministic analyses are conservative and do not optimize performance. To systematically improve the design while guaranteeing reliability under uncertainty, an RBDO problem is formulated.
3.1 RBDO Problem Formulation
The objective is to minimize the meshing power loss $P_M$, which is a function of gear geometry and operating conditions, thereby improving transmission efficiency. The design variables $\mathbf{D}_s$ are key geometric parameters that can be controlled during design and manufacturing. For this study, we select the profile shift coefficient $x$, the tip clearance coefficient $c^*$, and the addendum coefficient $h_a^*$.
$$ \mathbf{D}_s = [x, c^*, h_a^*]^T $$
The random variables $\mathbf{X}$ account for uncertainties and are modeled with known probability distributions. Seven significant uncertain parameters are considered.
| Random Variable | Symbol | Distribution | Mean | C.O.V. |
|---|---|---|---|---|
| Pressure Angle | $X_1$ | Normal | 20° | 0.02 |
| Spiral Angle | $X_2$ | Normal | 35° | 0.01 |
| Face Width | $X_3$ | Normal | 24.0 mm | 0.03 |
| Elastic Modulus | $X_4$ | Normal | 200 GPa | 0.002 |
| Poisson’s Ratio | $X_5$ | Normal | 0.3 | 0.02 |
| Input Speed | $X_6$ | Normal | 1880 rad/s | 0.01 |
| Load Torque | $X_7$ | Normal | 200 N·m | 0.02 |
The three failure modes are treated as probabilistic constraints. The target reliability for each is set at 99.87%, corresponding to a target failure probability $P_f^{t} = 1.35 \times 10^{-3}$ for a standard Normal distribution offset of 3. The complete RBDO problem is:
$$
\begin{aligned}
\min_{\mathbf{D}_s} \quad & P_M(\mathbf{D}_s, \mathbf{X}) \\
\text{s.t.} \quad & P_{f_1}(\mathbf{D}_s) = \text{Prob}(g_1(\mathbf{D}_s, \mathbf{X}) \leq 0) \leq P_f^{t} \\
& P_{f_2}(\mathbf{D}_s) = \text{Prob}(g_2(\mathbf{D}_s, \mathbf{X}) \leq 0) \leq P_f^{t} \\
& P_{f_3}(\mathbf{D}_s) = \text{Prob}(g_3(\mathbf{D}_s, \mathbf{X}) \leq 0) \leq P_f^{t} \\
& \mathbf{D}_s^L \leq \mathbf{D}_s \leq \mathbf{D}_s^U
\end{aligned}
$$
where $g_1, g_2, g_3$ are the limit state functions for bending, contact, and wear, respectively. Evaluating these probabilities directly via Monte Carlo Simulation (MCS) integrated with FEA is computationally prohibitive.
3.2 The CIK-RBDO Method
To solve the RBDO problem efficiently, a hybrid method named CIK-RBDO is proposed, combining an Adaptive Kriging (AK) surrogate model with Cross-Entropy based Importance Sampling (CE-IS).
3.2.1 Adaptive Kriging (AK) Surrogate Model: A Kriging model interpolates the true performance function (e.g., bending stress) using a Gaussian process based on a set of training samples. The AK model actively learns by iteratively adding new training points in regions important for reliability assessment (e.g., near the failure boundary), using a learning function like the U-function. The criterion for adding a new sample point $\mathbf{x}_{new}$ is:
$$ U(\mathbf{x}_{new}) = \frac{|\hat{g}(\mathbf{x}_{new})|}{\hat{s}(\mathbf{x}_{new})} $$
where $\hat{g}$ is the predicted mean and $\hat{s}$ is the predicted standard deviation from the Kriging model. A point with $U < 2$ indicates high prediction uncertainty near the limit state and is selected for a true FEA evaluation to update the model.
3.2.2 Cross-Entropy Importance Sampling (CE-IS): Direct MCS is inefficient for estimating small failure probabilities. CE-IS iteratively finds an optimal Importance Sampling Density (ISD) $h^*(\mathbf{x})$ that concentrates samples in the failure region. Starting from the original distribution $f_{\mathbf{X}}(\mathbf{x})$, the CE method updates the parameters $\mathbf{v}$ (e.g., mean $\boldsymbol{\mu}$, covariance $\boldsymbol{\Sigma}$) of a parameterized ISD $h(\mathbf{x}; \mathbf{v})$ to minimize the Kullback-Leibler cross-entropy distance to the optimal ISD. The update formulas for a Gaussian ISD are:
$$
\begin{aligned}
\boldsymbol{\mu}_{new} &= \frac{\sum_{i=1}^{N} I_F(\mathbf{x}_i) W(\mathbf{x}_i) \mathbf{x}_i}{\sum_{i=1}^{N} I_F(\mathbf{x}_i) W(\mathbf{x}_i)} \\
\boldsymbol{\Sigma}_{new} &= \frac{\sum_{i=1}^{N} I_F(\mathbf{x}_i) W(\mathbf{x}_i) (\mathbf{x}_i – \boldsymbol{\mu}_{new})(\mathbf{x}_i – \boldsymbol{\mu}_{new})^T}{\sum_{i=1}^{N} I_F(\mathbf{x}_i) W(\mathbf{x}_i)}
\end{aligned}
$$
where $I_F(\cdot)$ is the failure indicator function, $W(\mathbf{x}_i) = f_{\mathbf{X}}(\mathbf{x}_i) / h(\mathbf{x}_i; \mathbf{v}_{old})$ is the likelihood ratio, and $N$ is the sample size. After convergence, the failure probability is estimated with high efficiency and accuracy using the final ISD:
$$ \hat{P}_f = \frac{1}{N} \sum_{i=1}^{N} I_F(\mathbf{x}_i) W(\mathbf{x}_i) $$
3.2.3 CIK-RBDO Algorithm: The method synergizes AK and CE-IS within a single-loop RBDO framework. For a given design $\mathbf{D}_s$, the AK model is built to approximate the limit state functions. The CE-IS process then uses the AK model to guide its search for the optimal ISD and to compute the failure probability, avoiding costly FEA calls during sampling. This estimated probability is fed to the optimizer (e.g., Sequential Quadratic Programming) to find a new design $\mathbf{D}_s$. The loop continues until convergence.
3.3 Validation via Numerical Example
The effectiveness of CIK-RBDO is first validated on a standard mathematical benchmark problem with three nonlinear probabilistic constraints. The method’s results are compared against a highly accurate nested double-loop method (NDLM) and another AK-based method with crude MCS (AK-MC-RBDO).
| Method | Optimal Design $( \mu_{x_1}, \mu_{x_2} )$ | Optimal Obj. | Max $\epsilon_{P_f}$ | Function Calls (Total) |
|---|---|---|---|---|
| NDLM (Reference) | (3.4515, 3.2776) | 6.7291 | – | > 1.2 Billion |
| AK-MC-RBDO | (3.4530, 3.2747) | 6.7277 | 52.35% | ~ 10,000 |
| CIK-RBDO | (3.4498, 3.2831) | 6.7329 | 3.00% | ~ 10,000 |
The results show that CIK-RBDO achieves accuracy comparable to the prohibitively expensive reference method (NDLM) and superior to AK-MC-RBDO, while maintaining high computational efficiency. The number of performance function evaluations is reduced by orders of magnitude.
4. Reliability Optimization of the Aero-Engine Bevel Gears
Applying the CIK-RBDO method to the bevel gear problem yields the following optimization history and results.
4.1 Optimization Results and Discussion
The optimization successfully reduces the meshing power loss while satisfying all reliability constraints. The convergence history shows a steady decrease in the objective function.
| Design Variable | Initial Value | Optimal Value | Change |
|---|---|---|---|
| Profile Shift Coeff. ($x$) | -0.120 | -0.085 | +29.2% |
| Tip Clearance Coeff. ($c^*$) | 0.120 | 0.162 | +34.8% |
| Addendum Coeff. ($h_a^*$) | 0.850 | 0.830 | -2.4% |
| Meshing Power Loss ($P_M$) | 477.33 W | 438.33 W | -8.17% |
The estimated failure probabilities at the optimal design are all below the target:
$$ \hat{P}_{f_1} = 3.69 \times 10^{-4}, \quad \hat{P}_{f_2} = 4.25 \times 10^{-4}, \quad \hat{P}_{f_3} = 1.05 \times 10^{-4} $$
These values confirm the reliability of the optimized bevel gears meets the 99.87% requirement for each failure mode.
4.2 Verification of the Optimized Design
A deterministic finite element analysis is conducted on the optimized bevel gear geometry to verify its integrity.
- Bending Stress: Maximum root stress $\sigma_{bend, max} = 424 \text{ MPa} < \sigma_{allow} = 643 \text{ MPa}$.
- Contact Stress: Maximum contact stress $\sigma_{H, max} = 459.7 \text{ MPa} < \sigma_{H, allow} = 982.4 \text{ MPa}$.
- Wear Depth: Maximum wear after $10^5$ cycles $h_{max} = 9.1 \mu m$, deemed acceptable for the service life.
These deterministic checks, combined with the probabilistic reliability assessment, provide strong validation that the optimized bevel gear design is both safe and more efficient.
5. Conclusion
This work presents a comprehensive methodology for the reliability-based design optimization of safety-critical aero-engine bevel gears. The key contributions are summarized as follows:
- A parametric modeling and FEA-based framework was established to analyze the bending strength, contact fatigue, and wear behavior of spiral bevel gears.
- A novel hybrid RBDO method, CIK-RBDO, was developed by fusing Adaptive Kriging surrogate modeling with Cross-Entropy guided Importance Sampling. This method significantly enhances computational efficiency while maintaining high accuracy in reliability estimation, as validated by a numerical benchmark.
- The proposed method was successfully applied to optimize an aero-engine bevel gear pair. The results demonstrate that, under stringent reliability constraints (99.87% per failure mode), the meshing power loss can be reduced by 8.17%. This directly translates to improved transmission efficiency and potential fuel savings.
- The optimal design modifies key geometric parameters (profile shift, tip clearance, addendum) to achieve a better balance between load-carrying capacity, contact pattern, and sliding velocity, thereby minimizing losses.
The CIK-RBDO framework provides a powerful and practical tool for the design of high-reliability, high-performance bevel gear transmission systems, effectively managing the uncertainties inherent in their operation and manufacturing. Future work may extend this approach to include system-level dynamics, more complex multi-physics failure modes, and time-dependent reliability analysis. The study underscores the critical importance of moving beyond deterministic design paradigms for advanced mechanical components like bevel gears, embracing probabilistic methods to unlock greater performance and ensure operational safety in demanding aerospace applications.