
In this paper, I present a comprehensive study on the dynamic performance of a herringbone gear transmission system, focusing on the analysis of vibration transmission, multi-objective tooth surface modification optimization, and experimental validation. The work integrates finite element modeling considering fluid-solid coupling, adaptive genetic algorithm optimization, and high-precision measurements using circular grating encoders. The goal is to reduce structural vibration and noise effectively in practical applications such as marine and heavy machinery.
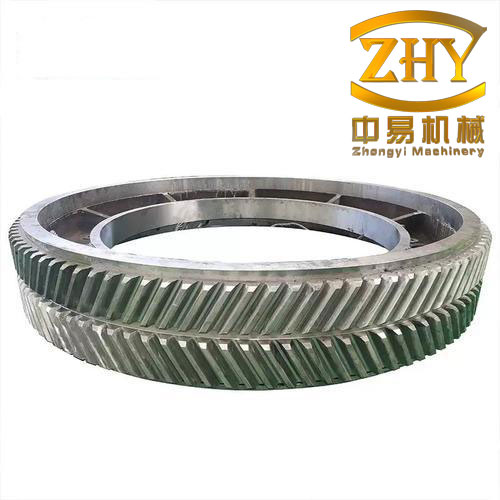
The herringbone gear, also known as a double helical gear, is widely employed due to its high load capacity, smooth transmission, and inherent cancellation of axial thrust forces. However, the vibration and noise generated during operation remain significant concerns. To effectively analyze the vibration transmission path and reasonably predict the structural vibration of the gearbox, I developed a finite element model that accounts for the fluid-solid coupling between the gearbox housing and the lubricating oil. The time-varying dynamic loads computed from a previous model were applied to the coupling reference points at the bearing hole centers. Transient dynamic analysis was then performed using ANSYS to estimate the structural vibration acceleration at key monitoring points on the gearbox.
1. Internal Excitation Mechanisms of Herringbone Gear Vibration
The principal internal excitations affecting the vibration of a herringbone gear system include meshing stiffness fluctuation, meshing impact excitation, and tooth surface friction excitation. Among these, meshing stiffness fluctuation is the dominant factor. In the mixed elastohydrodynamic lubrication (EHL) state, the instantaneous composite friction coefficient on the tooth surface can be expressed as:
$$ \mu_{ML} = f_{\alpha} \mu_{BL} + (1 – f_{\alpha}) \mu_{EL} $$
where \(\mu_{ML}\) is the friction coefficient under mixed lubrication, \(\mu_{EL}\) and \(\mu_{BL}\) are those under full-film and boundary lubrication respectively, and \(f_{\alpha}\) is the load distribution ratio as defined by Zhu et al.
To quantify the contributions of each excitation, I computed the root mean square (RMS) of the relative vibration acceleration along the line of action for a single-stage herringbone gear pair. The gear parameters are listed in Table 1.
| Parameter | Pinion | Gear |
|---|---|---|
| Normal module (mm) | 6 | 6 |
| Transverse pressure angle (°) | 20 | 20 |
| Helix angle (°) | 24.43 | –24.43 |
| Number of teeth | 17 | 44 |
| Face width (mm) | 55 | 55 |
| Load torque (Nm) | – | 828 |
| Input speed (r/min) | 2500 | – |
| Hand of teeth | Left & Right | Right & Left |
At the rated input speed of 2500 r/min, the RMS vibrations from individual excitations were: 16.51 m/s² due to meshing stiffness variation, 10.05 m/s² from meshing impact, and 4.63 m/s² from tooth friction. This indicates that stiffness excitation is the primary contributor, followed by impact and friction. The equivalent friction torque coefficient for each meshing position can be expressed as:
$$ \chi_{pk} = \sum_{i=1}^{n} \sum_{j=1}^{\tau_{k+5(i-1)}} \lambda_{k+5(i-1),j} \cdot \mu_{k+5(i-1),j} \cdot X_{k+5(i-1),j} $$
where \(\lambda\) is the load distribution factor, \(\mu\) is the friction coefficient, and \(X\) is the moment arm of the friction force about the pinion center.
2. Fluid-Structure Coupling and Gearbox Vibration Prediction
Unlike most existing studies that ignore the effect of lubricating oil on gearbox dynamics, I considered the fluid-solid coupling between the gearbox housing and the oil. The 3D model of the gearbox was pre-checked using a Pro/E secondary development tool to avoid mesh distortion. The final finite element mesh consisted of 78,378 solid elements (SOLID45) for the housing and 9,770 fluid elements (FLUID30) for the oil. The fluid-structure interface was defined using the FSI command in ANSYS. All degrees of freedom at the base mounting feet were constrained as boundary conditions. The masses of gears and shafts were lumped onto the coupling reference points at the bearing bore centers.
The time-varying dynamic loads computed from the gear dynamics model were applied to these reference points. Transient dynamic analysis was performed iteratively until a steady-state condition was met, defined by:
$$ \frac{|S_{iE} – S_{iS}|}{S_{iE}} \le \varepsilon $$
where \(S_{iE}\) and \(S_{iS}\) are the displacements at the end and start of the i-th periodic cycle, and \(\varepsilon\) is the tolerance.
The vertical vibration acceleration at the gearbox foot (point M) was selected as a key indicator of structural noise. The material properties of the gearbox and oil are listed in Table 2.
| Component | Elastic Modulus (N/m²) | Poisson’s Ratio | Density (kg/m³) | Sound Speed in Fluid (m/s) |
|---|---|---|---|---|
| Gearbox Housing | 2.06×10¹¹ | 0.3 | 7.8×10³ | – |
| Lubricating Oil | – | – | 8.8×10² | 1.53×10³ |
3. Multi-Objective Three-Dimensional Tooth Surface Modification
To reduce vibration, I applied a three-dimensional tooth surface modification (profile and lead crowning) on the pinion. The modification surface was modeled using cubic B-spline fitting with an accuracy of better than 1 μm. The optimization was performed using an improved adaptive genetic algorithm with four dynamic objectives: amplitude of loaded transmission error (representing stiffness fluctuation), meshing impact force, friction equivalent coefficient fluctuation, and RMS of relative vibration acceleration along the line of action. The objective function is:
$$ \min f(y) = w_1 \frac{F_e}{F_{e0}} + w_2 \frac{F_f}{F_{f0}} + w_3 \frac{F_I}{F_{I0}} + w_4 \frac{F_a}{F_{a0}} $$
where \(w_1\) to \(w_4\) are weights (0.3, 0.1, 0.2, 0.4 respectively) based on the contribution analysis. The variables are the modification amounts and lengths at the tooth tip, root, and both ends of the face width. The constraints are:
$$ \begin{aligned} y_1 – y_3 &\le Q_{y0}, \quad l_{y0} \le y_2, y_4 \le l_{y0} \\ y_5 – y_7 &\le Q_{z0}, \quad l_{z0} \le y_6, y_8 \le l_{z0} \end{aligned} $$
After optimization, the optimal modification parameters are given in Table 3. The modification surface is a fourth-order parabola.
| Profile Direction | y1/μm | y2/mm | y3/μm | y4/mm | Parabola Order |
|---|---|---|---|---|---|
| 16 | 1.6 | 18 | 3.2 | 4 | |
| Lead Direction | y5/μm | y6/mm | y7/μm | y8/mm | Parabola Order |
| 14 | 11.2 | 14 | 11.2 | 4 |
With the modified tooth surface, the RMS of relative vibration acceleration along the line of action decreased from 40.51 m/s² to 32.40 m/s². The fundamental frequency component (708 Hz) reduced from 27.06 m/s² to 22.62 m/s², and the second harmonic from 5.9 m/s² to 2.6 m/s². At the gearbox foot (point M), the RMS vertical vibration decreased from 3.94 m/s² to 3.08 m/s². The fundamental frequency amplitude dropped from 2.66 m/s² to 2.36 m/s², and the second harmonic from 0.30 m/s² to 0.21 m/s².
4. Experimental Verification
To validate the theoretical analysis and the effect of tooth surface modification, a closed-power-flow test rig was constructed. The test gears were manufactured to Grade 5 accuracy (DIN standard) and run-in with grinding paste. The gear parameters are the same as in Table 1.
4.1 Test Setup and Measurement Principle
The test rig consists of a DC motor, a slave gearbox, a torque meter, a torsion shaft, a loading device, the test gearbox, and circular grating encoders. The encoders (Heidenhain ROD280) have 18,000 lines and a resolution of ±5 arc-seconds. The acceleration sensors (Dytran-3035B1) have a mass of 2.5 g and a frequency range of 0.5 to 10 kHz.
The angular transmission error was measured by the encoders mounted on the pinion and gear shafts. The sinusoidal signals from the encoders were sampled by an Altech PCI8502 acquisition card. The angular displacement at each sampling instant was calculated using the zero-crossing detection method:
$$ \varphi(t_{ij}) = \frac{2\pi i}{N} + \frac{\theta(t_{ij}) – \theta(t_{i,1})}{2\pi} \cdot \frac{360}{N} $$
where \(N\) is the number of grating lines, and \(\theta(t_{ij})\) is the arc value at the j-th sample of the i-th sine wave. The relative vibration acceleration along the line of action is then obtained by double differentiation:
$$ a(t) = \frac{\pi}{180} \left[ r_{b1} \ddot{\varphi}_1(t) – r_{b2} \ddot{\varphi}_2(t) \right] $$
where \(r_{b1}\) and \(r_{b2}\) are the base circle radii, and \(\varphi_1\), \(\varphi_2\) are the actual rotational angles.
Additionally, vibration accelerations at six points on the gearbox (two bearing caps per shaft location and two feet) were measured using accelerometers and processed by an M+P data acquisition system.
4.2 Results and Comparison
The actual tooth surface of the modified pinion was inspected using a Klingelnberg P100 gear analyzer. The maximum profile deviation was 4.1 μm and the maximum lead deviation was 3.6 μm, both within Grade 5 tolerance. I then computed the vibration response using the measured tooth surface data by superimposing the error surface onto the theoretical modification surface. The RMS vibration from the actual surface was 35.21 m/s², which is within 8% of the theoretical value (32.40 m/s²), confirming the high manufacturing accuracy. The dynamic transmission error measured by the encoders clearly shows the tooth-meshing frequency and shaft frequency components.
Table 4 summarizes the RMS vibration accelerations at various locations before and after modification, comparing theoretical and experimental values.
| Measurement Location | Theoretical (Unmodified) | Theoretical (Modified) | Experimental (Unmodified) | Experimental (Modified) |
|---|---|---|---|---|
| Line-of-action relative vibration | 40.51 | 32.40 | 44.30 | 34.83 |
| Left bearing (pinion end) | 5.40 | 4.22 | 6.21 | 4.81 |
| Left bearing (gear end) | 4.27 | 3.39 | 4.94 | 3.91 |
| Left gearbox foot | 3.94 | 3.08 | 4.35 | 3.37 |
| Right bearing (pinion end) | 5.47 | 4.35 | 6.25 | 4.95 |
| Right bearing (gear end) | 4.40 | 2.55 | 5.14 | 4.04 |
| Right gearbox foot | 4.01 | 3.22 | 4.63 | 3.58 |
It is evident that the measured data show a consistent trend with theoretical predictions. The vibration at the gear mesh (line-of-action) is highest, followed by bearing locations, and lowest at the foot, which matches the vibration transmission path: from tooth meshing excitation through shafts, bearings, and finally to the housing.
To comprehensively evaluate the modification effect, I calculated the average RMS of all measured locations. The theoretical overall average decreased from 9.71 m/s² to 7.29 m/s², a reduction of 25.1%. The experimental overall average decreased from 10.83 m/s² to 8.49 m/s², a reduction of 21.2%. The slight discrepancy between theory and experiment is attributed to assembly errors and other system nonlinearities not considered in the model.
5. Conclusions
In this work, I have systematically analyzed the vibration transmission characteristics of a herringbone gear system. The key findings are:
- Meshing stiffness fluctuation is the dominant excitation source for herringbone gear vibration, followed by meshing impact and tooth friction. This hierarchical understanding guided the weighting in the optimization process.
- A fluid-structure coupled finite element gearbox model was established, which accounts for the influence of lubricating oil on the dynamic response. The computed structural vibrations at the gearbox foot correlate well with experimental trends.
- Three-dimensional tooth surface modification, optimized using an improved adaptive genetic algorithm with multi-dynamic objectives, significantly reduced both the meshing-line relative vibration and the gearbox foot vibration. The experimental reduction of 21.2% in overall vibration validates the effectiveness of the approach.
- The use of high-precision circular grating encoders enabled direct measurement of the dynamic transmission error and relative vibration along the line of action, providing a reliable means to quantify the source vibration of herringbone gear systems.
The methodology presented here offers a practical framework for the design and optimization of herringbone gear transmissions with improved vibration and noise performance.