
The precise characterization of time-varying meshing parameters under loaded conditions is a fundamental prerequisite for accurately modeling the internal excitations within a hypoid gear system’s dynamic model. It also serves as the primary basis for evaluating their dynamic meshing performance. Compared to cylindrical gears, hypoid gears possess more complex tooth surface geometry and spatial characteristics. This complexity renders analytical methods, such as the Ishikawa formula or Weber’s energy method, which are often used for spur gears, less suitable for direct stress-strain calculation. Experimental measurement techniques also present significant challenges. Consequently, the Finite Element Method (FEM) has become the dominant technical approach for determining the loaded meshing parameters of hypoid gears.
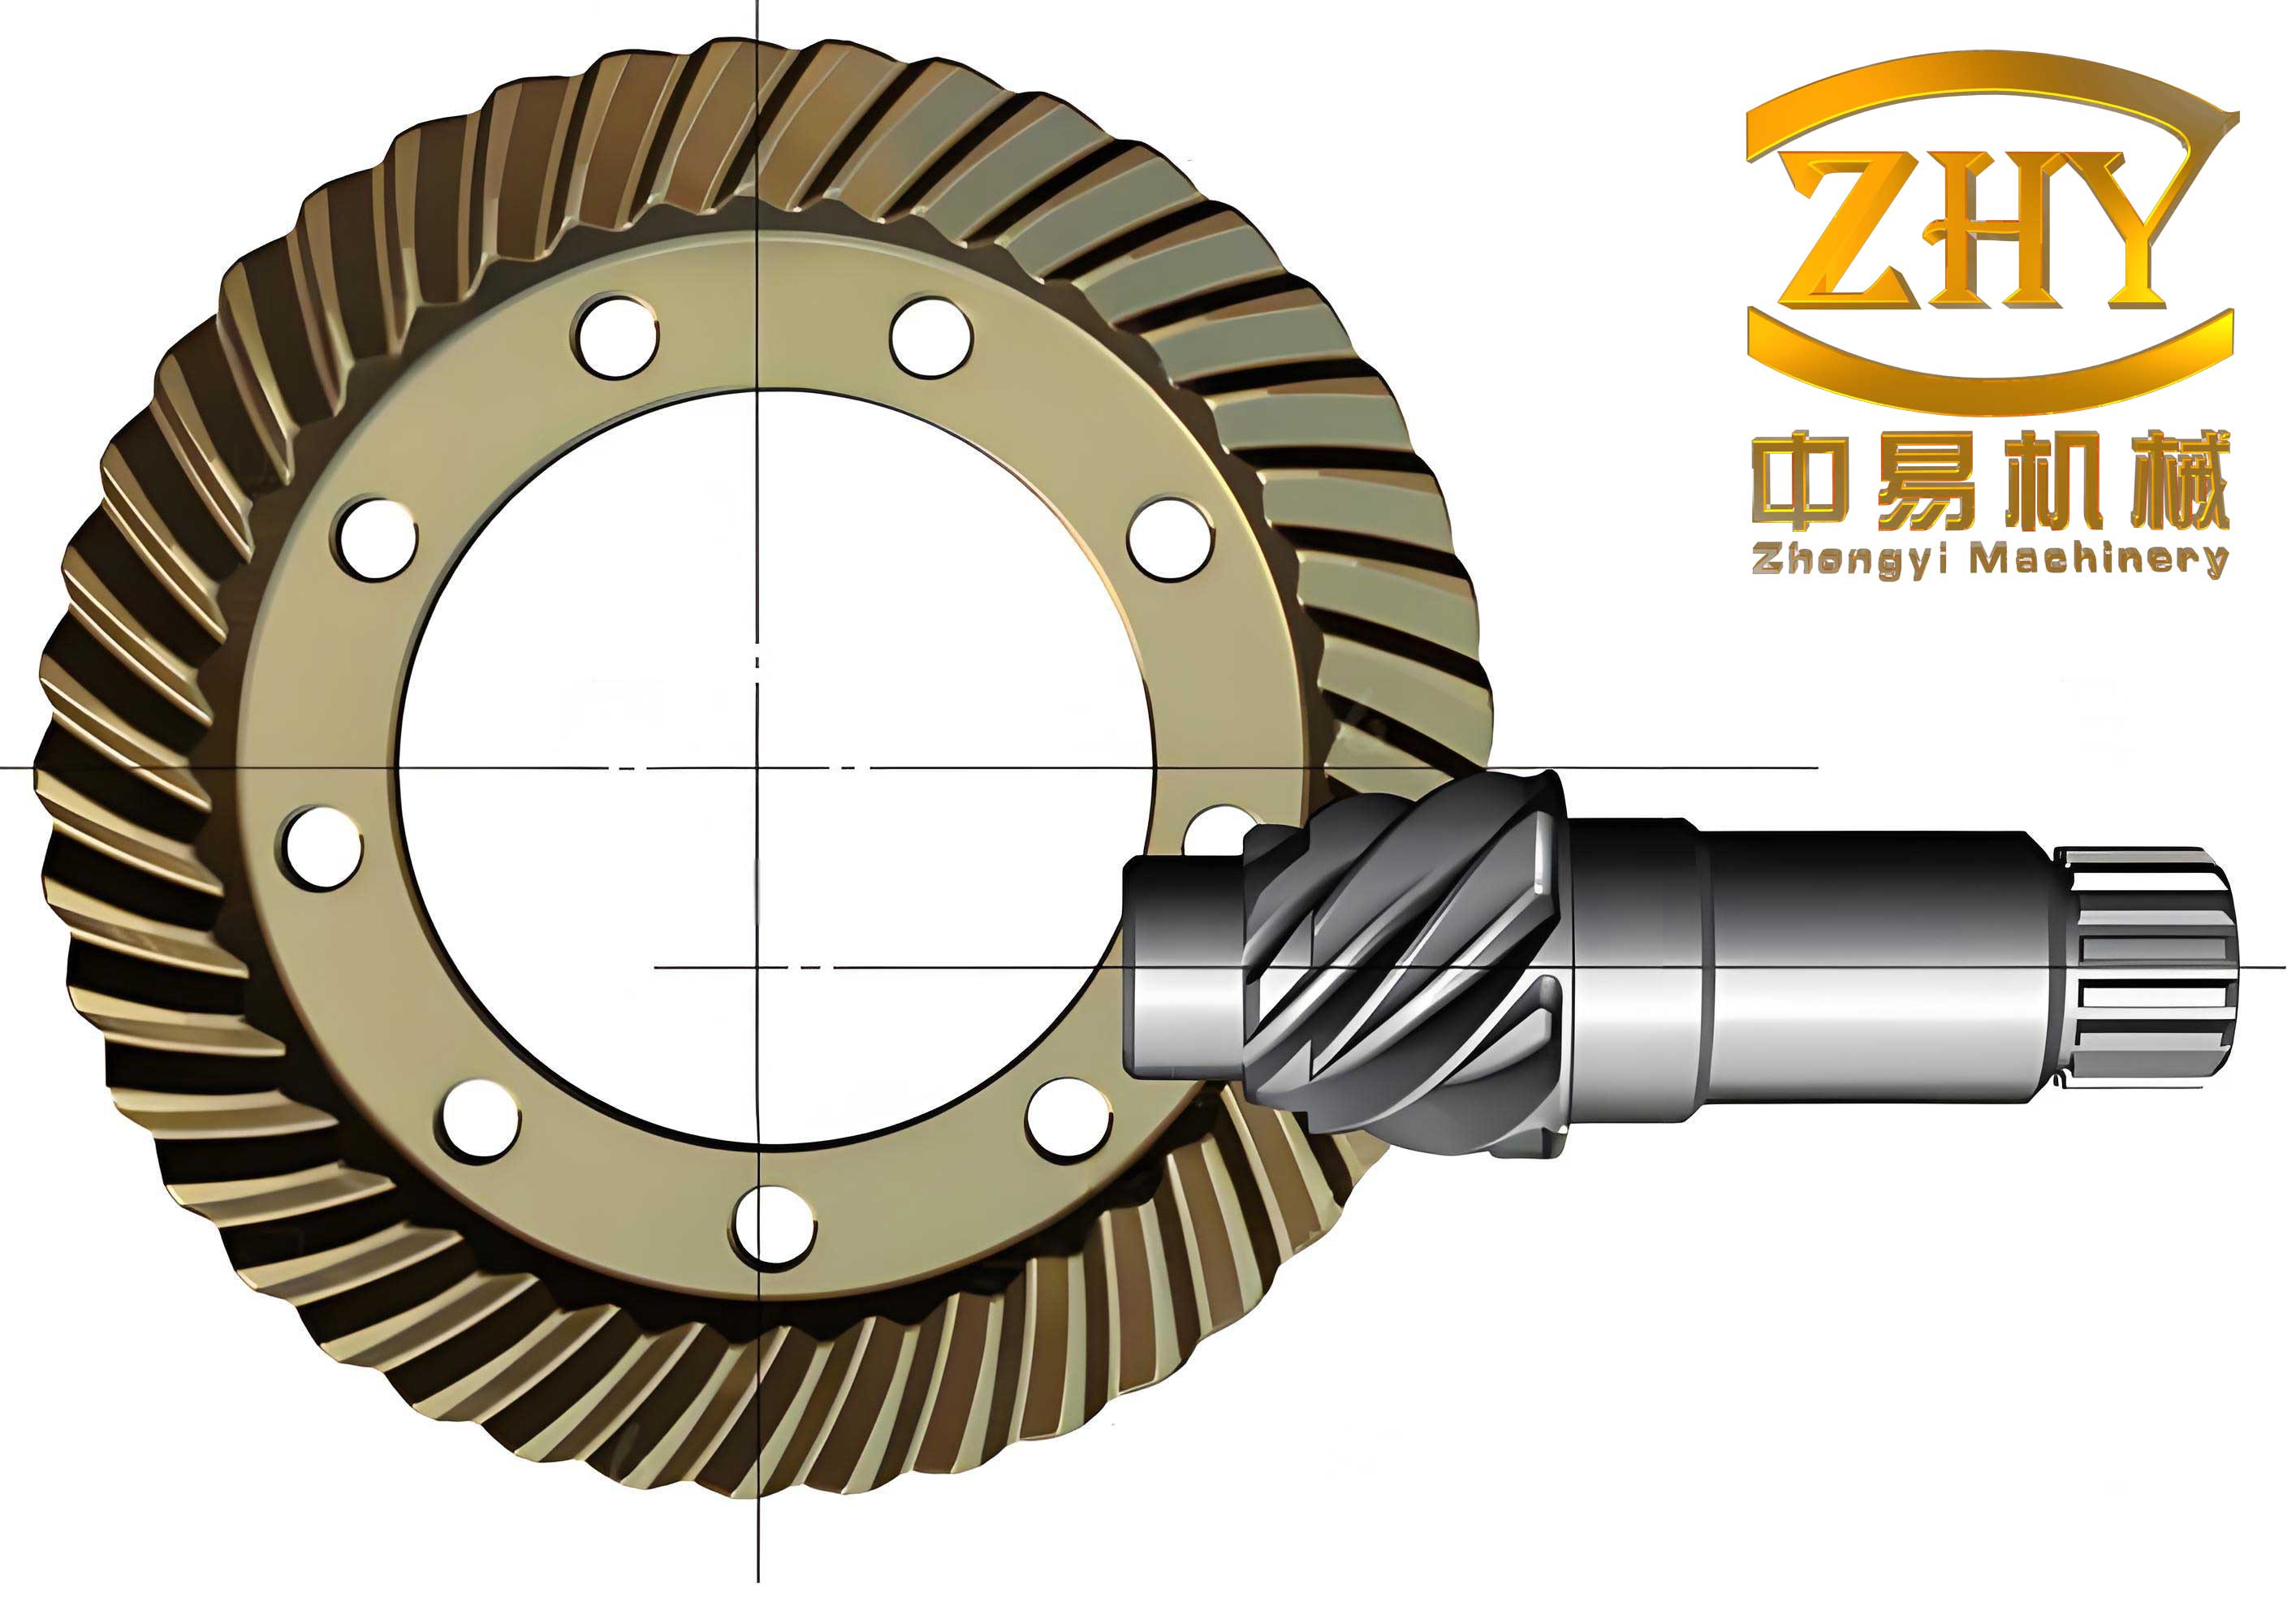
While previous studies have proposed methods for calculating meshing stiffness, often involving linear superposition or partial extraction of deformations, these approximations can introduce errors. To address this, my research focuses on performing a detailed Loaded Tooth Contact Analysis (LTCA) on a hypoid gear pair. From the results, I extract parameters such as nodal coordinates, rotation radii, and gear angles to compute the true comprehensive tooth deformation. This is achieved by comparing the theoretical displacement from free rotation with the actual displacement from LTCA, which includes effects from contact, bending, and shear. Combining this with the equivalent meshing force yields the accurate time-varying meshing stiffness. Furthermore, I investigate the influence of load magnitude on key meshing parameters, revealing the evolution of contact patterns, loaded transmission error, actual contact ratio, equivalent meshing force, comprehensive elastic deformation, and meshing stiffness with changing load.
Mathematical Description of Time-Varying Meshing Parameters
Equivalent Meshing Force and Point
During the meshing of hypoid gears, multiple tooth pairs are typically in contact simultaneously. For a given moment in time, let us consider the contact on a single tooth pair. An equivalent meshing force vector \(\vec{f_i} (f_{ix}, f_{iy}, f_{iz})\) acts at the midpoint of the instantaneous contact ellipse’s major axis on the tooth surface. Its direction is along the surface normal at that point. The resultant force from all contacting tooth pairs at time \(t\), \(\vec{F_Q}(t)\), is the vector sum of all individual \(\vec{f_i}\).
$$
\vec{F_Q}(t) = \sum_{i=1}^{q(t)} \vec{f_i}
$$
where \(q(t)\) is the number of contacting tooth pairs at time \(t\). The magnitude is \(|\vec{F_Q}| = \sqrt{F_x^2 + F_y^2 + F_z^2}\). The direction cosines \((n_x, n_y, n_z)\) of the resultant force are given by \(n_k = F_k / |\vec{F_Q}|\) for \(k = x, y, z\).
Since contact occurs at multiple points, a single equivalent meshing point \(P_Q\) is defined based on force and moment equilibrium. Its position vector \(\vec{R_Q}(x_Q, y_Q, z_Q)\) in the meshing coordinate system is calculated as:
$$
x_Q = \frac{\sum_{i=1}^{q} (r_{ix} |\vec{f_i}|)}{\sum_{i=1}^{q} |\vec{f_i}|}, \quad y_Q = \frac{M_x + F_z x_Q}{F_z}, \quad z_Q = \frac{M_y + F_x x_Q}{F_x}
$$
where \(r_{ix}\) is the x-coordinate of the action point of \(\vec{f_i}\), and \(M_x\), \(M_y\) are the moments of the resultant force \(\vec{F_Q}\) about the x and y axes, respectively. This point is not physically real but is a computational tool that represents the effective location of the total mesh load. The trajectory of \(P_Q\) over a meshing cycle is an indicator of meshing stability.
Transmission Error Function
Hypoid gear pairs operate under point contact with localized conjugation, leading to a time-varying transmission ratio. The transmission error (TE) is defined as the deviation of the driven gear’s actual angular position from its theoretical position when the driver gear rotates uniformly. For a pinion (gear 1) and gear (gear 2), it is expressed as:
$$
\delta(\phi_1) = (\phi_2 – \phi_2^0) – \frac{z_1}{z_2} (\phi_1 – \phi_1^0)
$$
where \(z_1\) and \(z_2\) are the numbers of teeth, \(\phi_1^0\) and \(\phi_2^0\) are the initial reference angular positions, and \(\phi_1\) and \(\phi_2\) are the instantaneous angles. Under load, the contact pattern shifts, altering the instantaneous center of rotation and thus the loaded TE, which differs from the unloaded TE calculated via Tooth Contact Analysis (TCA). The loaded TE is a direct output of LTCA.
Comprehensive Elastic Deformation
The total elastic deformation at the mesh, \(u_n\), is the sum of deformations from both gears, each comprising contact (Hertzian) deformation \(u_h\), bending deformation \(u_b\), and shear deformation \(u_s\):
$$
u_n = \sum_{i=1}^{2} (u_{h_i} + u_{b_i} + u_{s_i}) = \sum_{i=1}^{2} U_i
$$
Calculating \(u_h\), \(u_b\), and \(u_s\) separately for complex hypoid gear teeth is challenging. My approach bypasses this by directly computing the combined deformation \(U_i\) for each gear. The real displacement of a surface node results from rigid-body rotation plus this elastic deformation. By extracting the coordinates of a node at the start of meshing \(P_k(0)\) and at time \(t\), \(P_k(t)\), from LTCA, the actual displacement \(S_k(t)\) is the Euclidean distance between them. The theoretical displacement \(s_k(t)\) due solely to free rotation is calculated using the node’s rotation radius \(r_k\) and the gear’s angular rotation \(\phi(t)\): \(s_k(t) = 2 r_k(t) \cdot \sin(\phi(t)/2)\). The average comprehensive deformation for a gear at time \(t\) is then:
$$
U(t) = \frac{\sum_{j=1}^{m} [S_j(t) – s_j(t)]}{m}
$$
where \(m\) is the number of contacting nodes on that gear’s surface. The total mesh deformation is \(u_n(t) = U_{gear}(t) + U_{pinion}(t)\).
Time-Varying Mesh Stiffness
The instantaneous mesh stiffness \(k_n(t)\) is defined as the ratio of the magnitude of the equivalent meshing force to the comprehensive elastic deformation at that instant:
$$
k_n(t) = \frac{|\vec{F_Q}(t)|}{u_n(t)}
$$
This method provides a direct and accurate calculation of the mesh stiffness for hypoid gears without requiring separate stiffness calculations for individual teeth or assuming linear superposition.
Loaded Tooth Contact Analysis Methodology
Gear Pair Specifications
The analysis was conducted on an automotive rear axle hypoid gear drive. The primary geometric parameters are summarized in Table 1.
| Parameter | Pinion (Drive) | Gear (Driven) |
|---|---|---|
| Hand of Spiral | Left | Right |
| Number of Teeth | 10 | 41 |
| Shaft Angle | 90° | |
| Offset | -31.8 mm (Pinion below center) | |
| Mean Spiral Angle | 49.98° | 29.00° |
| Pitch Angle | 15.53° | 73.70° |
The machining parameters for the gear and pinion, generated using the Formate and Generate methods respectively, are essential for defining the tooth geometry but are omitted here for brevity.
Finite Element Model Construction and Analysis
The tooth surfaces were generated based on the gear geometry and manufacturing principles. A 3D model was created and discretized into finite elements. To balance computational accuracy and cost, a model consisting of the full pinion and a sector of the gear (18 teeth out of 41) was used. The mesh was refined in the contact-prone regions (tooth surfaces and fillets) using a sub-structuring technique, while coarser elements were used elsewhere. The final model comprised approximately 124,800 elements for the pinion and 201,600 for the gear sector.
The pre-processing involved defining material properties (steel: E=209 GPa, ν=0.3), element type (C3D8R), contact interaction (Hard Contact with finite sliding), and boundary conditions. The analysis was performed as a static, implicit procedure with geometric nonlinearity enabled. The loading process was divided into three steps to ensure convergence: 1) Initial positioning, 2) Application of a small torque to eliminate backlash and establish initial contact, and 3) Application of the main drive rotation (200 rpm at the pinion) and constant load torque (varied from 100 to 6000 Nm at the gear). Output variables included nodal coordinates, contact status, contact forces, and reaction moments.
LTCA Results and Parameter Evolution Under Load
Validation via Contact Pattern
The LTCA results were first validated by comparing the simulated dynamic contact pattern on the gear tooth surface with the pattern obtained from a physical loaded rolling test. The simulation successfully replicated the characteristic motion of the contact ellipse from the toe towards the heel of the gear tooth, showing excellent agreement with the experimental imprint, thereby verifying the accuracy of the LTCA model.
Evolution of Contact Pattern and Basic Meshing Parameters
The contact pattern evolution with increasing load is a critical visual indicator. Under low loads (e.g., 100 Nm), the contact ellipse is small and located near the center of the tooth. As the load increases, the ellipse grows in size, extending towards both the toe and heel of the gear tooth. At very high loads, the contact area covers a significant portion of the active tooth surface. This expansion directly influences all other meshing parameters.
The equivalent meshing force \(|\vec{F_Q}(t)|\) shows a nearly proportional increase with the applied load torque. Its waveform maintains a periodic fluctuation synchronous with the mesh frequency across all load levels.
The loaded transmission error exhibits a non-linear evolution with load. As shown in Table 2, the peak-to-peak amplitude of the TE fluctuation first decreases and then increases. At low loads, increasing the load moves the contact into the designed central zone of the tooth surface, optimizing contact and minimizing TE variation. At higher loads, the contact spreads to the less-perfect geometry near the edges of the tooth, reintroducing larger kinematic errors and increasing TE fluctuation.
| Load Torque (Nm) | Mean Mesh Force (kN) | TE Peak-Peak (arc-sec) | Mean Deformation \(u_n\) (μm) | Mean Stiffness \(k_n\) (N/μm) | Actual Contact Ratio |
|---|---|---|---|---|---|
| 100 | ~1.2 | 85 | ~4.5 | ~270 | ~1.15 |
| 1000 | ~12.5 | 62 | ~22.0 | ~570 | ~2.05 |
| 4000 | ~48.0 | 58 | ~55.0 | ~875 | ~2.45 |
| 6000 | ~70.0 | 78 | ~78.0 | ~900 | ~2.50 |
The actual contact ratio, representing the average number of tooth pairs in contact, also evolves non-linearly. It increases sharply at low loads as the contact ellipses grow enough to bridge the gaps between successive teeth. Once the load is sufficient to maintain nearly continuous multi-tooth contact, further increases in load yield only marginal gains in the contact ratio, as seen in the table above.
Evolution of Deformation and Stiffness
The comprehensive elastic deformation \(u_n(t)\) increases with load, both in its mean value and its fluctuation amplitude. This is expected as higher contact forces cause greater deflection.
The calculated time-varying mesh stiffness \(k_n(t)\) reveals profound insights. Firstly, its mean value increases with load (Table 2), which is attributed to the load-dependent nature of contact stiffness (Hertzian contact) and the fact that under higher loads, contact occurs over a larger area and engages thicker sections of the tooth profile near the heel, which are more resistant to bending.
Secondly, and more importantly, the *shape* of the stiffness curve within a single mesh cycle undergoes a significant transformation. This evolution is summarized in Table 3. At low loads, the stiffness curve is relatively symmetric or slightly skewed. As the load increases, the curve becomes markedly asymmetric. The peak stiffness occurs progressively earlier in the meshing cycle. This is a direct consequence of the contact pattern shift: higher loads cause the initial contact to occur closer to the heel (thicker, stiffer part of the tooth) earlier in the engagement process. The engagement then progresses towards the slightly less stiff central and toe regions. This load-induced asymmetry in the stiffness excitation is a crucial nonlinear characteristic of hypoid gears that must be captured for accurate dynamic analysis.
| Load Level | Stiffness Curve Shape | Peak Stiffness Timing | Primary Cause |
|---|---|---|---|
| Low (e.g., 100 Nm) | Near-symmetric, lower amplitude | Mid to late cycle | Contact primarily in central designed zone. |
| Medium (e.g., 2000 Nm) | Clearly asymmetric | Early-Mid cycle | Contact expands, engaging heel region earlier. |
| High (e.g., 6000 Nm) | Highly asymmetric, plateau-like | Early cycle | Contact covers large area from heel; high constant flank contact. |
Conclusion
Through detailed Loaded Tooth Contact Analysis of hypoid gears under a wide range of loads, this study has derived accurate time-varying meshing parameters, focusing on a precise calculation of comprehensive tooth deformation. The main conclusions are as follows:
- Parameter Characteristics: Under any constant load, parameters such as equivalent meshing force, loaded transmission error, comprehensive deformation, and mesh stiffness for hypoid gears exhibit periodic fluctuations synchronized with the mesh frequency, without sharp discontinuities.
- Non-linear Evolution with Load: The relationship between load and meshing parameters is strongly non-linear. The actual contact ratio increases rapidly at low loads but saturates at higher loads. The loaded transmission error fluctuation amplitude shows a “V-shaped” trend (decreasing then increasing) with respect to load, indicating an optimal load range for minimal kinematic error.
- Critical Stiffness Evolution: The mean mesh stiffness increases with load. More significantly, the waveform of the time-varying stiffness undergoes a fundamental change, evolving from a relatively symmetric shape to a highly asymmetric one where the peak stiffness occurs earlier in the meshing cycle. This asymmetry is due to the load-induced shift of the contact pattern towards the stiffer heel region of the tooth.
- Implications for Dynamics: The load-dependent nature of transmission error and, most notably, the significant change in the amplitude and *shape* of the mesh stiffness function highlight strong nonlinearities in the gear mesh interface. These features must be accurately modeled for realistic dynamic simulation and vibration analysis of hypoid gear systems across their operational load spectrum. The methodology presented provides a reliable foundation for obtaining these essential input parameters.