
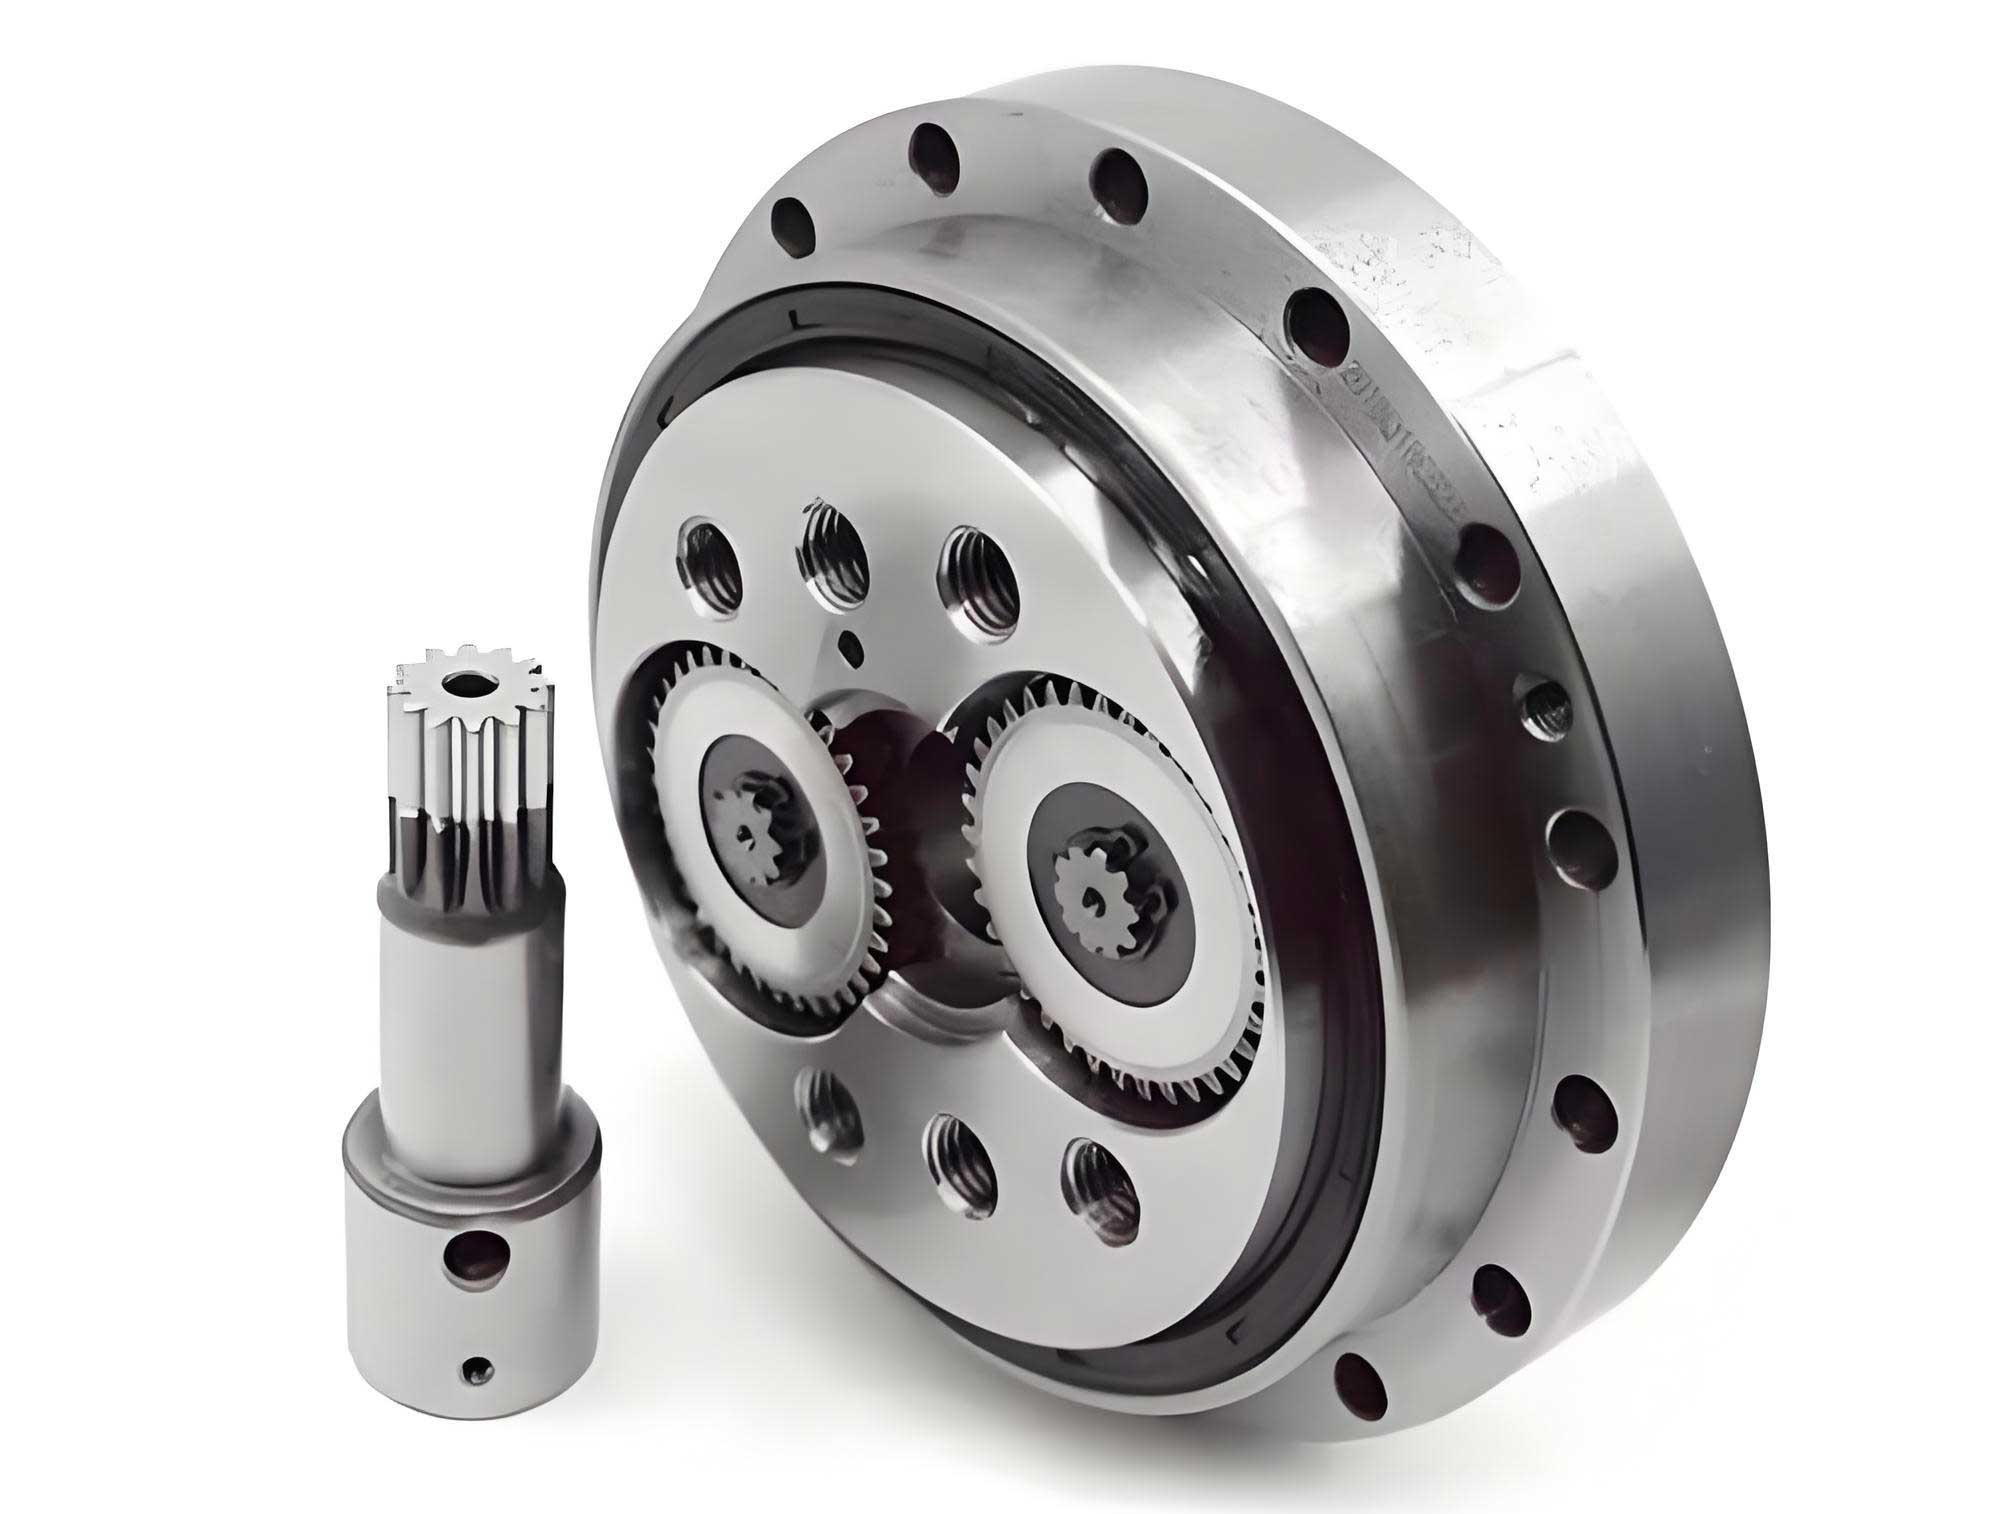
The precise and reliable operation of industrial robots heavily relies on the performance of their core transmission components. Among these, the RV reducer, a type of precision cycloidal pinwheel drive, is renowned for its high reduction ratio, substantial torsional stiffness, compact structure, and excellent positional accuracy, making it the predominant choice for joints in heavy-duty industrial robots. At the heart of an RV reducer lies its main bearing, a critical component that directly supports the output flange and transmits complex loads from the robot arm. This bearing operates under particularly demanding conditions characterized by low rotational speeds and high intermittent loads, often involving frequent start-stop cycles and load reversals. Understanding its dynamic response under such RV reducer service profiles is fundamental for performance evaluation, life prediction, and the development of accelerated testing protocols.
While extensive research exists on rolling bearing dynamics, studies specifically targeting the RV reducer main bearing under its unique low-speed, high-load operational regime are relatively scarce. This work focuses on bridging this gap. We begin by analyzing a typical RV reducer duty cycle and formulating it into a test load spectrum. Subsequently, a detailed multi-body dynamics model of the RV reducer main bearing is established. This model is used to systematically investigate the influence of key operational parameters—specifically radial load and inner ring rotational speed—on the dynamic response, quantified by the radial and axial displacement of the bearing’s inner ring. The validity of the model is confirmed through comparative analysis with experimental data obtained from a dedicated RV reducer main bearing test rig.
1. Analysis of Typical RV Reducer Service Conditions
The operational profile of an RV reducer in a robotic joint typically involves repetitive back-and-forth motion with load variations. The main bearing experiences a combination of axial preload, time-varying radial load from the moment arm, and a rotational speed profile that includes acceleration, constant velocity, and deceleration phases. This typical service condition can be mathematically described using piecewise functions for radial load $F_r$, axial load $F_a$, and inner ring angular speed $\omega$.
1.1 Radial Load $F_r$:
$$ F_r(t) =
\begin{cases}
k_1 t & 0 \leq t < t_0 \\
a_{10} & t_0 \leq t < t_3 \\
-k_1 t + a_{11} & t_3 \leq t < t_4 \\
0 & \text{otherwise}
\end{cases}
$$
where $k_1 t_0 = a_{10} = -k_1 t_3 + a_{11}$, and $a_{10}$ is the stable radial load.
1.2 Axial Load $F_a$:
$$ F_a(t) =
\begin{cases}
k_2 t + a_{20} & 0 \leq t < t_0 \\
a_{21} & t_0 \leq t < t_3 \\
-k_2 t + a_{22} & t_3 \leq t < t_4 \\
0 & \text{otherwise}
\end{cases}
$$
where $k_2 t_0 + a_{20} = a_{21} = -k_2 t_3 + a_{22}$, $a_{20}$ is the axial preload, and $a_{21}$ is the stable axial load.
1.3 Inner Ring Angular Speed $\omega$:
$$ \omega(t) =
\begin{cases}
k_3 t – a_{30} & 0 \leq t < t_1 \\
a_{31} & t_1 \leq t < t_2 \\
-k_3 t + a_{32} & t_2 \leq t < t_3 \\
0 & \text{otherwise}
\end{cases}
$$
where $k_3 t_1 – a_{30} = a_{31} = -k_3 t_2 + a_{32}$, and $a_{31}$ is the constant operating speed.
The time nodes define the phases: $0$-$t_0$ and $t_3$-$t_4$ are load ramping up/down phases; $t_0$-$t_1$ and $t_2$-$t_3$ are acceleration and deceleration phases; $t_1$-$t_2$ is the constant speed, stable operation phase. A schematic of this profile is essential for constructing test protocols for the RV reducer main bearing.
2. Dynamics Modeling of the RV Reducer Main Bearing
The RV reducer main bearing is typically a large-diameter, thin-section angular contact ball bearing. To analyze its dynamic characteristics, a multi-body dynamics model was constructed, considering the complex interactions between the inner ring, outer ring, balls, and cage.
2.1 Model Parameters and Geometry
The bearing components (inner ring, outer ring, balls) are modeled using bearing steel GCr15. The material properties and key geometric parameters for the modeled RV reducer main bearing are summarized below.
| Parameter | Value |
|---|---|
| Material Density, $\rho$ (kg/m³) | 7800 |
| Elastic Modulus, $E$ (GPa) | 208 |
| Poisson’s Ratio, $\nu$ | 0.3 |
| Inner Diameter (mm) | 320 |
| Outer Diameter (mm) | 383 |
| Width (mm) | 30 |
| Ball Diameter (mm) | 23 |
| Number of Balls | 51 |
| Cage Inner Diameter (mm) | 354.5 |
| Cage Outer Diameter (mm) | 366 |
2.2 Contact Force and Friction Modeling
The interactions between bearing elements are modeled using a nonlinear spring-damper approach based on Hertzian contact theory. The normal contact force $F_{impact}$ is calculated using the impact function method:
$$ F_{\text{impact}} =
\begin{cases}
0 & q > q_0 \\
K(q_0 – q)^e – c_{\text{max}} \cdot \frac{dq}{dt} \cdot \text{step}(q, q_0-d, 1, q_0, 0) & q \leq q_0
\end{cases}
$$
where $K$ is the Hertzian contact stiffness, $q$ is the instantaneous distance between contact bodies, $q_0$ is the initial contact distance, $e$ is the force exponent (1.5 for point contact), $d$ is the damping penetration depth (0.1 mm), and $c_{max}$ is the maximum damping coefficient (typically 0.1% to 1% of $K$).
Friction is modeled using a Coulomb friction model. The friction coefficient $\mu$ is defined as a function of the relative slip velocity $v$:
$$ \mu =
\begin{cases}
-\mu_d \cdot \text{sign}(v) & v > v_d \\
-\text{step}(|v|, v_s, \mu_s, v_d, \mu_d) \cdot \text{sign}(v) & v_s \leq |v| \leq v_d \\
-\text{step}(|v|, 0, 0, v_s, \mu_s) \cdot \text{sign}(v) & |v| < v_s
\end{cases}
$$
where $\mu_s=0.1$ is the static friction coefficient, $v_s=100$ mm/s is the static transition velocity, $\mu_d=0.02$ is the dynamic friction coefficient, and $v_d=1000$ mm/s is the dynamic transition velocity. This accounts for the brief static friction at start-up before transitioning to the predominant dynamic friction state during stable operation of the RV reducer main bearing.
In the model, the outer ring is fixed. The inner ring is constrained to rotate and is subjected to the time-varying radial load $F_r(t)$, a constant axial preload/load $F_a(t)$, and the rotational speed $\omega(t)$. Contact pairs are defined between balls and raceways, and between balls and the cage.
2.3 Model Validation
To validate the dynamics model, experiments were conducted on a dedicated RV reducer main bearing test rig. The radial and axial displacements of the inner ring were measured using high-precision laser displacement sensors under a specified load (30 kN radial, constant axial) and speed (660 °/s) condition. The simulation results for inner ring displacement over time showed excellent agreement with the experimental data in terms of overall trend and magnitude of oscillation, thereby confirming the validity and accuracy of the established RV reducer main bearing dynamics model for subsequent analysis.
3. Dynamic Response Characteristics Analysis
Using the validated model, a systematic analysis was performed to understand the influence of inner ring angular speed and radial load on the dynamic response (radial and axial displacement) of the RV reducer main bearing. The analysis focuses on three distinct operational phases: start-up acceleration, constant speed stable running, and deceleration.
3.1 Influence of Inner Ring Angular Speed
With a constant axial load of 10,000 N and a radial load of 30,000 N, the inner ring speed was varied from 120 °/s to 660 °/s. The corresponding angular acceleration/deceleration during start/stop phases increases proportionally with the target speed for fixed transition times.
Radial Displacement Response: During start-up and deceleration, the radial displacement exhibits a distinct oscillatory trend. The range of radial displacement variation (the “jump” or amplitude of oscillation) during these transient phases increases with increasing angular acceleration/deceleration. During stable running, the mean radial displacement decreases linearly with increasing constant angular speed $\omega$.
The linear fitting relationships for the different phases are summarized as follows, where $y$ represents the radial displacement in mm and $\omega$ is in °/s:
| Operational Phase | Fitted Relationship | Interpretation |
|---|---|---|
| Start-up Phase (Variation Range) | $y_1 = 2.5 \times 10^{-5} \cdot \omega + 0.032$ | Range increases with $\omega$ (and thus acceleration). |
| Deceleration Phase (Variation Range) | $y_2 = 6.0 \times 10^{-5} \cdot \omega + 0.004$ | Range increases with $\omega$ (and thus deceleration). |
| Stable Running Phase (Mean Value) | $y_3 = -5.0 \times 10^{-5} \cdot \omega + 0.056$ | Mean value decreases with $\omega$. |
Axial Displacement Response: Similarly, the axial displacement shows significant variation during transients. The range of axial displacement variation during start/stop also increases with angular acceleration/deceleration. Conversely, during stable operation, the mean axial displacement increases linearly with inner ring speed.
The corresponding linear fits for axial displacement $a$ (in mm) are:
| Operational Phase | Fitted Relationship | Interpretation |
|---|---|---|
| Start-up Phase (Variation Range) | $a_1 = 1.85 \times 10^{-5} \cdot \omega + 0.048$ | Range increases with $\omega$/acceleration. |
| Deceleration Phase (Variation Range) | $a_2 = 1.90 \times 10^{-6} \cdot \omega + 0.026$ | Range increases with $\omega$/deceleration. |
| Stable Running Phase (Mean Value) | $a_3 = 7.90 \times 10^{-6} \cdot \omega + 1.996$ | Mean value increases with $\omega$. |
3.2 Influence of Radial Load
With a constant inner ring speed of 120 °/s and axial load, the radial load was varied from 20,000 N to 40,000 N.
Radial Displacement Response: As expected, higher radial load causes greater mean radial displacement during stable running. Furthermore, the range of radial displacement variation during the start-up and deceleration transients also increases with the applied radial load $F_r$.
The linear fitting relationships are as follows, where $y$ is radial displacement in mm and $x$ is radial load in N:
| Operational Phase | Fitted Relationship | Interpretation |
|---|---|---|
| Start-up Phase (Variation Range) | $y_1 = 8.0 \times 10^{-7} \cdot x + 0.030$ | Range increases with radial load $F_r$. |
| Deceleration Phase (Variation Range) | $y_2 = 2.2 \times 10^{-7} \cdot x + 0.020$ | Range increases with radial load $F_r$. |
| Stable Running Phase (Mean Value) | $y_3 = 2.0 \times 10^{-6} \cdot x + 0.025$ | Mean value increases with radial load $F_r$. |
Axial Displacement Response: Interestingly, while the mean axial displacement during stable running increases with radial load (due to the axial component of the contact forces), the range of axial displacement variation during transients decreases with increasing radial load. This suggests that a higher radial load has a damping or constraining effect on axial oscillations during acceleration/deceleration of the RV reducer main bearing.
The corresponding linear fits for axial displacement $a$ (in mm) are:
| Operational Phase | Fitted Relationship | Interpretation |
|---|---|---|
| Start-up Phase (Variation Range) | $a_1 = -9.0 \times 10^{-7} \cdot x + 0.060$ | Range decreases with radial load $F_r$. |
| Deceleration Phase (Variation Range) | $a_2 = -3.0 \times 10^{-7} \cdot x + 0.038$ | Range decreases with radial load $F_r$. |
| Stable Running Phase (Mean Value) | $a_3 = 1.0 \times 10^{-6} \cdot x + 1.980$ | Mean value increases with radial load $F_r$. |
3.3 Synthesis and Mechanism Discussion
The analysis reveals distinct dynamic behaviors of the RV reducer main bearing across different operational phases. During start-up and deceleration, angular acceleration/deceleration is the dominant factor causing increased oscillation ranges in both radial and axial directions. This is primarily attributed to rapid changes in inertial forces and contact conditions between balls and raceways. The increasing radial load also enlarges the radial displacement oscillation range but surprisingly suppresses the axial displacement oscillation range, likely by increasing the normal contact forces and thereby altering the dynamic stability in the axial direction.
During stable running, the centrifugal force becomes significant. A higher rotational speed increases centrifugal force on the balls, which can slightly unload the inner ring, leading to a decrease in mean radial displacement. Simultaneously, it increases the gyroscopic moments and ball-raceway contact angles, resulting in an increase in mean axial displacement. Increasing radial load, on the other hand, directly increases elastic deformation, raising both the mean radial and axial displacements.
A key finding is that compared to radial load, the rotational speed (and associated acceleration) has a more pronounced influence on the displacement response, especially the oscillation amplitudes during transients. This highlights the critical impact of inertial effects in the dynamics of the RV reducer main bearing, even at relatively low speeds.
4. Conclusion
This study conducted a detailed analysis of the dynamic characteristics of the RV reducer main bearing under its typical low-speed and heavy-duty service conditions. A validated multi-body dynamics model was employed to investigate the effects of radial load and inner ring angular speed. The primary conclusions are as follows:
- Transient Phases (Start-up/Deceleration):
- The range of radial displacement variation increases approximately linearly with both increasing radial load and increasing angular acceleration/deceleration.
- The range of axial displacement variation decreases approximately linearly with increasing radial load but increases approximately linearly with increasing angular acceleration/deceleration. The effect of angular acceleration is more significant.
- Stable Running Phase:
- The mean radial displacement increases approximately linearly with radial load and decreases approximately linearly with increasing inner ring angular speed.
- The mean axial displacement increases approximately linearly with both radial load and inner ring angular speed. The influence of rotational speed is more dominant.
- Design and Testing Implication: For RV reducer main bearings operating in low-speed, high-load conditions, minimizing angular acceleration during start-stop cycles (e.g., through smoother motion profiles) can effectively reduce severe vibrations and oscillations, which is beneficial for longevity and positioning accuracy. These quantified relationships provide a fundamental theoretical basis for formulating accelerated test load spectra and for the performance evaluation of RV reducer main bearings.