
The pursuit of high precision, reliability, and longevity in robotic joints has positioned the RV reducer as a critical component in modern industrial automation. As a two-stage precision transmission device combining a planetary gear train and a cycloidal pin-wheel mechanism, the RV reducer offers exceptional advantages. However, its operational performance is inevitably influenced by dynamic excitations arising from manufacturing imperfections, variable loading, and meshing interactions. These excitations often manifest as stochastic vibrations, which are random in nature but statistically stationary over time. Traditional deterministic analyses, such as static stress evaluation or even modal analysis, while valuable, provide an incomplete picture of the system’s behavior under real-world operating conditions. They fail to account for the probabilistic distribution of stress and displacement responses caused by random inputs. Therefore, a stochastic vibration analysis, grounded in the theory of random processes and spectral estimation, is essential for a more realistic assessment of dynamic stress, fatigue life, and overall operational reliability of the RV reducer.
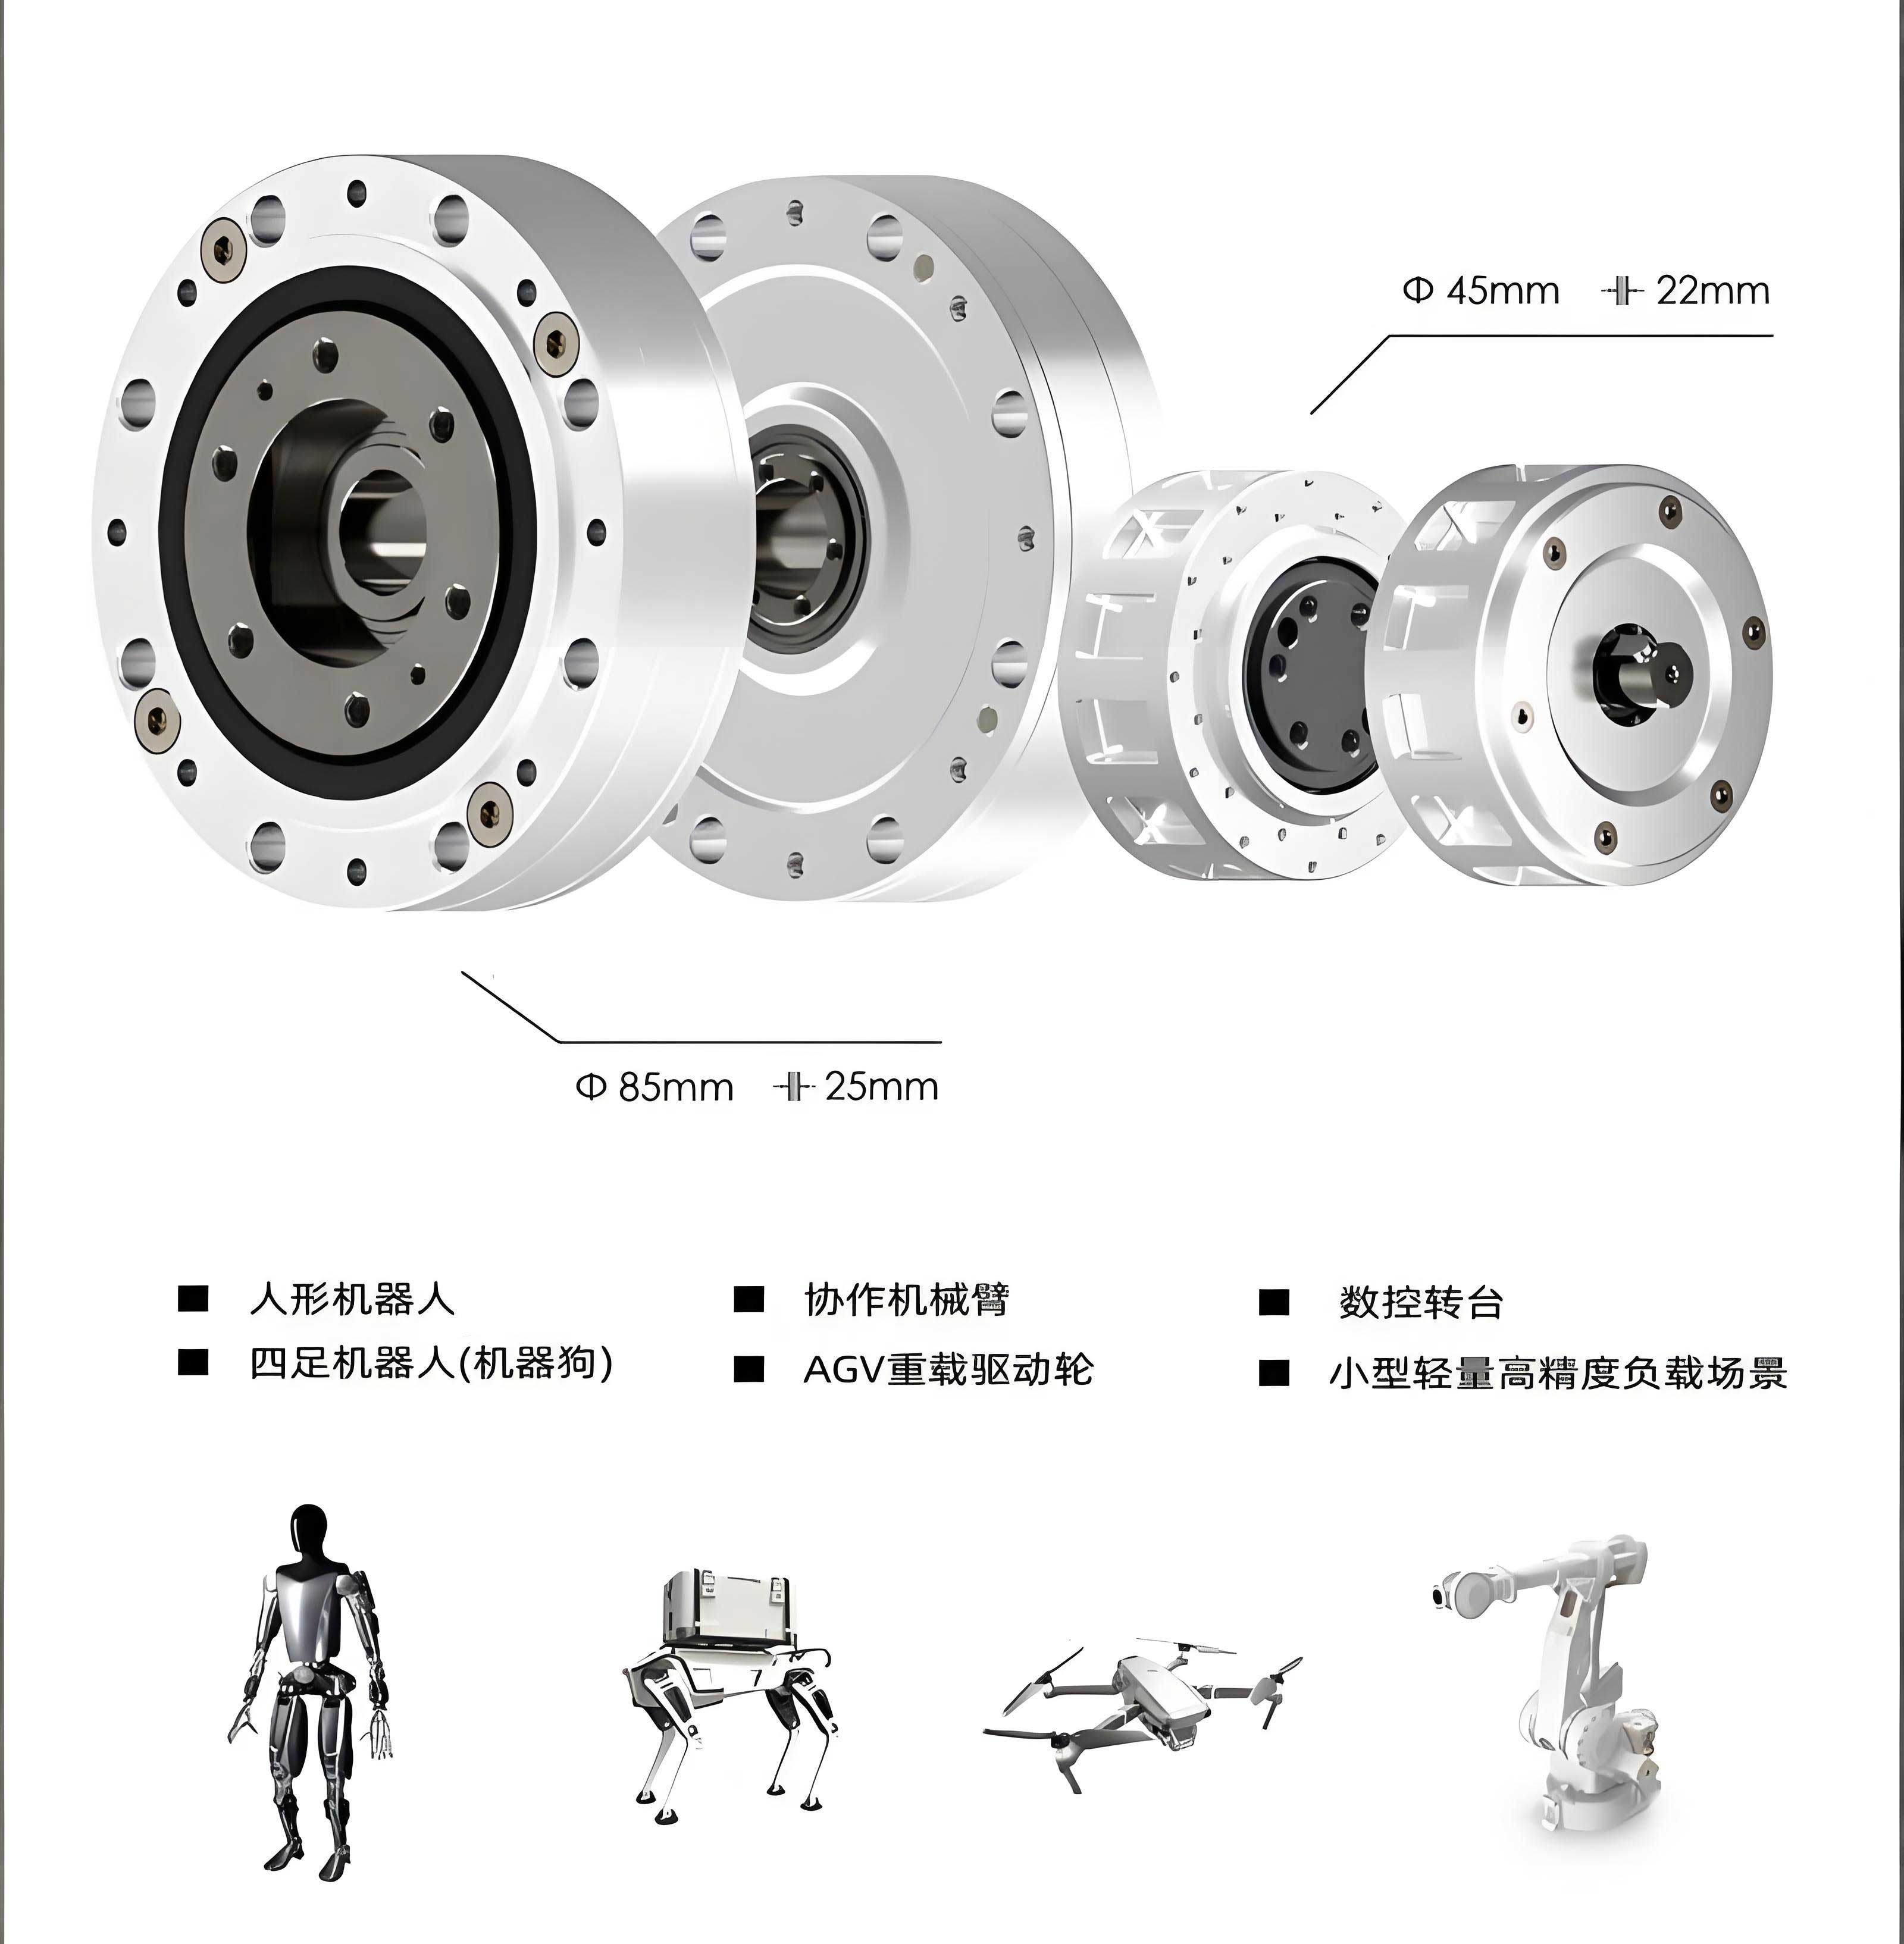
This article presents a holistic methodology for the stochastic vibration analysis of an RV reducer, integrating multi-body dynamics simulation, experimental modal analysis, spectral estimation, and finite-element-based random vibration analysis. The core objective is to quantify the influence of random vibration factors on the stress distribution and safety margin of the RV reducer’s input stage, thereby proposing a refined framework for reliability evaluation.
1. Theoretical Foundation and Kinematic Modeling of the RV Reducer
The RV reducer operates on a compound transmission principle. The first stage is a standard planetary gear train where the sun gear (input shaft) drives two or three planet gears. The second, low-speed stage is a cycloidal drive where the planet gears, now acting as crankshafts, eccentrically drive cycloid discs that mesh with a stationary ring of pins. The opposite rotation of the cycloid discs is transferred to the output flange. The total reduction ratio \( i_{total} \) of a typical RV reducer with two planet gears is given by:
$$ i_{total} = (1 + \frac{z_p}{z_c}) \cdot \frac{z_2}{z_1} $$
where \( z_1 \) is the number of teeth on the input sun gear, \( z_2 \) is the number of teeth on the planet gear, \( z_c \) is the number of lobes on the cycloid disc, and \( z_p \) is the number of pin teeth on the housing. For the model under investigation, the primary design parameters are summarized in the following table:
| Parameter Description | Symbol | Unit | Value |
|---|---|---|---|
| Input Shaft Speed | \( n_1 \) | rpm | 1530 |
| Input Power | \( P \) | kW | 0.65 |
| Sun Gear Teeth | \( z_1 \) | – | 15 |
| Planet Gear Teeth | \( z_2 \) | – | 57 |
| Cycloid Disc Lobes | \( z_c \) | – | 39 |
| Pin Teeth | \( z_p \) | – | 40 |
| Total Transmission Ratio | \( i_{total} \) | – | 153 |
A precise three-dimensional model of the RV reducer, encompassing the input shaft, planet gears, crankshafts, cycloid discs, needle pins, and housing, was constructed. This assembly forms the basis for subsequent dynamic simulations.
2. Multi-Body Dynamics Simulation for Excitation Characterization
To obtain realistic dynamic excitations acting as inputs for the stochastic analysis, a kinematic and dynamic simulation was performed. The 3D CAD model was imported into a multi-body dynamics software (e.g., Adams). Appropriate materials were assigned to all components, contacts were defined between mating gear teeth and bearings, and necessary joints (revolute, fixed) were applied. A constant rotational velocity of 1530 rpm was prescribed to the input shaft.
The primary output of interest from this simulation is the time-domain acceleration history of key components, particularly the planet gears. Due to transmission error, backlash, and time-varying mesh stiffness, the acceleration signals are not purely sinusoidal but contain complex, seemingly random fluctuations superimposed on the primary meshing frequency. The radial (x-direction) and tangential (y-direction) centroidal accelerations of a single planet gear were extracted over a sufficient time period. These acceleration-time histories, \( a_x(t) \) and \( a_y(t) \), represent the random vibration excitation signals originating from the meshing process of the RV reducer’s first stage. Analyzing these signals provides the necessary data to define the random vibration environment.
3. Modal Analysis and Natural Frequency Extraction
Before proceeding with random vibration analysis, a modal analysis of the RV reducer’s input stage assembly is imperative. The natural frequencies and mode shapes determine the system’s dynamic amplification characteristics. When the frequency content of the random excitation overlaps with these natural frequencies, significant resonant amplification of stress and displacement can occur.
The finite element model of the assembly was created, ensuring consistent material properties and contact conditions with the dynamics model. A fixed support boundary condition was applied to the housing interface. A modal analysis was solved to extract the first several natural frequencies. The results for the first six modes are presented below:
| Mode Number | Natural Frequency (Hz) |
|---|---|
| 1 | 668.9 |
| 2 | 910.5 |
| 3 | 936.0 |
| 4 | 984.5 |
| 5 | 1796.4 |
| 6 | 2060.0 |
These frequencies are critical for interpreting the subsequent power spectral density results and for understanding which modes may be excited during the operation of the RV reducer.
4. Spectral Estimation and Power Spectral Density (PSD) Derivation
The acceleration signals \( a(t) \) obtained from dynamics simulation are treated as sample records of an ergodic, stationary random process. For such processes, the Power Spectral Density (PSD) function \( S_{aa}(f) \) is the fundamental descriptor of frequency content, representing the distribution of signal power (mean square value) across frequency. The PSD is computed via the Fourier Transform of the autocorrelation function \( R_{aa}(\tau) \).
The autocorrelation function for a stationary signal is defined as:
$$ R_{aa}(\tau) = \lim_{T \to \infty} \frac{1}{T} \int_{-T/2}^{T/2} a(t) \cdot a(t + \tau) \, dt $$
where \( \tau \) is the time lag. In practice, for a discrete-time signal of finite length, this is estimated. The estimated autocorrelation functions for both \( a_x(t) \) and \( a_y(t) \) showed deviations from zero at non-zero lags, indicating the presence of correlated random components beyond simple noise.
The PSD \( S_{aa}(f) \) is the Fourier transform of \( R_{aa}(\tau) \):
$$ S_{aa}(f) = \int_{-\infty}^{\infty} R_{aa}(\tau) e^{-i 2 \pi f \tau} \, d\tau $$
To reduce spectral leakage and improve the estimate, a windowing function (e.g., Hamming window) is applied to the time-domain data before computing the PSD via Welch’s method. The resulting PSD curves for the planet gear accelerations in the x and y directions revealed distinct peaks at specific frequencies, corresponding to excitations from meshing harmonics and potential modulation sidebands. The significant peak values, which serve as the input excitation for the random vibration analysis, are tabulated as follows:
| Frequency (Hz) | PSD of X-accel (g²/Hz) | PSD of Y-accel (g²/Hz) |
|---|---|---|
| 200 | 34.48 | 33.81 |
| 370 | 40.22 | 39.22 |
| 670 | 36.13 | 35.15 |
| 1100 | 26.65 | 25.77 |
| 1310 | 27.08 | 26.59 |
| 1470 | 27.54 | 26.57 |
It is noteworthy that several PSD peaks are in close proximity to the natural frequencies of the RV reducer assembly (e.g., ~670 Hz, ~910 Hz), indicating a high risk of resonant response.
5. Finite Element-Based Random Vibration Analysis
The core of this study is the random vibration analysis performed using the Finite Element Method. The PSD profiles defined in the previous section were applied as base excitation or force excitation to the FE model of the RV reducer input stage within a dedicated random vibration module. The analysis solves for the statistical response of the system, typically outputting the 1-sigma (1σ) stress and displacement distributions. Since stress follows a Rayleigh distribution for a system responding to Gaussian random input, the 3σ value is often used for design assessment, as it encompasses approximately 99.73% of the probable stress values.
The analysis focused on three key performance indicators for the RV reducer:
5.1. Equivalent Stress on Planet Gear Tooth Root: Paths were defined along the root fillets of the meshing teeth on both the upper and lower planet gears. The random vibration analysis revealed a non-uniform distribution of the 1σ equivalent (von-Mises) stress. The maximum 1σ stress on the upper planet gear tooth path was found to be approximately 1.509 MPa, while the maximum on the symmetrical lower planet gear tooth path was about 1.023 MPa. This asymmetry in the stochastic stress response highlights how random vibrations can lead to uneven load sharing between supposedly symmetric paths in the RV reducer, a factor not captured by static analysis.
5.2. Circumferential Stress on Input Sun Gear: A circular path was defined around the root of the input sun gear teeth. The 1σ equivalent stress distribution along this path showed distinct peaks at the meshing locations with the planet gears. The maximum stress value on one side was 0.7763 MPa, while the corresponding peak on the opposite meshing point was 0.6654 MPa. This further confirms the uneven dynamic load distribution induced by stochastic excitations within the RV reducer’s gear train.
5.3. Normal Stress and Safety Margin Calculation: The overall 3σ normal stress distributions in the critical directions (e.g., along the line connecting shaft centers – X, and radial direction – Z) were computed for the entire input stage assembly. The maximum 3σ normal stresses were:
$$ \sigma_{X, 3\sigma} \approx 1.6191 \, \text{MPa}, \quad \sigma_{Z, 3\sigma} \approx 1.604 \, \text{MPa} $$
These stochastic vibratory stresses must be combined with the primary deterministic stresses from torque transmission to assess total part reliability. For the sun gear (material: 40Cr), the bending stress due to transmitted torque \( \sigma_{bending} \) was calculated as 102.63 MPa according to standard gear rating procedures.
The total maximum equivalent stress under combined deterministic and stochastic loading is estimated by a root-sum-square (RSS) method, assuming the random and static stresses are uncorrelated:
$$ \sigma_{total, max} \approx \sqrt{\sigma_{bending}^2 + (3\sigma_{vibratory})^2} $$
Using the higher vibratory stress value:
$$ \sigma_{total, max} \approx \sqrt{(102.63)^2 + (1.6191)^2} \approx 102.64 \, \text{MPa} $$
The safety margin (MS) is then calculated as:
$$ MS = \frac{\sigma_{allowable}}{\sigma_{total, max} \cdot n} – 1 $$
where \( \sigma_{allowable} \) is the yield strength of 40Cr (≈ 539 MPa), and \( n \) is an appropriate safety factor (e.g., 1.34). Thus,
$$ MS = \frac{539}{102.64 \times 1.34} – 1 \approx 3.92 – 1 = 2.92 $$
A positive MS (MS > 0) indicates a safe design. This comprehensive calculation demonstrates that while the random vibration contributions are relatively small compared to the static bending stress for this RV reducer under the given load, the methodology is crucial for high-load applications or where vibratory stresses are amplified by resonance.
6. Conclusion and Engineering Implications
This integrated methodology for stochastic vibration analysis of an RV reducer provides a significant advancement over traditional deterministic approaches. By combining multi-body dynamics, spectral estimation, and finite element analysis, it quantifies the influence of real-world random excitations on the structural response of the reducer.
The key findings are: 1) Random vibrations inherent in the meshing process of the RV reducer can cause statistically significant asymmetry in stress distributions between theoretically symmetric components like the two planet gears. 2) The circumferential load on the input gear is also uneven under stochastic excitation. 3) A robust safety margin calculation must account for the combined effect of deterministic operational stresses and statistically quantified vibratory stresses (e.g., using 3σ values).
For designers and reliability engineers, this approach offers a new and more rational framework for evaluating the operational performance and longevity of RV reducers. It allows for the identification of potential resonant risks by comparing PSD input peaks with structural natural frequencies. Furthermore, it enables a probabilistic assessment of stress ranges, which is directly applicable to fatigue life prediction. Future work may involve correlating the analysis with physical vibration tests, extending the model to include the full RV reducer with the cycloidal stage, and investigating the effects of non-Gaussian or non-stationary excitations on the reliability of the RV reducer system.