
Noise has emerged as a critical design constraint in modern mechanical systems, directly impacting user comfort, product quality, and regulatory compliance. Among various transmission mechanisms, the screw gear drive, commonly known as a worm and worm wheel set, is prized for its compactness, high reduction ratios, and smooth operation. However, like all geared transmissions, it is a potential source of acoustic emissions. The pursuit of quieter screw gear systems necessitates a deep understanding of the dynamic excitations generated during meshing. This article presents a comprehensive investigation into the application of the Finite Element Method (FEM) as a predictive and analytical tool for noise reduction in screw gear drives. By correlating dynamic forces with acoustic principles, we establish a virtual framework for optimizing screw gear design parameters to minimize noise at its source.
The primary excitation mechanisms in a screw gear pair leading to noise and vibration are time-varying mesh stiffness and transmission error. These dynamic forces induce structural vibrations in the gear bodies, housing, and connected components, which radiate as audible sound. The sound pressure level is fundamentally linked to the vibration amplitude, while the perceived tonal character is governed by the frequency content. Therefore, a successful noise reduction strategy must address both the intensity (amplitude) and the spectral (frequency) characteristics of the dynamic mesh forces. Traditional design approaches often rely on empirical rules, prototype testing, and analytical formulas that may not fully capture the complex three-dimensional, transient interaction between the worm and the worm wheel. This is where computational engineering, specifically transient dynamic finite element analysis, offers a transformative advantage, allowing for a detailed, physics-based simulation of the entire meshing cycle.
The core objective of this work is to demonstrate and validate a FEM-based workflow for screw gear noise analysis. The validation is twofold: first, by benchmarking the simulated dynamic reaction forces against well-established theoretical quasi-static calculations; and second, by correlating the frequency characteristics extracted from the simulation with experimental measurements. This dual-validation approach confirms the reliability of the FEM model. Subsequently, the validated model is employed as a virtual testbed to compare different screw gear designs and operating conditions, assessing their noise potential through the amplitude and frequency of the simulated mesh forces. This methodology enables a parametric exploration of design variables—such as module, pressure angle, helix angle, and number of threads—to achieve an optimal, low-noise screw gear configuration prior to physical prototyping.
Methodology: Integrating Theory, Simulation, and Experiment
The investigation follows a structured triad of theoretical calculation, finite element simulation, and physical experimentation. The analysis focuses on a screw gear assembly from an automotive window regulator system, a typical application where low operational noise is a key customer requirement.
Theoretical Force Calculation
The starting point is the analytical determination of the nominal mesh forces. This provides a baseline for validating the average forces obtained from the dynamic simulation. The geometry of a cylindrical screw gear is defined by a standard set of parameters. Two distinct design variants are considered for this study, with their key parameters summarized in Table 1.
| Parameter | Model 1 | Model 2 |
|---|---|---|
| Number of Worm Threads (Z₁) | 1 | 1 |
| Number of Worm Wheel Teeth (Z₂) | 70 | 82 |
| Normal Module (mₙ) [mm] | 0.7875 | 0.775 |
| Normal Pressure Angle (αₙ) [°] | 10.5 | 10.0 |
| Lead Angle (γ) [°] | 4.3682 | 3.3299 |
| Worm Pitch Diameter (d₁) [mm] | 11.074 | 13.343 |
| Worm Wheel Pitch Diameter (d₂) [mm] | 63.184 | 63.657 |
The force system on a screw gear is three-dimensional. The primary driving force is the torque applied to the worm. For a given output torque T₂ on the worm wheel, the tangential force on the wheel is Ft₂ = 2000T₂ / d₂ (with T₂ in N·m, d₂ in mm, and force in N). This tangential force relates directly to the axial force on the worm, Fx₁. The fundamental force acting normal to the tooth surfaces at the mesh point is the key to understanding contact stresses and excitations. This normal force Fₙ can be derived from the worm’s axial force or the wheel’s tangential force, considering the lead angle γ and the pressure angle. The relationship is given by:
$$F_n = \frac{F_{x1}}{\cos\gamma \cos\alpha_n} \approx -\frac{F_{t2}}{\cos\gamma \cos\alpha_x} = -\frac{2000T_2}{d_2 \cos\gamma \cos\alpha_x}$$
where αₓ is the axial pressure angle on the worm, related to the normal pressure angle αₙ by:
$$\tan\alpha_n = \tan\alpha_x \cos\gamma$$
Using these formulas with the parameters from Table 1 and specified load torques, the theoretical normal forces are calculated and serve as a reference, as shown in Table 2.
| Model | Output Torque (T₂) [N·m] | Theoretical Normal Force (Fₙ) [N] |
|---|---|---|
| Model 1 | 3 | -111.29 |
| Model 1 | 5 | -185.48 |
| Model 2 | 3 | 95.88 |
Finite Element Modeling and Transient Dynamic Analysis
The core of the virtual analysis is a high-fidelity transient dynamic simulation using ANSYS Workbench. The goal is to capture the time-history of forces and stresses throughout several mesh cycles, revealing fluctuations (amplitude) and their periodic nature (frequency).
Geometry and Material Properties: The three-dimensional CAD models of the worm and worm wheel are created parametrically based on Table 1. The worm is typically manufactured from hardened steel, while the worm wheel is often made from a softer material like bronze or engineered plastic to accommodate the sliding contact. The material properties used in the simulation are critical for accurate results and are listed in Table 3.
| Component | Material | Density [kg/m³] | Young’s Modulus [GPa] | Poisson’s Ratio |
|---|---|---|---|---|
| Worm | Stainless Steel | 7750 | 193 | 0.31 |
| Worm Wheel | Engineering Plastic | 1420 | 2.4 | 0.39 |
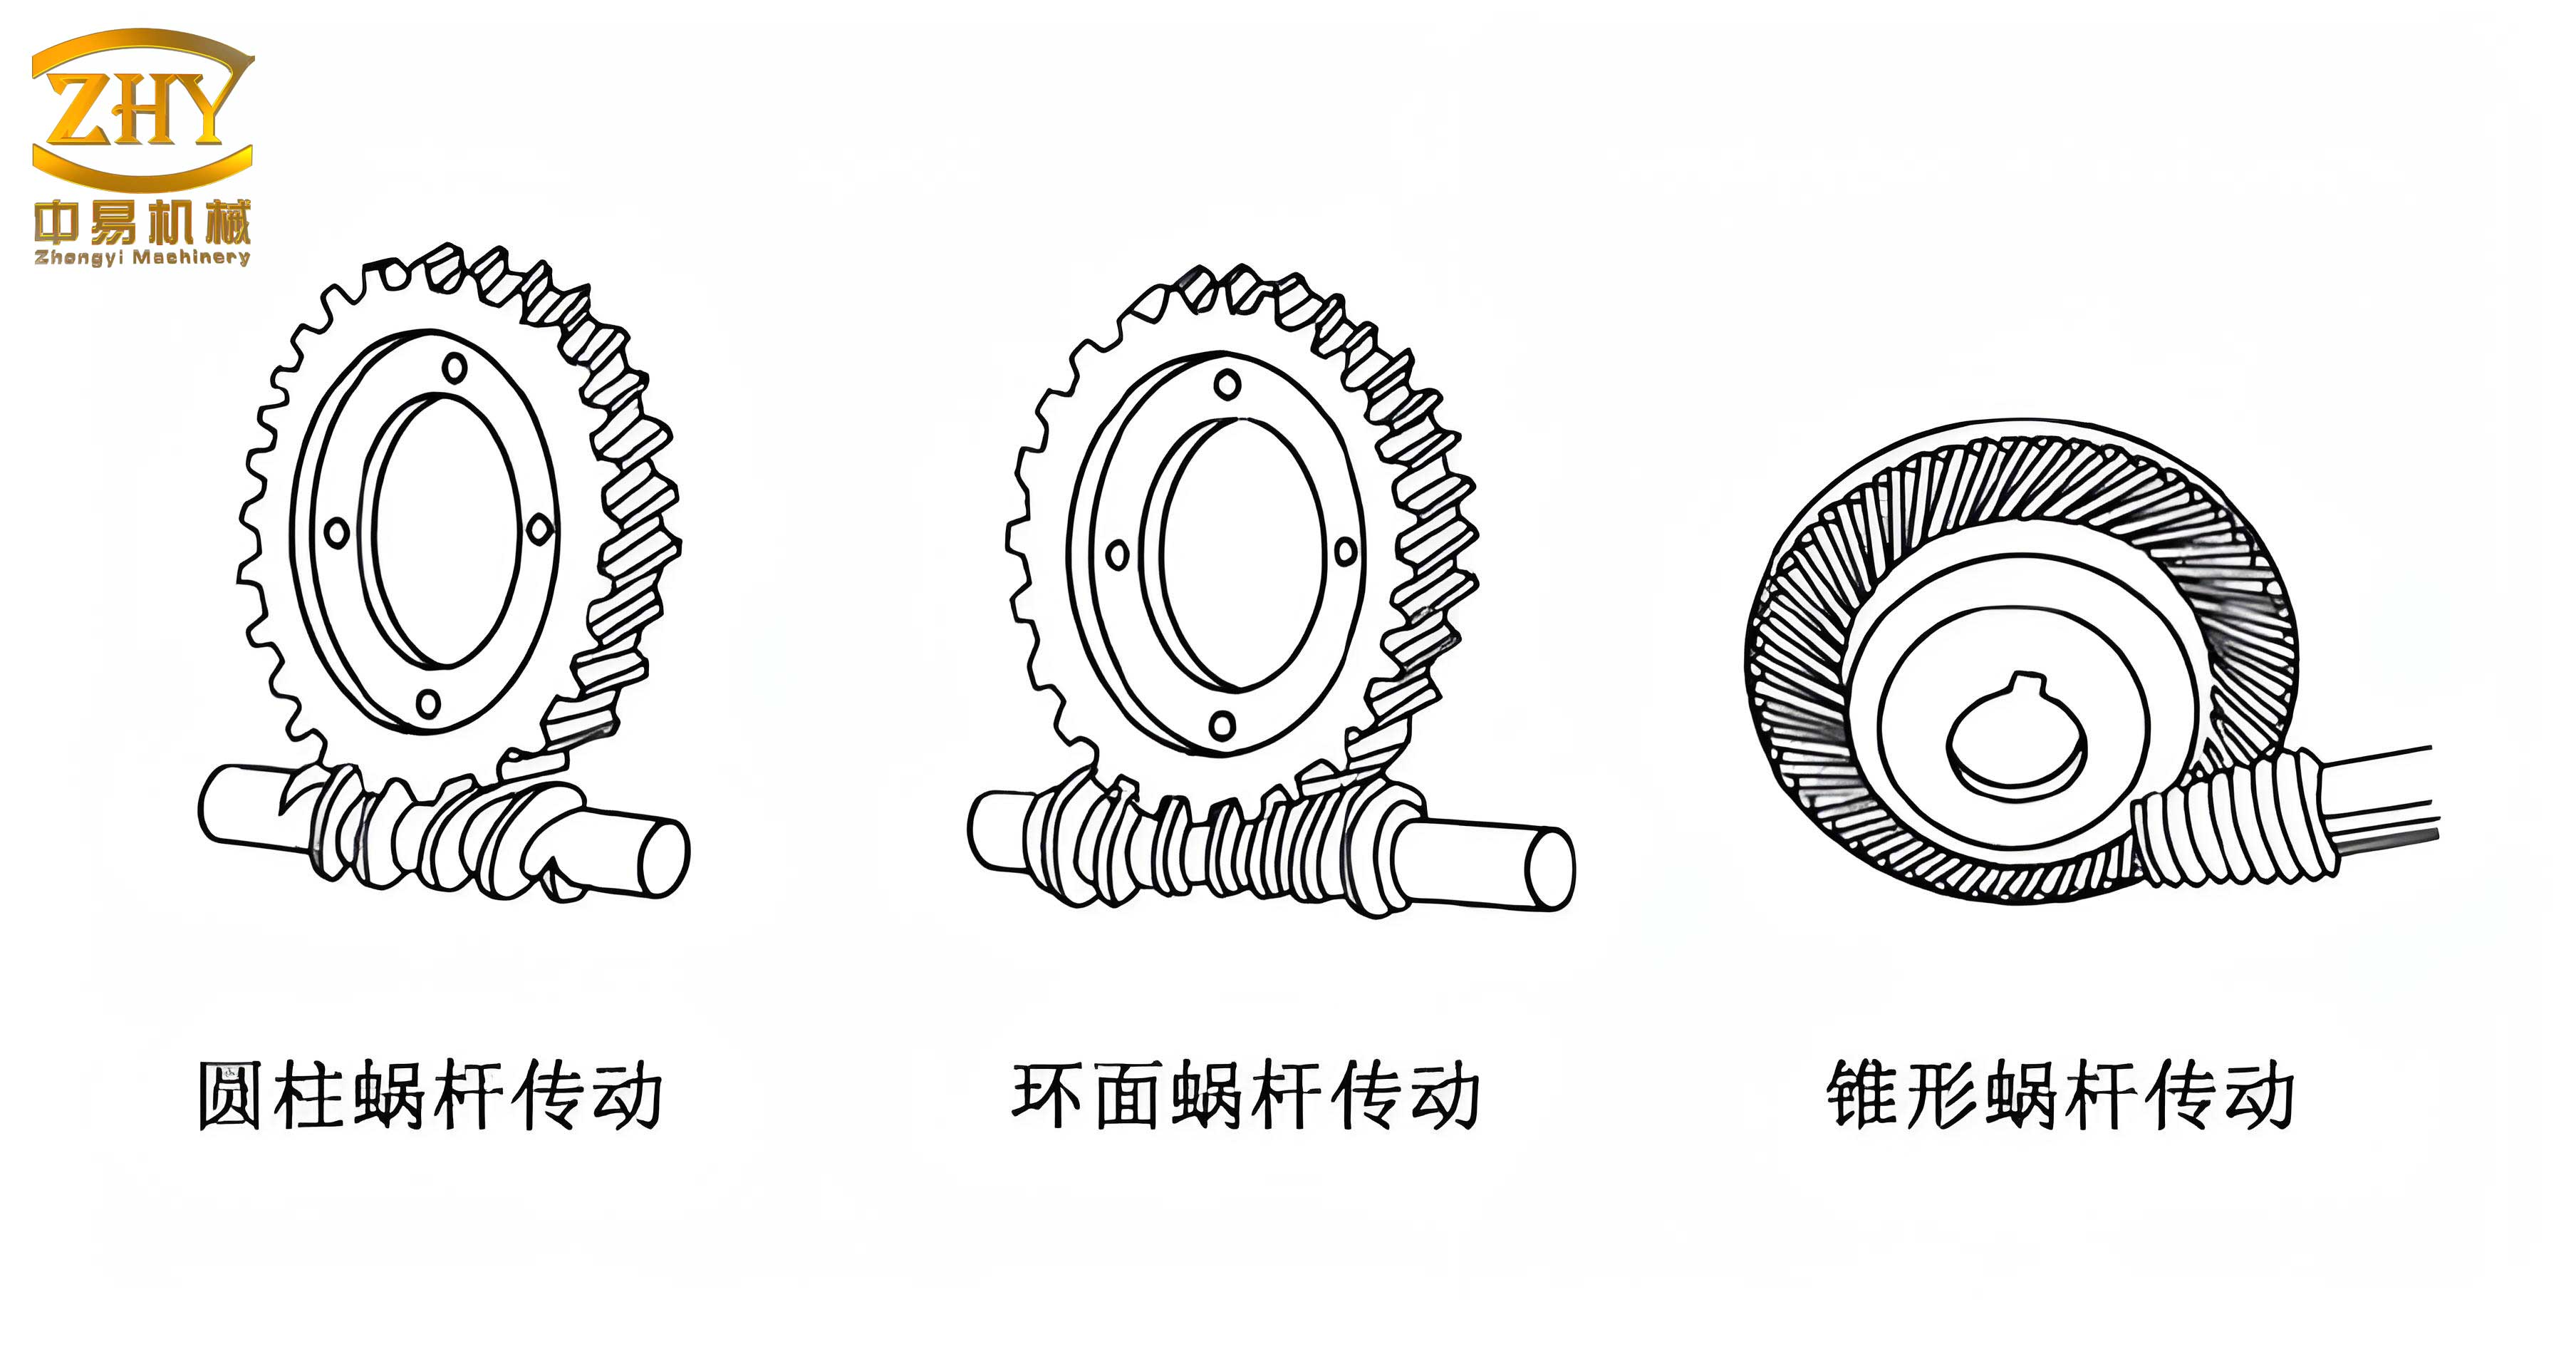
Mesh and Contact Definition: A high-quality mesh is generated, with particular refinement in the tooth contact regions to resolve the high stress gradients accurately. The contact between the worm thread and the worm wheel tooth is defined as frictional, with a coefficient appropriate for the material pair (steel on plastic). This non-linear contact is the primary source of the system’s dynamic behavior.
Boundary Conditions and Loading: The setup reflects the operational conditions. The worm wheel’s inner bore is fixed in all translational degrees of freedom but allowed to rotate about its axis. A rotational velocity (in RPM) is applied to the worm’s inner bore to drive the system. Crucially, the load is applied as a constant torque (T₂) on the worm wheel, resisting its motion. This represents the window regulator’s lifting load. Four distinct operational cases are analyzed to study the effects of load, speed, and geometry, as defined in Table 4.
| Case | Model | Output Torque (T₂) [N·m] | Worm Rotational Speed [RPM] |
|---|---|---|---|
| Case 1 | Model 1 | 3 | 5300 |
| Case 2 | Model 1 | 3 | 4500 |
| Case 3 | Model 1 | 5 | 5300 |
| Case 4 | Model 2 | 3 | 5300 |
Transient Solution: The simulation is run for a sufficient time to capture multiple mesh engagements (e.g., two full revolutions of the worm). Small, carefully chosen time steps ensure the resolution of the high-frequency impact events as teeth come into and out of contact. The primary output of interest is the time-history of the reaction force at the worm’s supports. This force signal embodies the dynamic excitation transferred from the meshing teeth to the structure.
Experimental Validation
To validate the simulation results, physical tests are conducted on prototype screw gear units matching the design parameters of Model 1. The test setup involves mounting the gearmotor in a fixture and applying a calibrated mass to generate the required load torque (3 N·m and 5 N·m). The assembly is driven at the specified worm speeds (5300 RPM and 4500 RPM). Vibration acceleration is measured on the housing using high-precision accelerometers connected to a B&K Pulse 3560-B spectrum analyzer. The time-domain acceleration signal is processed using Fast Fourier Transform (FFT) to obtain the frequency spectrum. The dominant peaks in this spectrum represent the primary structural response frequencies excited by the mesh forces.
Results and Discussion
The integration of theoretical, numerical, and experimental data provides a robust basis for evaluating the screw gear dynamics and the effectiveness of the FEM approach.
Force Validation and Stress Analysis
The transient simulation provides a detailed von Mises stress distribution. The maximum stresses are consistently found at the contact interface and the root fillet of the worm wheel teeth, confirming the expected critical regions. More importantly, the time-averaged value of the simulated worm reaction force is extracted for each case. Comparing these averaged simulated forces with the theoretical normal forces from Table 2 shows excellent agreement. For instance, for Case 1 (Model 1, 3 N·m), the simulated average force aligns closely with the theoretical value of -111.29 N. This successful correlation between the static theoretical formula and the dynamic simulation’s mean force validates the fundamental load-carrying prediction of the FEM model, establishing its baseline accuracy.
Frequency Extraction and Correlation
The simulated reaction force versus time plot is a rich source of dynamic information. Figure 4 (a conceptual representation of the results) shows oscillatory force signals for the four cases. The periodic fluctuation corresponds to the tooth meshing frequency and its harmonics. The meshing frequency (f_m) is theoretically given by:
$$f_m = \frac{Z_1 \times N}{60}$$
where Z₁ is the number of worm threads (1 for all cases here) and N is the worm speed in RPM. However, the structural response frequency observed in the force signal can be modulated by system stiffness and load. The period of oscillation in the force curve is measured, and its inverse gives the dominant excitation frequency from the simulation. These calculated frequencies are listed in Table 5.
| Case | Simulated Frequency [Hz] | Experimental Frequency [Hz] | Theoretical Meshing Freq. [Hz] |
|---|---|---|---|
| Case 1 | 1819.88 | 1782 | 88.33 |
| Case 2 | 1762.48 | 1710 | 75.00 |
| Case 3 | 2119.95 | 2082 | 88.33 |
| Case 4 | 1813.73 | N/A | 88.33 |
The results reveal crucial trends. First, the simulated frequencies for Cases 1, 2, and 3 show remarkable correlation with the experimentally measured frequencies, with deviations well within an acceptable margin for complex dynamic systems. This confirms that the transient FEM model accurately captures the fundamental dynamics leading to structural vibration. Second, comparing Cases 1 and 3 (same speed, different load) shows a significant increase in frequency with higher load. This is attributed to the increased contact pressure and altered effective mesh stiffness under load, which raises the system’s natural frequency of vibration in the relevant mode. Third, comparing Cases 1 and 2 (same load, different speed) shows a smaller but observable decrease in frequency with lower speed, likely due to slight changes in the damping and forcing function. The frequency for Case 4 (Model 2) is close to Case 1, but differences arise from the altered geometry affecting stiffness and contact conditions. It is important to note that the dominant frequencies in the simulation and experiment are much higher than the theoretical tooth meshing frequency (e.g., 88.33 Hz for 5300 RPM). This indicates that the primary audible noise is not the meshing frequency itself but a higher-order structural resonance (e.g., housing bending or torsional mode) excited by the broad-spectrum impact of the mesh forces.
Amplitude Analysis for Noise Assessment
While frequency determines the pitch, the amplitude of the force fluctuation is directly proportional to the vibration velocity and, consequently, to the radiated sound power. Therefore, the peak-to-peak amplitude of the simulated reaction force curve serves as a direct qualitative indicator of acoustic potential. Examining the force plots reveals clear differences:
- Case 3 (Higher Load): Exhibits the largest force amplitude. The increased torque leads to greater deflection and more significant impact forces during tooth engagement, resulting in higher vibration levels and louder noise.
- Case 2 (Lower Speed): Shows the smallest force amplitude among the Model 1 cases. Lower sliding velocity likely reduces impact severity and may alter the lubrication regime favorably.
- Case 4 (Different Geometry – Model 2): Demonstrates a significantly different force profile and amplitude compared to Case 1. This highlights the profound influence of screw gear design parameters—such as pressure angle, lead angle, and module—on the dynamic mesh forces. Model 2, with its different geometry, generates a distinct and in this instance less favorable dynamic excitation pattern.
This amplitude-based assessment allows designers to rank different screw gear designs virtually. A design yielding a lower force amplitude for the same load and speed is predicted to be quieter. This enables targeted parametric optimization of the screw gear profile before committing to costly tooling and physical testing.
Conclusions and Implications for Screw Gear Design
This study successfully establishes and validates a Finite Element Method-based workflow for the analysis and reduction of noise in screw gear drives. The key conclusions are:
- Validation of the FEM Approach: The close agreement between the simulated average reaction forces and theoretical calculations, and more importantly, between the simulated and experimentally measured dominant structural frequencies, provides strong validation. It confirms that transient dynamic FEM can reliably predict the excitations that lead to noise in screw gear systems.
- Insights into Dynamic Behavior: The analysis reveals that operational parameters significantly influence the dynamic response. Increased load substantially raises the dominant vibration frequency and force amplitude, leading to higher noise potential. Rotational speed also has a measurable effect on both frequency and amplitude.
- Design Parameter Sensitivity: The comparison between Model 1 and Model 2 unequivocally demonstrates that the geometric design of the screw gear (number of teeth, pressure angle, lead angle, module) is a critical factor governing the dynamic mesh forces. This makes it a primary lever for noise control at the source.
- Practical Design Tool: The method provides two concrete metrics for virtual assessment: the frequency of the force fluctuations (to be steered away from structural resonances) and the amplitude of these fluctuations (to be minimized). Engineers can use this to perform parametric studies, evaluating dozens of screw gear design variations to find the configuration that minimizes dynamic excitation.
The implications for the design of low-noise screw gear systems are substantial. This FEM-based strategy enables a shift from a reactive, test-fix-test cycle to a proactive, simulation-driven design paradigm. By optimizing tooth geometry for smooth force transmission and minimizing transmission error through virtual prototyping, engineers can significantly reduce acoustic emissions. Future work can integrate this mechanical simulation with acoustic radiation models to predict sound pressure levels directly, creating a fully virtual noise prediction toolchain for screw gear drives and other power transmission systems.