
1. Introduction
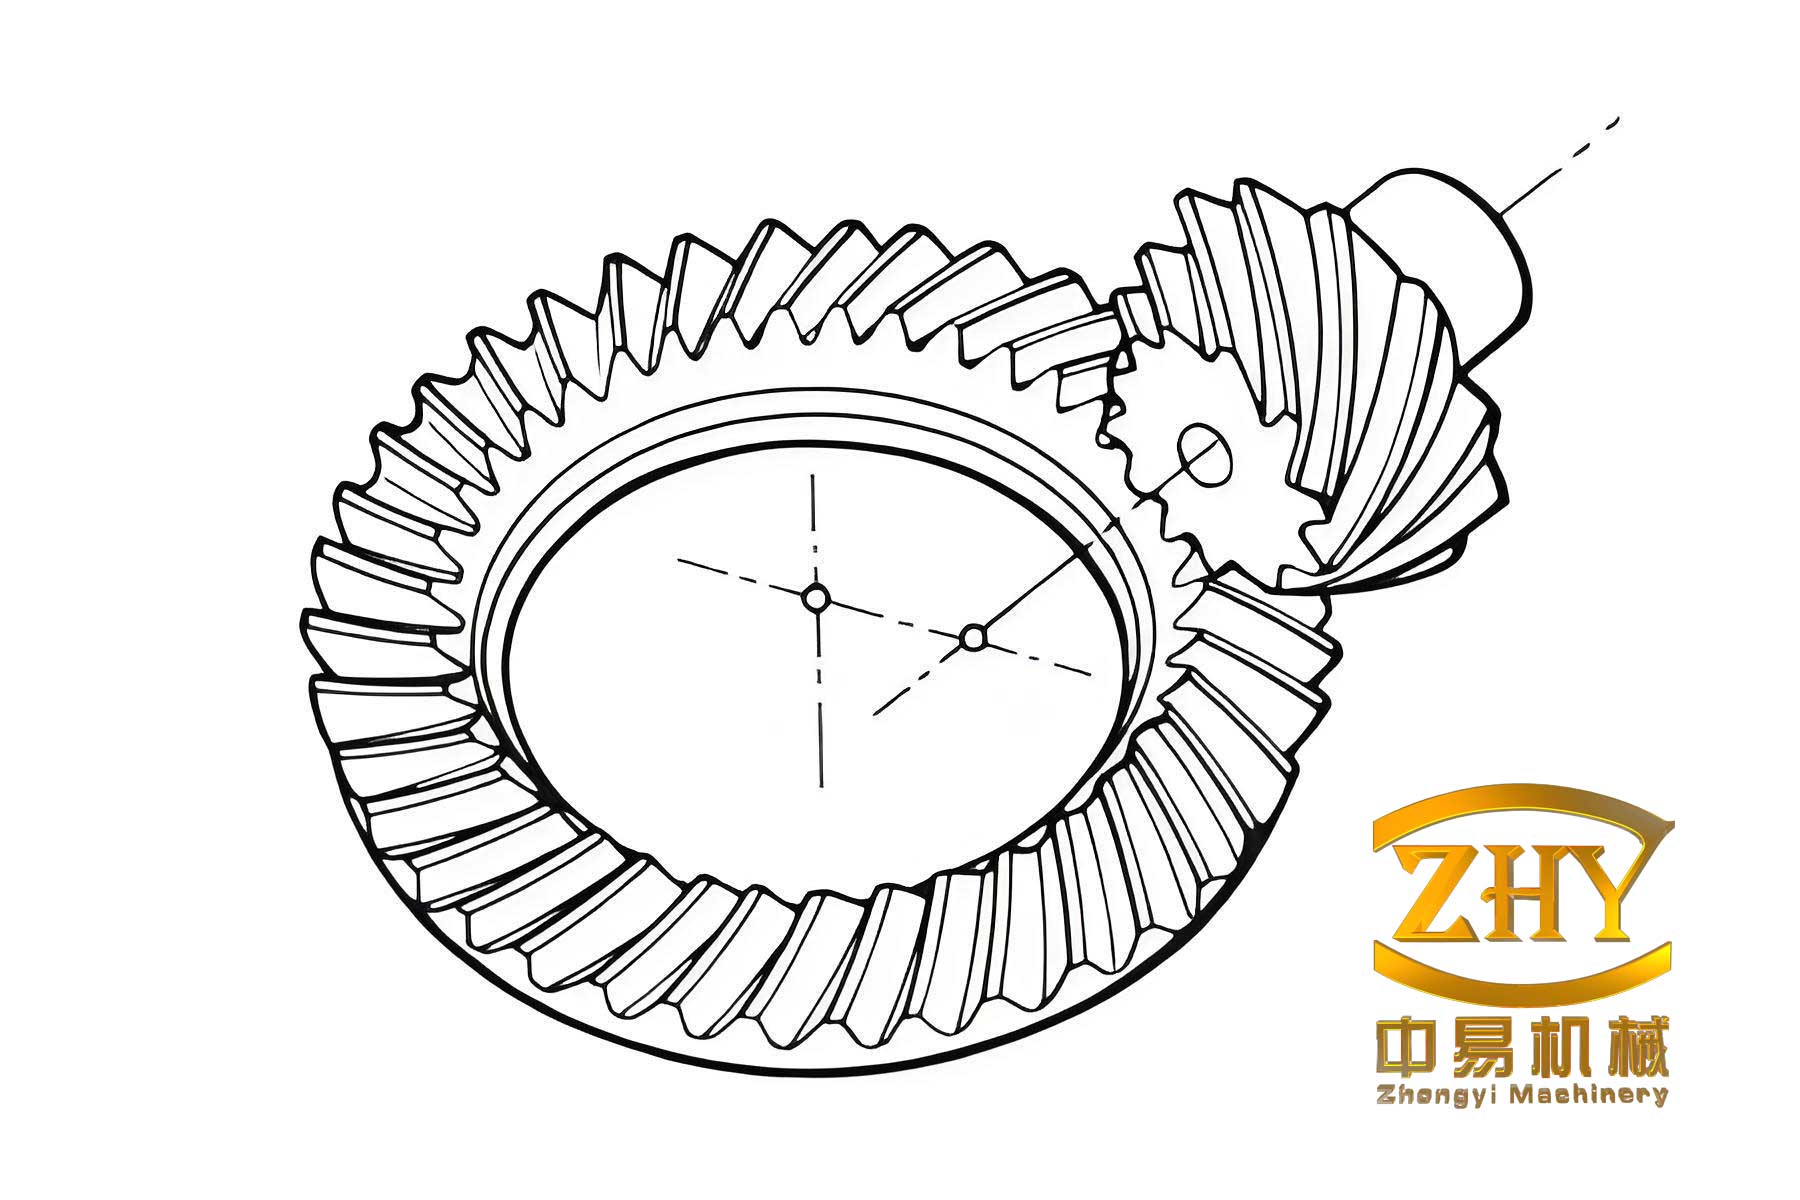
Extension epicycloids hypoid gears are widely used in automotive rear drive axle main reducers due to their high load-carrying capacity, smooth meshing performance, and low vibration noise. These gears are typically manufactured from low-carbon alloy steels and undergo heat treatment to achieve a hardened surface with a tough core, providing enhanced wear resistance and fatigue strength. However, the heat treatment process inevitably introduces distortion that affects the gear tooth surface geometry, leading to reduced accuracy and undesirable dynamic behavior. Understanding the meshing characteristics of hypoid gears after heat treatment distortion is therefore of great significance for improving gear design quality and predicting service performance.
The motivation of this research stems from the need to evaluate the influence of carburizing quenching heat treatment on the dynamic meshing behavior of hypoid gears. The full numerical simulation includes carburizing quenching heat treatment simulation, reverse modeling of distorted gears, and dynamic contact analysis. The research workflow combines thermal-mechanical-metallurgical coupled analysis with reverse engineering techniques and explicit finite element dynamics, providing a systematic approach to investigate the meshing performance of heat-treated hypoid gears.
2. Numerical Simulation of Carburizing Quenching for Hypoid Gears
2.1 Heat Treatment Process Design
Hypoid gears are typically manufactured from 20CrMoH low-carbon alloy steel. The heat treatment process includes preheating, pre-carburizing, carburizing, diffusion, pre-cooling, oil quenching, and tempering. The entire carburizing process is divided into four stages: pre-carburizing at 900°C-920°C with a carbon potential of 1% for 10800 seconds; strong carburizing at 920°C-930°C with a carbon potential of 1.15% for 9000 seconds; diffusion at 900°C-880°C with a carbon potential of 0.9% for 7200 seconds; and holding at 870°C-850°C with a carbon potential of 0.9% for 600 seconds. After carburizing, the gears are quenched in oil at 80°C-100°C for 1200 seconds, followed by tempering at 170°C-190°C for 3600 seconds.
2.2 Gear Model and Material Properties
The hypoid gear pair parameters are summarized in Table 1. The gear material is 20CrMoH steel with chemical composition shown in Table 2. The material properties including thermal conductivity, thermal expansion coefficient, heat capacity, and transformation latent heat were calculated using the JmatPro software. The temperature-dependent Young’s modulus and Poisson’s ratio of 20CrMoH are listed in Table 3.
| Parameter | Gear (Ring) | Pinion | Unit |
|---|---|---|---|
| Number of teeth | 47 | 11 | – |
| Reference point normal module | 3.15216 | mm | |
| Reference point spiral angle | 30.667 RH | 50 LH | ° |
| Shaft angle | 90 | ° | |
| Face width | 32 | 36.69 | mm |
| Offset distance | 30 | mm | |
| Pitch angle | 68.633 | 20.25 | ° |
| Reference point pitch radius | 86.12 | 26.97 | mm |
| Addendum | 1.07 | 5.23 | mm |
| Dedendum | 6.23 | 2.07 | mm |
| C | Mn | Ni | P | S | Mo | Cr | Si | Fe |
|---|---|---|---|---|---|---|---|---|
| 0.20 | 0.82 | 0.10 | 0.01 | 0.01 | 0.20 | 1.07 | 0.25 | Bal. |
| Temperature (°C) | Poisson’s ratio | Young’s modulus (GPa) |
|---|---|---|
| 0 | 0.290 | 210 |
| 300 | 0.301 | 193 |
| 600 | 0.319 | 152 |
| 900 | 0.345 | 117 |
2.3 Numerical Models for Heat Treatment Simulation
During heating, the austenite volume fraction transformation is described by the following equation:
$$ \beta_{A} = 1 – \exp\left[-\left(\frac{T – T_{s}}{T_{e} – T_{s}}\right)^{2}\right] \tag{1} $$
where T is the gear temperature, Ts is the lower critical temperature, and Te is the upper critical temperature.
For martensitic transformation during quenching, the Koistinen-Marburger equation is applied:
$$ \beta_{M} = \frac{1 – \exp\left[-0.011(M_{S} – T)\right]}{1 – \beta_{F} – \beta_{P} – \beta_{B}} \tag{2} $$
where MS is the martensite start temperature, and βF, βP, βB are the volume fractions of ferrite, pearlite, and bainite, respectively.
The JMAK equation is used for diffusive transformations during quenching:
$$ \beta = 1 – \exp\left(-kt^{n}\right) \tag{3} $$
For non-isothermal conditions, the Scheil additivity rule is incorporated. The carbon diffusion in austenite follows the equation:
$$ D_{C} = 4.53 \times 10^{-7} \left[1 + C_{A}(1 – C_{A})\right] \left(\frac{0.19}{T} – 1\right) \exp\left(-\frac{2.22 \times 10^{-4} + 17767 – 57.67T}{T}\right) \tag{4} $$
The heat conduction equation with phase transformation latent heat is expressed as:
$$ \rho C_{P} \dot{T} = \nabla \cdot (k_{t} \nabla T) + \Delta H_{F} \dot{\beta}_{F} + \Delta H_{P} \dot{\beta}_{P} + \Delta H_{B} \dot{\beta}_{B} + \Delta H_{M} \dot{\beta}_{M} \tag{5} $$
The total strain increment based on thermo-elastic-plastic theory is:
$$ d\varepsilon = d\varepsilon_{e} + d\varepsilon_{p} + d\varepsilon_{th} + d\varepsilon_{tr} \tag{6} $$
2.4 Dynamic Quenching Boundary Conditions
To accurately simulate the quenching process, dynamic heat transfer boundary conditions were applied considering the cooling medium flow velocity at different gear surfaces. The heat transfer coefficient functions for ISO-N32 quenching oil at different flow velocities are listed in Table 4.
| Velocity (m/s) | Heat transfer coefficient function h |
|---|---|
| 0 | 2284.35 + 4178.75exp[-(T-526.88)/26163.28] |
| 0.200 | 2348 + 4687exp[-(T-517.77)/22333.57] |
| 0.316 | 613.785 + 5173.55exp[-(T-576.727)/24231.69] (T ≤ 612.6°C) |
| 0.433 | 831.468 + 4723.51exp[-(T-525.392)/21482.5] (T ≤ 548°C) |
| 0.527 | 2720.3 + 5513exp[-(T-549.31)/16287.96] |
| 0.600 | 899.49 + 4505.56exp[-(T-551.31)/21368.23] (T ≤ 654.5°C) |
Table 5 presents the average flow velocities at different gear surfaces for various medium flow velocities. Based on these values, the corresponding heat transfer coefficient curves were selected for the inner ring, tooth surface, outer ring, and bottom surface of the hypoid gears during quenching simulation.
| Medium velocity (m/s) | Inner ring (m/s) | Tooth surface (m/s) | Outer ring (m/s) | Bottom surface (m/s) |
|---|---|---|---|---|
| 0.4 | 0.1245 | 0.0936 | 0.0607 | 0.0397 |
| 0.8 | 0.2481 | 0.1896 | 0.1694 | 0.1005 |
| 1.2 | 0.4537 | 0.3428 | 0.3189 | 0.1564 |
| 1.6 | 0.5662 | 0.4721 | 0.4813 | 0.1785 |
2.5 Simulation Results and Analysis
2.5.1 Carbon distribution
Table 6 summarizes the carbon content at different gear positions after each carburizing stage. The tooth tip exhibits the highest carbon content due to the sharp corner effect, followed by the tooth flank and bottom surface, while the tooth root and tooth core show relatively lower carbon content. The tooth core maintains the lowest carbon content throughout the carburizing process due to limited carbon diffusion depth.
| Stage | Tooth flank | Tooth tip | Tooth root | Bottom surface | Tooth core |
|---|---|---|---|---|---|
| Pre-carburizing | 0.703 | 0.761 | 0.595 | 0.702 | 0.225 |
| Strong carburizing | 0.853 | 0.955 | 0.781 | 0.824 | 0.227 |
| Diffusion | 0.751 | 0.863 | 0.660 | 0.751 | 0.230 |
| Holding | 0.756 | 0.851 | 0.656 | 0.745 | 0.231 |
2.5.2 Temperature distribution
The temperature evolution during quenching reveals distinct cooling rates at different gear positions. The tooth tip cools fastest, followed by the tooth flank, tooth root, bottom surface, and tooth core. After quenching for approximately 100 seconds, the temperature differences among tooth tip, flank, and root surfaces are within 11°C, while the difference between bottom surface and core is approximately 6°C. The maximum temperature difference across all positions is approximately 50°C.
2.5.3 Microstructure distribution
Table 7 presents the hardness and martensite content at different positions after heat treatment. The tooth tip shows the highest martensite content and hardness, followed by the tooth flank, tooth root, bottom surface, and tooth core. This distribution follows the cooling rate pattern—positions with faster cooling rates exhibit higher martensite transformation and consequently higher hardness values. The hardness distribution conforms to the desired external-hard internal-tough characteristic of carburized gears.
| Position | Tooth tip | Tooth flank | Tooth root | Bottom surface | Tooth core |
|---|---|---|---|---|---|
| Hardness (HRC) | 60.42 | 59.33 | 51.81 | 52.46 | 37.80 |
| Martensite volume fraction (%) | 0.982 | 0.974 | 0.830 | 0.795 | 0.636 |
2.5.4 Stress and strain distribution
The stress evolution during quenching shows that the tooth surface initially experiences tensile stress due to rapid cooling, then transitions to compressive stress as martensitic transformation begins and volumetric expansion occurs. The tooth core experiences the opposite stress sequence. After quenching, the residual stress on the tooth surface is compressive, which is beneficial for fatigue resistance, while the tooth core maintains tensile residual stress.
The strain analysis reveals significant thermal distortion at the large-end concave tooth root, the middle of the tooth tip, and the small-end convex tooth root. In particular, the tooth tip forms a convex bulge region due to combined thermal stress and transformation stress. The measured bulge length is approximately 23.136 mm.
Table 8 compares the simulated hardness and shape accuracy with the actual process requirements. All simulated values satisfy the practical manufacturing specifications.
| Item | Simulation | Process requirement |
|---|---|---|
| Tooth flank hardness (HRC) | 59.33 | 58-64 |
| Tooth core hardness (HRC) | 37.80 | 32-45 |
| Inner hole ellipticity (mm) | 0.024 | <0.07 |
| Bottom surface flatness (mm) | 0.028 | <0.07 |
3. Reverse Modeling of Hypoid Gears with Heat Treatment Distortion
3.1 Point Cloud Data Processing
The heat-treated gear model was exported from DEFORM software in STL format to obtain the point cloud data of the distorted hypoid gears. The point cloud was imported into Imageware for preprocessing. The initial point cloud contained 9735 points. Through simplification with a distance tolerance of 1 mm, the point count was reduced to 6405, a reduction of approximately 34%, significantly improving subsequent processing efficiency.
The point cloud processing sequence included: point cloud simplification, smoothing, visualization, outlier removal, and segmentation. The smoothing operation employed Gaussian filtering for the tooth flank regions to maintain high accuracy, and median filtering for the gear body regions to effectively eliminate burrs.
3.2 Tooth Surface Reconstruction
The tooth surfaces were reconstructed using NURBS curve interpolation and surface fitting in Imageware. The concave and convex tooth flanks were generated separately by interpolating curves through the divided point cloud sections. The reconstructed tooth surfaces were then exported in IGS format and imported into UG software for complete gear model reconstruction.
To validate the reconstruction accuracy, the deviation between the reconstructed tooth surfaces and the original point cloud was analyzed. Table 9 and Table 10 present the error analysis results for the concave and convex surfaces, respectively.
| Deviation type | Maximum | Average | Standard deviation |
|---|---|---|---|
| Lateral deviation | 0.0023 | 0.0000 | 0.0001 |
| Negative normal deviation | -0.0519 | -0.0293 | 0.0122 |
| Geometric deviation | 0.0519 | 0.0292 | 0.0123 |
| Positive normal deviation | 0.0017 | 0.0017 | 0.0275 |
| Deviation type | Maximum | Average | Standard deviation |
|---|---|---|---|
| Lateral deviation | 0.0000 | 0.0000 | 0.0000 |
| Negative normal deviation | -0.0447 | -0.0146 | 0.0100 |
| Geometric deviation | 0.0447 | 0.0125 | 0.0091 |
| Positive normal deviation | 0.0200 | 0.0091 | 0.0068 |
The gear diameter is 203.82 mm, and the tolerance for grade I reverse modeling is established as ±1.0191 mm (0.5% of the gear diameter). All maximum deviation values for both concave and convex surfaces are within this tolerance range, confirming that the reverse modeling achieves grade I accuracy.
3.3 Gear Transmission Error Analysis
The reconstructed hypoid gear model was imported into ADAMS software for transmission error analysis. The gear contact parameters used in the simulation are listed in Table 11. Four driving conditions were analyzed: forward driving (pinion concave driving gear convex), reverse driving (pinion convex driving gear concave), neutral forward (gear concave driving pinion convex), and neutral backward (gear convex driving pinion concave).
| Parameter | Value |
|---|---|
| Force exponent | 1.5 |
| Damping coefficient | 5×10⁴ |
| Stiffness coefficient | 3.16×10⁹ |
| Static sliding velocity | 0.0001 |
| Static friction coefficient | 0.08 |
| Dynamic sliding velocity | 0.01 |
| Dynamic friction coefficient | 0.05 |
| Penetration depth | 0.0001 |
Table 12 summarizes the transmission error analysis results for all four driving conditions. The average angular velocities under all conditions are close to the theoretical values, confirming the correctness of the reverse gear model.
| Condition | Max speed (°/s) | Average speed (°/s) | Min speed (°/s) | Theoretical speed (°/s) | Relative error (%) |
|---|---|---|---|---|---|
| Forward driving | 247.9174 | 210.6575 | 183.0035 | 210.6380 | 0.01 |
| Reverse driving | 236.7192 | 210.5223 | 188.3092 | 210.6380 | 0.05 |
| Neutral forward | 1187.7295 | 900.3571 | 661.9666 | 901.5450 | 0.13 |
| Neutral backward | 1075.5680 | 901.1479 | 745.8160 | 901.5450 | 0.04 |
4. Dynamic Contact Analysis of Reverse-Modeled Hypoid Gears
4.1 Finite Element Contact Theory
The nonlinear finite element equation for contact analysis in Total Lagrange coordinates is:
$$ [K_{0} + K_{u} + K_{\sigma}]\Delta a = {^{n+1}R} – {^{n}F} \tag{7} $$
where K0 is the small displacement stiffness matrix, Ku is the large displacement stiffness matrix, Kσ is the initial stress stiffness matrix, Δa is the incremental nodal displacement vector, n+1R is the equivalent nodal external force matrix, and nF is the equivalent nodal internal force matrix.
The Coulomb friction model used in the contact analysis is expressed as:
$$ \tau_{crit} = \min(\mu p, \tau_{max}) \tag{8} $$
where μ is the friction coefficient, p is the contact pressure, and τmax is the material shear yield stress.
4.2 Mesh Generation
Due to the complex geometry of hypoid gears, the Hypermesh software was used for mesh generation. A single tooth was extracted and meshed separately with refined elements on the tooth flank and coarser elements on the gear body. The complete gear model was then generated through rotational replication. The material properties assigned to the hypoid gears mesh are listed in Table 13.
| Property | Value |
|---|---|
| Elastic modulus | 2.10×10¹¹ Pa |
| Density | 7.84×10³ kg/m³ |
| Poisson’s ratio | 0.278 |
4.3 Contact Definition and Loading Conditions
The contact model was established between the pinion tooth surface (master surface) and the gear tooth surface (slave surface) using surface-to-surface contact with penalty function formulation and finite sliding. The kinematic constraints and loads were applied through reference points coupled to the gear bores. The contact simulation settings are summarized in Table 14.
| Item | Setting |
|---|---|
| Master surface | Pinion tooth surface |
| Slave surface | Gear tooth surface |
| Contact type | Surface-to-surface |
| Control | Explicit dynamic |
| Contact property | Dynamic friction |
| Contact method | Penalty method |
| Sliding formulation | Finite sliding |
The four driving conditions investigated were: forward driving (pinion concave driving gear convex), reverse driving (pinion convex driving gear concave), neutral forward (gear concave driving pinion convex), and neutral backward (gear convex driving pinion concave). The loading conditions for each case are summarized in Table 15. A smooth amplitude curve was applied to the load to avoid impact during loading ramp-up.
| Condition | Driving member | Driving surface | Driven member | Driven surface | Speed (rad/s) | Torque (N·mm) |
|---|---|---|---|---|---|---|
| Forward | Pinion | Concave | Gear | Convex | 104.667 | 1025 |
| Reverse | Pinion | Convex | Gear | Concave | 104.667 | 1025 |
| Neutral forward | Gear | Concave | Pinion | Convex | 24.492 | 240 |
| Neutral backward | Gear | Convex | Pinion | Concave | 24.492 | 240 |
4.4 Contact Simulation Results and Analysis
The dynamic contact simulation was performed using Abaqus/Explicit. The contact stress and contact area time-history responses were extracted for all four driving conditions. Table 16 summarizes the key characteristics of the contact response for each condition.
| Condition | Contact force range (kN) | Contact area range (mm²) | Number of contacting tooth pairs | Stability |
|---|---|---|---|---|
| Forward | 15-20 | 40-80 | 4 | Stable with periodic fluctuations |
| Reverse | 0-40 | 10-85 | 4 | Intermittent pulses with distinct impact |
| Neutral forward | 80-100 | 60-160 | 3 | Large values with wide fluctuation range |
| Neutral backward | 20-70 | 40-120 | 3 | Unstable with large fluctuations |
The simulation results demonstrate that the forward driving condition provides the most stable gear meshing with relatively small contact forces and consistent contact area, exhibiting clear periodicity. The reverse driving condition shows acceptable performance with moderate contact forces but noticeable impact. The neutral forward and neutral backward conditions produce significantly larger contact forces and areas with unstable fluctuation patterns, indicating severe gear damage potential. This finding confirms that the hypoid gear pair is optimally designed for forward driving, which aligns with practical automotive applications.
5. Experimental Validation
5.1 Heat Treatment Experiment
Carburizing quenching heat treatment experiments were conducted on hypoid gears using an Ipsen continuous heat treatment furnace. After heat treatment, the gear was cut to measure the hardness using a Rockwell hardness tester. Table 17 compares the simulated and measured hardness values.
| Position | Simulation (HRC) | Experiment (HRC) |
|---|---|---|
| Tooth flank | 59.33 | 59.2 |
| Tooth core | 36.9 | 37.8 |
The hardness values obtained from the numerical simulation closely match the experimental measurements, particularly for the tooth flank hardness. The small discrepancy in core hardness remains within acceptable engineering tolerance.
Microstructural examination using SEM revealed fine acicular martensite with retained austenite on the tooth flank, fine granular carbides at the tooth tip, and blocky ferrite in the tooth core region. The non-martensitic structure depth was measured at 0.017 mm from the surface, and internal oxidation depth was 0.012 mm, both within the required limit of 0.02 mm.
5.2 Tooth Surface Error Analysis
The tooth surface deviations were measured using a coordinate measuring machine (CMM) using the 45-point measuring method. The measured difference surface of the gear is compared with the simulation results. Both experimental and numerical results show the largest deviations at the large end, small end, tooth root, and tooth tip regions of the gear, confirming the accuracy of the heat treatment simulation.
5.3 Contact Performance Test
Contact performance experiments were conducted using a spiral bevel gear rolling tester. The gear was mounted on the tester with the driving shaft rotating at 1000 r/min under a load of 1025 N·m. The measured contact patterns on the gear concave and convex surfaces were compared with the digital contact patterns from the simulation. Table 18 summarizes the contact pattern comparison between experiment and simulation.
| Surface | Position along face width | Offset direction | Tilt rate |
|---|---|---|---|
| Concave (measured) | Approximately 1/3 from toe | Toward tooth tip and toe | Relatively large |
| Concave (simulated) | 26%-70% of face width | Toward tooth tip and toe | Relatively large |
| Convex (measured) | Approximately 1/3 from heel | Toward tooth root and toe | Relatively small |
| Convex (simulated) | 34.7%-80% of face width | Toward tooth root and toe | Relatively small |
The contact positions from the digital simulation agree reasonably well with the experimental measurements. Both show similar offset directions and comparable tilt rates. Minor differences exist in the contact zone shape, which can be attributed to reconstruction errors in the reverse-modeled gear surface and installation errors during the rolling test.
6. Conclusions
Based on the comprehensive numerical and experimental investigations of hypoid gears with heat treatment distortion, the following conclusions can be drawn:
(1) The carburizing quenching heat treatment simulation effectively predicts the carbon distribution, temperature evolution, microstructure transformation, and stress-strain distribution in hypoid gears. The tooth tip exhibits the highest carbon content and cooling rate, resulting in the highest martensite content and hardness. The tooth core maintains low carbon content and hardness, achieving the desired external-hard internal-tough microstructure. The simulated tooth flank hardness of 59.33 HRC and tooth core hardness of 37.80 HRC satisfy the process requirements of 58-64 HRC and 32-45 HRC, respectively. The thermal distortion is most pronounced at the large-end concave root, tooth tip middle, and small-end convex root regions, forming a convex bulge zone at the tooth tip.
(2) The reverse modeling of heat-treated hypoid gears through Imageware and UG achieves grade I accuracy with all tooth surface reconstruction errors within 0.5% of the gear diameter. The transmission error analysis confirms that the reconstructed gear model performs correctly, with relative errors below 0.13% under all four driving conditions. The pinion-driven configurations exhibit more stable transmission compared to gear-driven configurations, consistent with practical engineering experience.
(3) The dynamic contact analysis using Abaqus/Explicit reveals distinct contact characteristics under different driving conditions. The forward driving condition provides the most stable meshing with moderate contact forces and periodic contact area fluctuations. The neutral forward condition shows the largest contact forces (80-100 kN) and widest contact areas (60-160 mm²), indicating severe impact and potential gear damage. These findings highlight the importance of operating hypoid gears under the designed forward driving condition.
(4) The experimental validation demonstrates that the numerical simulation results for tooth flank hardness, tooth core hardness, tooth surface deviations, and contact patterns are in good agreement with physical measurements. The simulated contact patterns show comparable positions and tilt rates with the experimental rolling test results, confirming the overall accuracy of the complete numerical simulation methodology. Minor discrepancies in contact zone shape can be attributed to reconstruction errors in the reverse modeling process and installation errors during experimental testing.
This research provides a systematic methodology for evaluating the meshing characteristics of hypoid gears considering heat treatment distortion, offering valuable insights for gear design optimization and manufacturing quality improvement. Future work may focus on integrating heat treatment simulation and dynamic contact analysis within a unified finite element framework to further improve accuracy, as well as investigating the influence of different heat treatment parameters on the dynamic performance of hypoid gears.