
Herringbone gears are widely adopted in high-speed, heavy-duty, and high-power transmission systems because they combine the excellent load-carrying capacity and smooth engagement of helical gears while eliminating the detrimental axial thrust through the symmetric arrangement of left-hand and right-hand helical tooth halves. Despite these advantages, the time-varying mesh stiffness, gear manufacturing errors, and periodic engagement of multiple tooth pairs create internal excitation that leads to dynamic meshing forces, transmission vibrations, and gearbox noise. In this work, we focus on the dynamic simulation of a marine herringbone gear transmission and the vibration response analysis of its gearbox. The research systematically investigates the time-varying mesh stiffness, the dynamic meshing performance under transient acceleration, and the forced vibration of the gearbox subjected to bearing reaction forces. Both analytical lumped-parameter modeling and finite element techniques are employed to characterize the dynamic behavior of herringbone gears and the gearbox structure. The present study provides practical guidelines for the dynamic design, vibration control, and fatigue assessment of herringbone gear systems.
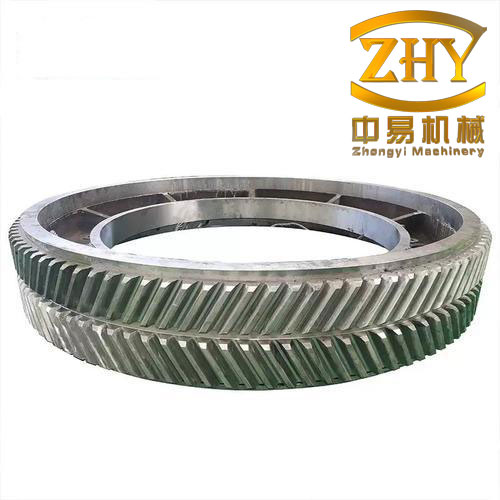
Herringbone gears can be regarded as two helical gear pairs with opposite helix angles arranged symmetrically. When the manufacturing and assembly accuracies are high, the axial forces of the two halves cancel each other, so the axial vibration can be neglected in the dynamic model. This simplification allows a six-degree-of-freedom (DOF) lumped-parameter model to capture the essential behavior of the herringbone gear pair. We established the mathematical model by treating the shafts as rigid bodies and representing the bearing supports as spring-damper elements. The time-varying mesh stiffness and mesh damping were incorporated into the coupled translational–rotational equations. The model provides a foundation for predicting dynamic meshing forces, vibration transmission paths, and gearbox responses.
1. Dynamic Model and Governing Equations
In the development of the herringbone gear dynamic model, the two helical gear pairs on the left and right halves share identical geometric parameters and material properties. Because of symmetry, half of the herringbone gear system was analyzed first and then extended to the full gear pair. The geometric parameters of the helical gear pair are listed in Table 1.
| Parameter | Pinion (active) | Gear (driven) |
|---|---|---|
| Number of teeth | 31 | 102 |
| Normal module (mm) | 4.5 | 4.5 |
| Normal pressure angle | 20° | 20° |
| Helix angle | 28.2024° | 28.2024° |
| Face width (mm) | 90 | 90 |
| Mass (kg) | m1 | m2 |
| Moment of inertia (kg·mm²) | I1 | I2 |
The generalized displacement vector of the half model is given by
$$ \boldsymbol{\delta} = \left[ x_1,\; y_1,\; \theta_1,\; x_2,\; y_2,\; \theta_2 \right]^{\mathrm{T}} $$
where \(x_i\) and \(y_i\) (\(i=1,2\)) are the translational vibration displacements of the pinion and gear centers in the \(x\)- and \(y\)-directions, respectively, and \(\theta_i\) are the rotational vibration displacements about the axial direction. The dynamic meshing force projected along the line of action can be expressed in terms of the mesh stiffness \(k_m\), mesh damping \(c_m\), and the transmission error \(e\). The normal mesh stiffness and damping are normalized to the transverse direction as
$$ k_{my} = k_m \cos^2\beta,\qquad c_{my} = c_m \cos^2\beta,\qquad e_y = e \cos\beta $$
where \(\beta\) is the helix angle. The dynamic meshing force in the \(y\)-direction is
$$ F_y = k_{my} \left( y_1 + R_{t1}\theta_1 – y_2 + R_{t2}\theta_2 – e_y \right) + c_{my} \left( \dot{y}_1 + R_{t1}\dot{\theta}_1 – \dot{y}_2 + R_{t2}\dot{\theta}_2 – \dot{e}_y \right) $$
Here \(R_{t1}\) and \(R_{t2}\) denote the base circle radii of the pinion and gear in the transverse plane. The teeth friction force is approximated by
$$ F_f = \lambda f F_n $$
where \(f\) is the equivalent friction coefficient and \(\lambda = \pm 1\) indicates the direction of the friction force. The normal tooth force \(F_n\) is related to the transmitted torque \(T_L\) through
$$ F_n = \frac{2 T_L}{m_n z \cos\alpha_n} $$
where \(m_n\) is the normal module, \(z\) is the number of teeth, and \(\alpha_n\) is the normal pressure angle. The complete vibration differential equations of the six-DOF system are written in matrix form as
$$ \mathbf{M} \ddot{\boldsymbol{\delta}} + \mathbf{C} \dot{\boldsymbol{\delta}} + \mathbf{K} \boldsymbol{\delta} = \mathbf{P}(t) $$
where \(\mathbf{M}\), \(\mathbf{C}\), and \(\mathbf{K}\) are the mass, damping, and stiffness matrices, respectively, and \(\mathbf{P}(t)\) is the external force vector that includes the input torque, load torque, and excitation caused by transmission error. The damping matrix adopts the Rayleigh damping form
$$ \mathbf{C} = \alpha \mathbf{M} + \beta \mathbf{K} $$
The mass matrix is a diagonal matrix containing the masses and moments of inertia of the pinion and gear. The stiffness matrix includes the bearing support stiffness as well as the time-varying mesh stiffness terms. This model was used to analyze the natural characteristics and dynamic responses of the transmission system.
2. Time-Varying Mesh Stiffness of Herringbone Gears
The mesh stiffness of gears is defined as the load required to produce a unit elastic deformation along the line of action. In a gear pair, the number of tooth pairs in contact and the contact location change periodically during the meshing cycle, causing the combined elastic deformation to vary with time. This time-varying mesh stiffness serves as a parametric excitation source in gear dynamics and directly influences the vibration level of the gearbox.
The herringbone gear mesh stiffness can be obtained by connecting the stiffness of the two helical gear halves in parallel. Therefore, we first computed the mesh stiffness of a single helical gear pair. For helical gears, the tooth contact lines are inclined, and the load distribution is non-uniform; therefore, a two-dimensional simplification is inadequate, and a three-dimensional finite element model is required.
2.1 Finite Element Model for Helical Gear Contact
We developed a ten-tooth segment model of the helical gear pair, including the gear hub, to balance computational efficiency and accuracy. The hub deformation has a significant influence on the mesh stiffness. A static contact analysis was performed in ABAQUS. The inner bore surface of each gear was connected to a reference point on the rotation axis through a rigid coupling constraint. The pinion reference point was constrained except for rotation around the axis, while a torque was applied to the gear reference point. The contact pairs were defined on the tooth flank surfaces with hard normal contact and frictionless tangential behavior.
To validate the finite element contact approach, a spur gear pair was first analyzed and the maximum contact stress was compared with the Hertzian contact theory. The comparison is presented in Table 2.
| Torque (N·m) | Hertz stress (MPa) | Finite element stress (MPa) | Relative error (%) |
|---|---|---|---|
| 460 | 750.7 | 707.9 | -5.7 |
| 560 | 838.6 | 795.0 | -5.2 |
| 660 | 918.9 | 874.4 | -4.8 |
| 760 | 993.4 | 932.8 | -6.1 |
| 860 | 1063.1 | 1004.6 | -5.5 |
The finite element results agree well with the Hertz analytical results, with errors within 10%. This confirms that the adopted mesh density and contact algorithm are suitable for gear contact analysis.
2.2 Calculation of Helical Gear Mesh Stiffness
The loaded transmission error (LTE) of the gear pair is obtained from the finite element analysis by measuring the angular positions of the pinion and gear:
$$ \mathrm{LTE} = R_{bn1}\theta_1 – R_{bn2}\theta_2 $$
where \(R_{bn1}\) and \(R_{bn2}\) are the base circle radii of the pinion and gear in the normal plane. The no-load transmission error (NLTE) was similarly obtained under a very small torque (15 N·m). The elastic deformation caused by the load is the difference between the LTE and NLTE:
$$ \delta = \mathrm{LTE} – \mathrm{NLTE} $$
The mesh stiffness of the helical gear pair is then
$$ k = \frac{F_n}{\delta} $$
The normal contact force \(F_n\) was extracted from the finite element analysis. Finally, the herringbone gear mesh stiffness was calculated as twice the helical gear stiffness:
$$ k_m = 2k $$
The contact force curves of the helical gear pair reveal alternating four-tooth and five-tooth engagement regions. The total contact ratio was obtained as 4.75 under load, while the theoretical no-load contact ratio was 4.46. Under the rated torque, the contact ratio increased by 0.29. The time-varying mesh stiffness of the helical gear pair and the herringbone gear pair is presented in Table 3.
| Parameter | Helical gear | Herringbone gear |
|---|---|---|
| Maximum stiffness (N/m) | 1.453 × 10⁹ | 2.906 × 10⁹ |
| Minimum stiffness (N/m) | 1.446 × 10⁹ | 2.892 × 10⁹ |
| Mean stiffness (N/m) | 1.449 × 10⁹ | 2.898 × 10⁹ |
| Stiffness fluctuation (%) | 0.48 | 0.48 |
The small fluctuation of the mesh stiffness is attributed to the large total contact ratio of the herringbone gear, which ensures smooth engagement and lower excitation levels.
2.3 Parametric Study of Mesh Stiffness
We further investigated the influence of the gear hub, external load, and elastic modulus on the helical gear mesh stiffness, which directly applies to herringbone gears.
A no-hub model was constructed with identical gear tooth geometry and mesh density. The contact force was nearly the same, but the LTE decreased and the mesh stiffness increased by 12% when the hub was omitted. The numerical results are summarized in Table 4.
| Model | Maximum LTE (μm) | Maximum stiffness (10⁹ N/m) |
|---|---|---|
| With hub | 10.99 | 1.453 |
| Without hub | 10.40 | 1.627 |
Therefore, the gear hub deformation must not be neglected in the stiffness calculation. The influence of the external load on the LTE and the mesh stiffness is shown in Table 5.
| Torque (kN·m) | LTE max (μm) | Stiffness max (10⁹ N/m) |
|---|---|---|
| 1.0 | 5.6 | 1.25 |
| 1.5 | 6.9 | 1.30 |
| 2.0 | 8.1 | 1.35 |
| 2.5 | 9.3 | 1.39 |
| 3.0 | 10.4 | 1.42 |
The LTE increases linearly with load, while the mesh stiffness increases asymptotically. The effect of the elastic modulus was also examined by varying \(E\) from 50 GPa to 200 GPa. With increasing elastic modulus, the LTE decreases and the mesh stiffness increases linearly. The relationship between the mesh stiffness and the elastic modulus is summarized in Table 6.
| Elastic modulus (GPa) | LTE max (μm) | Stiffness max (10⁹ N/m) |
|---|---|---|
| 50 | 38 | 0.38 |
| 100 | 19 | 0.72 |
| 150 | 13 | 1.09 |
| 200 | 10 | 1.45 |
3. Dynamic Meshing Performance of Herringbone Gears
Gear transmissions are frequently operated under repeated start-up, steady-state, and shut-down conditions. During the start-up acceleration phase, severe mesh impact occurs, and the dynamic meshing force can significantly exceed the static value. This transient impact generates high tooth contact stresses and tooth root bending stresses, which are closely related to tooth fatigue. We developed a full-tooth finite element model of the herringbone gear pair to study the dynamic meshing performance using the ABAQUS/explicit dynamic contact algorithm.
3.1 Finite Element Model and Simulation Setup
The complete herringbone gear model included all the teeth in the mesh zone. The mesh was refined on the tooth flanks of the engaging teeth and coarsened elsewhere to control the computational cost. The model contained 910,084 elements and 1,075,910 nodes. The element type was C3D8R with enhanced hourglass control. The material properties are given in Table 7.
| Parameter | Value |
|---|---|
| Density (kg/m³) | 7.8 × 10³ |
| Elastic modulus (Pa) | 2.09 × 10¹¹ |
| Poisson’s ratio | 0.29 |
Reference points were created at the centers of the pinion and gear and connected to the inner bore surfaces through kinematic coupling constraints. The pinion reference point was constrained in all DOFs except rotation about the axial direction. A rotational speed of 1000 rpm was applied to the pinion, and a load torque of 6000 N·m was applied to the gear. The speed and torque were ramped smoothly using amplitude curves to avoid abrupt initial impact. Rayleigh damping was adopted with mass and stiffness proportional coefficients \(\alpha = 800\ \mathrm{rad/s}\) and \(\beta = 5\times 10^{-8}\).
3.2 Mesh Impact Characteristics
The rotational speed curves of the pinion and gear were extracted during the start-up period. The pinion speed increased gradually from zero to the stable value of 104.67 rad/s, while the gear speed reached 31.8 rad/s, matching the prescribed transmission ratio. The angular acceleration curves show severe oscillations in the first 0.1 ms of engagement, with a peak value reached at approximately 0.5 ms. After about 1 ms, the angular acceleration rapidly decayed to near zero due to the system damping.
The dynamic contact force curves of the first six tooth pairs are shown in Fig. 4 (not referenced here for brevity). The first five tooth pairs entering the mesh zone exhibit significant impact peaks, whereas the sixth tooth pair enters after the initial impact has subsided and therefore shows a smoother force profile.
3.3 Tooth Contact Stress
The contact stress distribution on the tooth flanks of the herringbone gear was obtained at different time instants. At 2.6 ms, five tooth pairs are in contact and the gear carries the load with relatively uniform stress distribution. The contact stress on most of the tooth flank is in the range of 250–300 MPa, with localized values up to 600 MPa at the tooth tip due to stress concentration. At 7.8 ms, only four tooth pairs are in contact, resulting in higher contact stress levels. The maximum value reaches 700 MPa at the tooth tip.
The time histories of contact stress at selected element positions on the active and driven gear tooth flanks were also extracted. The results follow the expected trend based on the local radius of curvature: the contact stress decreases as the radius of curvature increases along the involute profile.
The contact stress distribution along the contact line path is relatively uniform, confirming that the herringbone gear has favorable load-sharing characteristics.
3.4 Tooth Root Bending Stress
Tooth root bending stress is one of the most critical indicators for gear fatigue design. The stress induced at the tooth root during the dynamic meshing process was evaluated for both the active and driven gears. The bending stress cloud maps show symmetric distributions on the left and right helical halves. The stress on the active gear tooth root is generally less than 140 MPa, while the driven gear tooth root stress remains below 120 MPa.
During the mesh impact stage (0–1 ms), the dynamic tooth root bending stress peaks reach approximately twice the steady-state value. The maximum bending stresses of the active and driven gears are 212 MPa and 185 MPa, respectively. The driven gear exhibits lower bending stress because of its larger base circle radius and reduced stress concentration at the tooth root.
The time history curves of the bending stress reveal an important physical phenomenon. For the active gear, the bending stress increases slowly as the contact point moves from the tooth root toward the tooth tip, and then drops rapidly after the tooth exits the mesh. In contrast, the driven gear shows a rapid increase followed by a gradual decrease, which is consistent with the reversed engagement direction.
3.5 Parametric Study of Dynamic Meshing Performance
We systematically investigated the influence of system damping, rotational speed, and load torque on the dynamic meshing performance of herringbone gears. The main results are summarized in Table 8.
| Parameter | Effect on speed and angular acceleration | Effect on tooth root bending stress |
|---|---|---|
| Damping coefficient \(\alpha\) | Higher damping reduces oscillation amplitude and accelerates decay. | Higher damping reduces stress fluctuation and accelerates stabilization. |
| Rotational speed \(n\) | Higher speed increases impact peak and oscillation amplitude; decay rate is unchanged. | Higher speed increases the peak bending stress and oscillation. |
| Load torque \(T_L\) | Negligible effect on rotational speed and angular acceleration. | Higher load increases bending stress, but not proportionally. |
The results indicate that increasing the system damping is an effective way to suppress the transient impact response of the herringbone gear transmission. Increasing the operating speed intensifies the mesh impact and should be considered carefully in the design of high-speed gear systems. The load torque mainly affects the mean level of the bending stress and has little influence on the transient oscillation characteristics.
4. Modal Analysis of the Gearbox
The gearbox housing is a complex thin-walled structure that transmits the dynamic forces from the gear mesh to the supporting foundation. To predict the vibration response of the gearbox, we first performed finite element modal analysis of the gear transmission shafts and the gearbox housing.
4.1 Shaft Modal Analysis
The finite element models of the active shaft and driven shaft were established in Hypermesh. The bearings were modeled by coupling the inner bore surfaces to reference points and constraining all degrees of freedom except rotation about the shaft axis. The first ten natural frequencies and mode shapes of the active shaft and driven shaft are summarized in Tables 9 and 10, respectively.
| Mode | Frequency (Hz) | Mode shape description |
|---|---|---|
| 1 | 0 | Rigid rotation about z-axis |
| 2 | 1462.5 | Local expansion |
| 3 | 1511.3 | Local bending |
| 4 | 1511.3 | Local bending |
| 5 | 2163.6 | Local axial deformation |
| 6 | 2219.9 | Transverse bending |
| 7 | 2220.0 | Transverse bending |
| 8 | 2522.0 | Complex local deformation |
| 9 | 2522.5 | Complex local deformation |
| 10 | 2799.7 | Local rotation |
| Mode | Frequency (Hz) | Mode shape description |
|---|---|---|
| 1 | 0 | Rigid rotation about z-axis |
| 2 | 238.55 | Local rotation |
| 3 | 238.60 | Local rotation |
| 4 | 506.86 | Local axial deformation |
| 5 | 567.29 | Transverse bending |
| 6 | 567.95 | Transverse bending |
| 7 | 741.93 | Local expansion |
| 8 | 899.20 | Local bending |
| 9 | 899.20 | Local bending |
| 10 | 916.22 | Complex deformation |
The driven shaft exhibits lower natural frequencies due to its larger mass and reduced hub stiffness. The repeated frequencies appearing in pairs correspond to symmetric mode shapes caused by the nearly axisymmetric structure of the shafts.
4.2 Gearbox Housing Modal Analysis
The gearbox housing is made of grey cast iron HT300 with material properties listed in Table 11. The upper and lower housing parts were connected using tie constraints to simulate bolted joints. The bolt holes at the base of the lower housing were fully constrained.
| Parameter | Value |
|---|---|
| Density (kg/m³) | 7.3 × 10³ |
| Elastic modulus (Pa) | 1.3 × 10¹¹ |
| Poisson’s ratio | 0.25 |
The first ten natural frequencies and corresponding mode shape descriptions of the gearbox housing are given in Table 12.
| Mode | Frequency (Hz) | Mode shape description |
|---|---|---|
| 1 | 188.2 | Ventilation hole vibration |
| 2 | 259.13 | Swing in z-direction |
| 3 | 264.12 | Expansion–contraction |
| 4 | 313.68 | Top cover twisting |
| 5 | 359.68 | Upper housing z-motion |
| 6 | 385.47 | Housing contraction |
| 7 | 389.43 | Squeezing deformation |
| 8 | 406.01 | Side wall twisting |
| 9 | 420.37 | Side wall and top twisting |
| 10 | 433.87 | Twisting and z-swing |
The fundamental frequency of the gearbox housing is 188.2 Hz, and all of the first ten natural frequencies are below 500 Hz. The mode shapes indicate that most of the deformation is concentrated in the upper housing, whereas the lower housing remains nearly rigid because of the fixed boundary condition at the base bolt holes.
5. Gearbox Vibration Response Analysis
The dynamic forces generated at the gear mesh are transmitted through the shafts and bearings to the gearbox housing. To analyze the gearbox vibration response, we first extracted the bearing reaction forces from a multi-body dynamics simulation of the herringbone gear transmission system.
5.1 Multi-body Dynamics Model and Bearing Forces
A multi-body dynamics model of the herringbone gear transmission system was established in ADAMS. The pinion was fixed to the active shaft, and the gear was fixed to the driven shaft. The bearings were modeled using bushing elements at four bearing locations. The input speed was 1000 rpm, and the load torque was 6000 N·m. The contact between the gear teeth was defined using the impact function with a mesh stiffness of 2.9 × 10⁶ N/mm, a force exponent of 1.5, and a contact damping coefficient of 30 N·s/mm. Static and dynamic friction coefficients of 0.3 and 0.1 were specified.
The simulation ran for 0.2 s with 2000 steps. The data from 0.04 s to 0.06 s were extracted to avoid the initial transient stage. The bearing reaction forces of the active and driven shafts are summarized in Table 13.
| Bearing | Mean resultant force (kN) |
|---|---|
| Active shaft bearing 1 | 8.8 |
| Active shaft bearing 2 | 8.6 |
| Driven shaft bearing 1 | 6.9 |
| Driven shaft bearing 2 | 6.8 |
The frequency spectrum of the bearing reaction forces shows distinct peaks at the gear mesh frequency of 516 Hz and its harmonics, confirming the validity of the simulation. The gear mesh frequency was calculated as
$$ f_m = \frac{n z_1}{60} = \frac{1000 \times 31}{60} = 516.7\ \mathrm{Hz} $$
5.2 Vibration Response Using Modal Superposition
The governing equation for the forced vibration of the gearbox housing can be expressed as
$$ \mathbf{M}\ddot{\mathbf{u}} + \mathbf{C}\dot{\mathbf{u}} + \mathbf{K}\mathbf{u} = \mathbf{F}(t) $$
where \(\mathbf{F}(t)\) is the vector of bearing reaction forces applied at the bearing supports. The modal superposition method was employed to compute the vibration response. The first 20 modes of the gearbox housing were extracted. The bearing reaction forces in the horizontal and vertical directions were applied at the corresponding bearing support nodes.
The stress distribution of the gearbox housing at different response times indicates that the connections between the stiffening ribs and the housing side walls, as well as the base bolt holes, are the most vulnerable locations. The stress concentration at these positions requires attention in the design process. It is recommended to increase the effective dimensions and use fillets in these areas to reduce stress concentration.
Two reference points were selected to investigate the vibration response: point A at the bearing housing near the active shaft input end and point B at the bearing housing near the driven shaft output end. The vibration displacement, velocity, and acceleration in the \(x\)- and \(y\)-directions were extracted. The main results are summarized in Table 14.
| Reference point | Direction | Peak displacement (μm) | Peak velocity (μm/s) | Peak acceleration (m/s²) |
|---|---|---|---|---|
| A | x | 0.55 | 1850 | 5.8 |
| A | y | 0.28 | 760 | 1.9 |
| B | x | 0.42 | 1420 | 4.6 |
| B | y | 0.22 | 610 | 1.6 |
The vibration displacement, velocity, and acceleration at point A are consistently larger than those at point B, which is consistent with the larger bearing reaction forces on the active shaft. In both directions, the \(x\)-directional vibration is larger than the \(y\)-directional vibration because the stiffening ribs provide higher stiffness in the vertical direction. The frequency spectrum of the vibration displacement exhibits peaks at the gear mesh frequency, indicating that the gearbox housing vibrates most strongly at the mesh frequency. The response amplitudes at the mesh frequency and its harmonics should be strictly controlled to reduce gearbox noise and vibration.
6. Conclusions
In this study, we carried out a comprehensive dynamic simulation of herringbone gears and the vibration response analysis of the gearbox. The main achievements and conclusions are as follows:
(1) A six-degree-of-freedom lumped-parameter dynamic model of the herringbone gear transmission was established, incorporating time-varying mesh stiffness, mesh damping, transmission error, and bearing flexibility. The mass, damping, and stiffness matrices were derived systematically, providing a basis for the dynamic analysis of herringbone gears.
(2) The time-varying mesh stiffness of the herringbone gear was calculated based on the loaded transmission error using a finite element static contact algorithm. The herringbone gear mesh stiffness was obtained by connecting the two helical gear halves in parallel. The gear hub deformation significantly affects the stiffness result: ignoring the hub led to a 12% increase in the computed stiffness. The mesh stiffness increases with load asymptotically and increases linearly with the elastic modulus.
(3) The full-tooth finite element model of the herringbone gear pair was built, and the explicit dynamic contact algorithm was used to study the transient meshing behavior during start-up acceleration. The mesh impact causes high peaks in the angular acceleration and tooth contact forces. The maximum tooth root bending stresses during the impact stage reach approximately twice the steady-state values. The parametric study showed that increasing the system damping effectively suppresses the transient oscillation, increasing the rotational speed intensifies the mesh impact, and increasing the load torque increases the bending stress in a nonlinear manner.
(4) The modal analysis of the active shaft, driven shaft, and gearbox housing revealed that the low-order natural frequencies of the gearbox housing are all below 500 Hz. The bearing reaction forces extracted from the multi-body dynamics simulation show dominant components at the gear mesh frequency and its harmonics. The vibration response of the gearbox, obtained using the modal superposition method, indicates that the most vulnerable areas are the connections between the stiffening ribs and the side walls and the base bolt holes. The vibration response at the input bearing location is larger than that at the output bearing location, and the horizontal vibration is more significant than the vertical vibration. The gearbox housing vibrates most intensively at the gear mesh frequency of 516 Hz.
The present research provides a systematic framework for the dynamic analysis of herringbone gears and offers practical guidance for the dynamic design, vibration control, and fatigue life assessment of herringbone gear transmission systems. Future work will extend the current approach to the acoustic radiation analysis of the gearbox and the optimization of tooth profile modifications to further reduce vibration and noise.