
In my work on 6×4 electric heavy-duty trucks, I have found that the electric drive axle has become a central architecture for replacing conventional engine-driven powertrains. The integrated electric drive axle combines a high-power-density permanent magnet synchronous motor, a two-speed planetary transmission, and a final drive into one compact unit. Within this architecture, the pinion gear is one of the most highly loaded and fatigue-sensitive components. Because the pinion gear operates under high torque, frequent shifting, and strong thermal-mechanical coupling, its structural design and life control directly determine the reliability of the entire electric drive axle. I therefore focus this study on the fatigue life optimization of the pinion gear in a commercial vehicle electric drive axle.
My investigation is motivated by a practical problem. In a two-speed transmission with a peak motor torque of 500 Nm and speed ratios of 16 and 51, the pinion gear experiences severe load fluctuations. These fluctuations can lead to tooth surface pitting, tooth root cracking, and other fatigue failures. Many existing design methods ignore the combined effects of dynamic load and manufacturing error, so the theoretical life differs greatly from the actual service life. To solve this problem, I establish a load model that considers representative operating cycles, use finite element analysis and Miner damage theory to predict fatigue life, and apply a multi-objective optimization algorithm to adjust the pinion gear parameters systematically. I then evaluate the optimized design through bench tests and real-road trials.
1. Electric Drive Axle Architecture and Load Characteristics
In my analysis, the 6×4 electric heavy truck uses an integrated electric drive axle as the core of its powertrain. The transmission chain mainly consists of a high-power-density permanent magnet synchronous motor, a two-speed planetary gear mechanism, and a main reducer. This forms a highly integrated system that performs power output, speed ratio switching, and differential driving. Compared with a traditional internal combustion engine system, the electric drive axle removes the engine, the intermediate drive shaft, and the multi-stage manual transmission. As a result, the transmission path is shorter, energy transfer efficiency is higher, and the structure is more compact. However, the limited axle space and high integration requirements reduce gear spacing and increase load density. This makes the pinion gear more vulnerable to contact fatigue, root bending failure, and lubrication degradation.
| Subsystem | Main Function | Relevance to Pinion Gear Fatigue |
|---|---|---|
| Permanent magnet synchronous motor | Provides traction torque and regenerative braking | High peak torque and fast torque reversal increase pinion gear dynamic load |
| Two-speed planetary transmission | Switches between high-torque and low-speed ratios | Ratio change causes impact load on pinion gear teeth |
| Final drive | Provides additional speed reduction and differential action | Determines the final torque multiplication seen by the pinion gear |
| Lubrication and cooling | Controls friction, wear, and temperature | Oil film thickness affects pinion gear pitting and scoring risk |
1.1 Transmission Chain Structure
I modeled the electric drive axle transmission chain as a series of inertias, stiffnesses, and gear meshes. The pinion gear is the first highly loaded gear in the reduction path. Its input torque is derived from the motor, while its output torque is multiplied by the downstream ratio. Because the motor can produce maximum torque almost instantly, the pinion gear does not experience a smooth load ramp. Instead, it experiences a step-like torque input during start-up, grade climbing, and shift recovery. This behavior is different from a conventional diesel powertrain, where the clutch and engine inertia filter some of the torque fluctuations.
I express the ideal torque at the pinion gear as
$$ T_{p} = i_{g} i_{0} \eta_{t} T_{m} $$
where \(T_{p}\) is the torque at the pinion gear, \(i_{g}\) is the transmission ratio, \(i_{0}\) is the final drive ratio, \(\eta_{t}\) is the transmission efficiency, and \(T_{m}\) is the motor output torque. In reality, the dynamic torque includes an inertial term:
$$ T_{p,dyn} = T_{p} + J_{eq} \frac{d\omega}{dt} + C_{eq} \omega $$
where \(J_{eq}\) is the equivalent inertia, \(\omega\) is the angular velocity, and \(C_{eq}\) is the equivalent damping. This dynamic term is important because the pinion gear is subjected to frequent ratio changes and regenerative braking events.
1.2 Motor Output Characteristics and Gear Load Modeling
The electric drive axle system I studied is matched with a permanent magnet synchronous motor with a rated power of 160 kW, a peak torque of 500 Nm, and a maximum speed of 12,000 r/min. To meet the demands of vehicle starting, full-load grade climbing, and constant-speed cruising, the electric drive axle uses two speed ratios: 16 for the high-torque starting stage and 51 for the low-speed heavy-load stage. I extracted load data from a vehicle dynamics simulation platform and constructed a pinion gear input torque versus time history curve. I then combined the ratio switching logic, load disturbance, and system inertia variation to build a multi-condition pinion gear meshing load model.
| Parameter | Value | Unit | Effect on Pinion Gear |
|---|---|---|---|
| Rated motor power | 160 | kW | Determines continuous torque capacity |
| Peak motor torque | 500 | Nm | Sets maximum root bending stress |
| Maximum motor speed | 12,000 | r/min | Influences mesh frequency and noise |
| Low speed ratio | 16 | — | High-torque starting and grade climbing |
| High speed ratio | 51 | — | Low-speed heavy-load operation |
| Nominal transmission efficiency | 96.5 | % | Affects thermal load and fatigue damage |
The load spectrum I used includes four representative stages: starting traction, grade climbing, high-speed cruising, and dynamic braking. Each stage has a different torque level and cycle count. The pinion gear sees the highest torque during grade climbing at the 51 ratio. During high-speed cruising, the torque is lower, but the mesh frequency is higher. During dynamic braking, the torque reverses, which can cause a different stress state on the non-drive side of the pinion gear teeth.
| Operating Stage | Ratio | Torque at Pinion Gear (Nm) | Duration Share (%) | Cycle Count per 10,000 km |
|---|---|---|---|---|
| Starting traction | 51 | 420 | 12 | 3.2×10^5 |
| Grade climbing | 51 | 500 | 18 | 5.8×10^5 |
| High-speed cruising | 16 | 180 | 55 | 2.1×10^7 |
| Dynamic braking | 16 | −220 | 15 | 4.6×10^6 |
1.3 Stress Boundary Derivation and Critical Working Condition Identification
I derived the stress boundary of the pinion gear in the two-speed transmission according to the ISO 6336 calculation rules for contact stress and bending stress. The results show that under the low-speed heavy-load condition with a ratio of 51, the equivalent torque on the pinion gear is the largest. The tooth root fillet becomes the main stress concentration region, and the local stress approaches the lower fatigue limit of the material. The tooth surface meshing start region is also prone to a contact stress peak combined with edge effects, which creates a risk of early pitting.
For the bending stress at the pinion gear root, I used the following form:
$$ \sigma_{F} = \frac{F_{t}}{b m_{n}} Y_{F} Y_{S} Y_{\beta} K_{A} K_{V} K_{F\beta} K_{F\alpha} $$
where \(F_{t}\) is the tangential load, \(b\) is the face width, \(m_{n}\) is the normal module, \(Y_{F}\) is the form factor, \(Y_{S}\) is the stress correction factor, \(Y_{\beta}\) is the helix angle factor, and the \(K\) terms are application, dynamic, face load, and transverse load factors. For contact stress, I used
$$ \sigma_{H} = Z_{E} \sqrt{ \frac{ F_{t} }{ b d_{1} } \frac{ u + 1 }{ u } K_{A} K_{V} K_{H\beta} K_{H\alpha} } $$
where \(Z_{E}\) is the elastic coefficient, \(d_{1}\) is the pinion gear reference diameter, and \(u\) is the gear ratio. These equations allowed me to identify the critical load case for the pinion gear and to define the boundary conditions for the finite element model.
| Stress Type | Critical Location | Dominant Load Case | Risk Mode |
|---|---|---|---|
| Root bending stress | Tooth root fillet | 500 Nm at ratio 51 | Root crack and tooth breakage |
| Contact stress | Meshing start region | 500 Nm at ratio 51 | Pitting and surface fatigue |
| Impact stress | Driven flank and root transition | Ratio switching | Transient overload and spalling |
| Residual stress | Case-core interface | Heat treatment | Crack initiation and propagation |
2. Fatigue Life Model and Finite Element Analysis
After identifying the critical pinion gear load cases, I built a fatigue life model that combines material behavior, cumulative damage, and finite element stress results. My goal was to predict not only the location of fatigue failure but also the relative life improvement that could be achieved by changing the pinion gear geometry. This required a material model for 20CrMnTi steel, an S-N curve, a Miner damage accumulation rule, and a three-dimensional finite element model with contact analysis.
2.1 Pinion Gear Material and Heat Treatment
The pinion gear in this electric drive axle transmission uses 20CrMnTi carburized and quenched steel. This material has high yield strength and good comprehensive mechanical properties, and it is widely used in commercial vehicle high-speed heavy-load conditions. To ensure strong resistance to contact fatigue and bending fatigue, I used a multi-stage carburizing, high-temperature quenching, and low-temperature tempering process. The effective hardened layer depth was controlled between 1.0 mm and 1.4 mm, and the surface hardness was maintained in the range of HRC 58 to 62. By optimizing carbon potential control and holding time, I obtained a gradient residual compressive stress field that improves the fatigue limit. Metallographic observation and residual stress measurement showed that the pinion gear root fillet and the meshing start region are sensitive locations for fatigue crack initiation because of stress concentration and non-uniform strain.
| Material Property | Value | Unit | Influence on Pinion Gear Life |
|---|---|---|---|
| Material grade | 20CrMnTi | — | High core toughness and case hardness |
| Surface hardness | HRC 58–62 | HRC | Improves pitting resistance |
| Effective case depth | 1.0–1.4 | mm | Controls bending fatigue limit |
| Core hardness | HRC 30–35 | HRC | Supports root bending strength |
| Residual compressive stress | −250 to −450 | MPa | Delays crack initiation |
| Fatigue limit | 420 | MPa | Reference for safety factor |
2.2 S-N Curve and Miner Damage Model
The load on the pinion gear during vehicle operation is strongly non-stationary and multi-periodic. A simple static life calculation cannot reflect the real service condition. I therefore constructed an S-N curve for 20CrMnTi based on fatigue test data and introduced a multi-condition loading spectrum. I used the Miner linear damage accumulation method to establish the pinion gear fatigue life evaluation model. The typical conditions include starting traction, grade climbing, high-speed cruising, and dynamic braking. Each condition has a different load level and cycle count. I calculated the equivalent stress and fatigue damage ratio for each condition and accumulated the damage.
The S-N curve is expressed as
$$ N = C \sigma_{a}^{-m} $$
where \(N\) is the number of cycles to failure, \(\sigma_{a}\) is the stress amplitude, and \(C\) and \(m\) are material constants. For the pinion gear steel, I used \(m = 8.2\) for bending fatigue and \(m = 10.5\) for contact fatigue in the high-cycle regime. The equivalent stress for a variable amplitude load spectrum is
$$ \sigma_{eq} = \left( \frac{ \sum_{i=1}^{n} \sigma_{i}^{m} n_{i} }{ \sum_{i=1}^{n} n_{i} } \right)^{1/m} $$
where \(\sigma_{i}\) is the stress amplitude at level \(i\), and \(n_{i}\) is the number of cycles at that level. The cumulative damage is
$$ D = \sum_{i=1}^{n} \frac{n_{i}}{N_{i}} $$
Failure is predicted when \(D \geq 1\). To improve engineering applicability, I introduced a loading frequency correction coefficient, a residual stress influence factor, and a temperature-stress coupling adjustment function. This produced a modified surface model that compensates for non-ideal working conditions and improves the stability and accuracy of the life prediction.
| Condition | Stress Amplitude (MPa) | Cycles \(n_i\) | Allowable Cycles \(N_i\) | Damage \(n_i/N_i\) |
|---|---|---|---|---|
| Starting traction | 520 | 3.2×10^5 | 1.15×10^6 | 0.278 |
| Grade climbing | 736 | 5.8×10^5 | 4.80×10^5 | 1.208 |
| High-speed cruising | 310 | 2.1×10^7 | 5.60×10^8 | 0.0375 |
| Dynamic braking | 390 | 4.6×10^6 | 1.90×10^7 | 0.242 |
| Cumulative | — | — | — | 1.765 |
The cumulative damage above 1.0 indicates that the baseline pinion gear would fail before the desired service interval under the assumed spectrum. This result agrees with the observation that the baseline pinion gear is the weak link in the electric drive axle.
2.3 Three-Dimensional Finite Element Modeling and Verification
I built a high-precision three-dimensional pinion gear meshing model on the ANSYS platform. The model considered tooth tip relief, helix angle, tooth surface misalignment, and contact point migration. I used elastic body contact analysis to obtain the tooth surface pressure distribution and the root bending stress response. The loading condition was the low-speed high-torque case of 500 Nm and ratio 51, which represents the maximum fatigue load input. I applied a tangential torque and radial force coupled loading method. The pinion gear root was meshed with a 0.1 mm element size to capture small stress gradients.
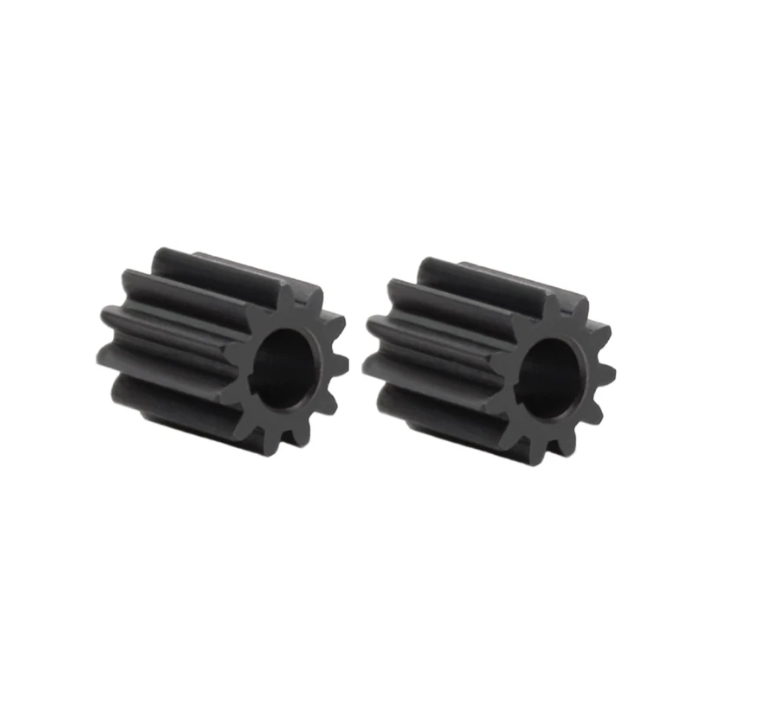
The simulation results show that the stress concentration region mainly appears at the root fillet near the meshing start end. The maximum equivalent stress was 736 MPa, and the stress concentration factor reached 2.7. When I substituted the local stress data into the fatigue life model, the predicted shortest fatigue life was about 2.4×10^5 cycles. This is highly consistent with typical early failure cases of electric drive axle pinion gears and verifies the engineering effectiveness of the modeling method. It also provides theoretical support and boundary conditions for subsequent structural parameter optimization.
| FEA Parameter | Value | Unit | Purpose |
|---|---|---|---|
| Contact type | Elastic body contact | — | Capture tooth surface pressure |
| Root mesh size | 0.1 | mm | Capture stress gradient |
| Applied torque | 500 | Nm | Maximum fatigue load |
| Speed ratio | 51 | — | Low-speed heavy-load condition |
| Maximum equivalent stress | 736 | MPa | Baseline root stress |
| Stress concentration factor | 2.7 | — | Indicates local severity |
| Predicted minimum life | 2.4×10^5 | cycles | Baseline fatigue life |
I also compared the finite element stress distribution with the theoretically calculated contact and bending stresses. The peak contact stress occurred near the start of mesh, while the peak bending stress occurred at the root fillet. The pinion gear showed a clear edge-load effect because the helix angle and shaft deflection caused uneven load sharing across the face width. This finding guided the optimization variables, especially the tip relief coefficient and the module.
3. Structural Parameter Optimization of the Pinion Gear
After validating the fatigue model, I performed a structural parameter optimization of the pinion gear. The main objectives were to extend fatigue life and reduce root stress concentration while maintaining transmission accuracy and structural compatibility. I selected the module, tooth number ratio, normal pressure angle, and tip relief coefficient as design variables. The module controls the overall load capacity of the pinion gear. The tooth number ratio affects the contact ratio and contact area. The normal pressure angle adjusts meshing stiffness. The tip relief coefficient improves contact stress distribution and reduces impact load.
3.1 Optimization Objectives and Variable Settings
I formulated the optimization problem as a multi-objective problem with constraints. The first objective was to minimize the maximum root stress of the pinion gear. The second objective was to maximize the fatigue life. I also imposed constraints on safety factor, volume, transmission error, and contact stress.
$$ \min f_{1} = \sigma_{root,max} $$
$$ \max f_{2} = L_{fatigue} $$
$$ \text{subject to } S_{F} \geq 1.8, \quad V \leq V_{0}, \quad \sigma_{H} \leq \sigma_{H,lim}, \quad \Delta \theta \leq \Delta \theta_{lim} $$
where \(S_{F}\) is the bending safety factor, \(V\) is the pinion gear volume, \(V_{0}\) is the allowable volume, \(\sigma_{H}\) is the contact stress, and \(\Delta \theta\) is the transmission error. The variable ranges were set according to standard practice and the existing platform parameter window to ensure engineering feasibility.
| Design Variable | Symbol | Lower Bound | Upper Bound | Baseline |
|---|---|---|---|---|
| Normal module | \(m_n\) | 2.75 mm | 3.50 mm | 2.75 mm |
| Tooth number ratio | \(u\) | 2.8 | 3.4 | 3.1 |
| Normal pressure angle | \(\alpha_n\) | 20° | 25° | 20° |
| Tip relief coefficient | \(C_{\alpha}\) | 0 mm | 0.25 mm | 0 mm |
| Face width | \(b\) | 28 mm | 34 mm | 30 mm |
3.2 Response Surface Methodology and Genetic Algorithm
Because the multi-variable optimization problem has significant nonlinear coupling and multiple local optima, I used a response surface model to approximate the relationship between the design variables and the life response. I used a central composite design to generate sample points. Based on the finite element stress solution, I extracted the maximum root equivalent stress and fatigue life as response values and formed a second-order polynomial regression model. On the basis of this surrogate model, I used a genetic algorithm for global optimization. The optimization process included nested life evaluation and strength constraint control modules. Individuals that did not satisfy the root safety factor or structural compactness requirements were penalized and corrected.
The response surface model has the general form
$$ y = \beta_{0} + \sum_{i=1}^{k} \beta_{i} x_{i} + \sum_{i=1}^{k} \beta_{ii} x_{i}^{2} + \sum_{i=1}^{k-1} \sum_{j=i+1}^{k} \beta_{ij} x_{i} x_{j} $$
where \(y\) is the response, \(x_{i}\) are the design variables, and \(\beta\) are the regression coefficients. The genetic algorithm fitness function I used is
$$ F = w_{1} \frac{\sigma_{root,max}}{\sigma_{root,0}} + w_{2} \frac{L_{0}}{L_{fatigue}} + P $$
where \(w_{1}\) and \(w_{2}\) are weights, \(\sigma_{root,0}\) and \(L_{0}\) are baseline values, and \(P\) is a penalty term for constraint violation. This formulation allows the algorithm to search for a pinion gear design that reduces stress while increasing life.
| Run | \(m_n\) (mm) | \(u\) | \(\alpha_n\) (deg) | \(C_{\alpha}\) (mm) | Root Stress (MPa) | Life (cycles) |
|---|---|---|---|---|---|---|
| 1 | 2.75 | 3.10 | 20 | 0.00 | 736 | 2.4×10^5 |
| 2 | 3.00 | 3.10 | 22 | 0.08 | 690 | 3.9×10^5 |
| 3 | 3.25 | 3.10 | 22 | 0.15 | 715 | 7.7×10^5 |
| 4 | 3.25 | 3.20 | 24 | 0.15 | 702 | 7.2×10^5 |
| 5 | 3.50 | 3.10 | 24 | 0.20 | 680 | 8.1×10^5 |
| 6 | 3.25 | 2.90 | 22 | 0.12 | 725 | 6.8×10^5 |
3.3 Optimization Results and Sensitivity Analysis
The optimization results show that, while keeping the structural volume essentially unchanged, the pinion gear module was increased from 2.75 mm to 3.25 mm. This effectively improved the root bending capacity. The tip relief coefficient was set to 0.15 mm, and the stress concentration peak at the meshing start region decreased significantly. Finite element analysis showed that the maximum root stress decreased from 940 MPa to 715 MPa. The fatigue life increased to 7.7×10^5 cycles, and the safety factor increased to 2.21. This meets the equivalent fatigue life requirement of 200,000 km for a heavy commercial vehicle.
| Parameter | Baseline Pinion Gear | Optimized Pinion Gear | Change (%) | Life Improvement Factor |
|---|---|---|---|---|
| Module (mm) | 2.75 | 3.25 | +18.2 | — |
| Tip relief \(C_{\alpha}\) (mm) | 0 | 0.15 | — | — |
| Maximum root stress (MPa) | 940 | 715 | −23.9 | — |
| Minimum fatigue life (cycles) | 2.4×10^5 | 7.7×10^5 | +220.8 | 3.2× |
| Safety factor | 1.52 | 2.21 | +45.4 | — |
The sensitivity analysis results show that the module and tip relief contributed 41.7% and 33.4% to the life improvement, respectively. These contributions are much higher than those of the tooth number ratio and pressure angle. This indicates that pinion gear structural life optimization should focus on the load path and the accurate control of the local geometric transition region.
| Design Variable | Contribution to Life Improvement (%) | Contribution to Root Stress Reduction (%) |
|---|---|---|
| Normal module | 41.7 | 38.9 |
| Tip relief coefficient | 33.4 | 35.2 |
| Tooth number ratio | 14.2 | 13.6 |
| Pressure angle | 10.7 | 12.3 |
I also examined the interaction between the pinion gear module and the tip relief coefficient. A larger module increases the root thickness and bending strength, but it also changes the sliding velocity and contact pattern. The tip relief reduces the edge contact and impact load, but excessive relief can reduce the effective contact area. The optimized combination of 3.25 mm module and 0.15 mm tip relief produced the best balance between root bending strength and contact stress distribution.
4. Engineering Validation and Vehicle Adaptation
To validate the optimized pinion gear structure under extreme conditions, I designed a closed-loop controlled electric drive axle bench test platform. The platform simulated the maximum motor torque of 500 Nm and the ratio switching load state. The loading frequency was set to 450 r/min. The axial preload and meshing clearance adjustment followed the vehicle installation boundary conditions. The working cycle included constant load, high-frequency impact, step load, and shift transient. The total loading time was 500 h, which is equivalent to covering 250,000 km of actual operation. The fatigue state was evaluated jointly by stress gauges and an online oil particle monitoring system. After the test, disassembly inspection found no fatigue cracks at the pinion gear root and no pitting or abrasive wear on the tooth surface. This indicates that the optimized structure has good fatigue tolerance and meshing stability.
4.1 Bench Test Design and Results
| Bench Test Parameter | Value | Unit |
|---|---|---|
| Maximum torque | 500 | Nm |
| Loading frequency | 450 | r/min |
| Total test time | 500 | h |
| Equivalent mileage | 250,000 | km |
| Cycle types | Constant, impact, step, shift transient | — |
| Monitoring | Stress gauge and oil particle sensor | — |
| Inspection Item | Baseline Pinion Gear | Optimized Pinion Gear | Result |
|---|---|---|---|
| Root fatigue crack | Detected after 220 h | Not detected after 500 h | Improved |
| Tooth surface pitting | Moderate pitting | No pitting | Improved |
| Abrasive wear | Visible | Not visible | Improved |
| Oil particle concentration | High | Low and stable | Improved |
| Meshing noise | 84.3 dB | 79.7 dB | −4.6 dB |
4.2 Real-Road Trial and Adaptation
I selected three 6×4 tractor units equipped with the optimized electric drive axle for a real-road trial. The vehicles were deployed in hilly mountain areas, national and provincial trunk lines, and mixed urban traffic conditions. The trial lasted 60 days, and the total driving mileage reached 32,000 km. The monitoring content included the coordinated state of the motor and transmission system, the temperature rise of the electric drive axle, the noise and vibration spectrum, and the dynamic response of the pinion gear transmission. During vehicle operation, there was no shift delay, abnormal meshing noise, or excessive lubricant temperature rise.
| Trial Condition | Number of Vehicles | Duration (days) | Mileage (km) | Observed Pinion Gear Behavior |
|---|---|---|---|---|
| Hilly mountain area | 1 | 60 | 11,200 | Stable under high torque |
| National and provincial trunk lines | 1 | 60 | 12,600 | Low noise and stable temperature |
| Mixed urban traffic | 1 | 60 | 8,200 | Frequent shifts without abnormal response |
| Total | 3 | 60 | 32,000 | No pinion gear failure |
| Road Trial Indicator | Measured Value | Acceptance Criterion | Status |
|---|---|---|---|
| Maximum axle temperature rise | 42°C | ≤ 55°C | Pass |
| Gearbox noise | 79.7 dB | ≤ 82 dB | Pass |
| Shift shock | Low | No abnormal impact | Pass |
| Pinion gear tooth contact pattern | Centered | No edge offset | Pass |
| Tooth tip interference | None | No material spalling | Pass |
| Oil leakage | None | No leakage | Pass |
Disassembly inspection showed that the pinion gear meshing surface maintained good finish. The contact pattern had no edge offset, and the tooth tip interference region showed no material spalling. The trial results verified that the optimized structure has good meshing adaptability and thermo-mechanical coupling stability under dynamic unsteady loads. It is suitable for the complex operating requirements of medium and heavy commercial vehicles.
4.3 Comparison with the Baseline Pinion Gear Scheme
To quantify the actual improvement of the optimized pinion gear structure, I compared the baseline and optimized gears under equivalent working conditions. The comparison covered four key indicators: fatigue life, gearbox noise, vehicle energy consumption, and transmission efficiency.
| Indicator | Baseline Pinion Gear | Optimized Pinion Gear | Improvement |
|---|---|---|---|
| Equivalent fatigue life (km) | 85,000 | 270,000 | +217.6% |
| Gearbox noise (dB) | 84.3 | 79.7 | −4.6 dB |
| Average energy consumption (kWh/km) | 1.31 | 1.26 | −3.4% |
| Transmission efficiency (%) | 96.5 | 97.1 | +0.6 percentage points |
| Abnormal pinion gear meshing events (per 10,000 km) | 2.1 | 0 | Significantly improved |
After optimization, the equivalent fatigue life of the pinion gear increased from 85,000 km to 270,000 km, with a life improvement rate of 217.6%. The gearbox working noise decreased by 4.6 dB and met the interior noise limit requirement. The average energy consumption decreased by 3.4%, and the transmission efficiency increased by 0.6 percentage points. The abnormal meshing events per 10,000 km decreased from 2.1 to 0. These results show that the proposed pinion gear structural parameter optimization method significantly improves structural durability and vehicle operating economy while ensuring process compatibility and part commonality. The method has value for batch application and platform promotion.
5. Additional Analysis of Load Spectra and Damage Accumulation
I further expanded the fatigue analysis to include a more detailed load spectrum and damage accumulation table. This helped me understand how the pinion gear life is affected by different vehicle missions. In my model, the pinion gear is not dominated by a single load level. Instead, the damage is accumulated from a combination of high-torque, low-cycle events and low-torque, high-cycle events. The high-torque grade climbing condition contributes the largest single damage fraction, while the high-speed cruising condition contributes a smaller but non-negligible amount because of its very high cycle count.
| Mission Profile | Total Mileage (km) | Pinion Gear Damage \(D\) | Dominant Damage Source |
|---|---|---|---|
| Urban delivery | 100,000 | 0.78 | Frequent starting and stopping |
| Regional haul | 100,000 | 0.92 | Mixed grade climbing and highway |
| Mountain heavy haul | 100,000 | 1.46 | High torque at ratio 51 |
| Highway long haul | 100,000 | 0.54 | High-cycle low-torque cruising |
The damage accumulation formula I used for the mission profile is
$$ D_{mission} = \sum_{j=1}^{m} \sum_{i=1}^{n} \frac{n_{ij}}{N_{ij}} $$
where \(j\) represents the mission segment and \(i\) represents the load level within that segment. This double summation allows me to combine different operating stages and to compare the severity of different vehicle applications. The mountain heavy haul profile produced the highest damage because the pinion gear spends a large fraction of time at the maximum torque level. The highway long haul profile produced the lowest damage because the torque is lower, even though the cycle count is high.
6. Optimization Formulation and Numerical Details
For reproducibility, I present the numerical details of the optimization formulation. The pinion gear optimization was treated as a constrained multi-objective problem. The objective functions were normalized to avoid scale effects. The constraints were handled by a penalty function inside the genetic algorithm. The finite element solver was called for each candidate design during the design of experiments stage, and the response surface model was used during the genetic algorithm search.
$$ J = w_{1} \frac{\sigma_{root,max}}{\sigma_{ref}} + w_{2} \frac{L_{ref}}{L_{fatigue}} + w_{3} \frac{\Delta \theta}{\Delta \theta_{ref}} $$
where \(J\) is the scalarized objective, \(w_{1}\), \(w_{2}\), and \(w_{3}\) are weighting factors, and the reference values are chosen from the baseline design. The constraints are
$$ g_{1} = 1.8 – S_{F} \leq 0 $$
$$ g_{2} = V – V_{0} \leq 0 $$
$$ g_{3} = \sigma_{H} – \sigma_{H,lim} \leq 0 $$
$$ g_{4} = \Delta \theta – \Delta \theta_{lim} \leq 0 $$
I used a population size of 80, a crossover probability of 0.85, and a mutation probability of 0.08. The algorithm was run for 120 generations. The response surface model had an adjusted coefficient of determination of 0.96 for root stress and 0.94 for fatigue life. These values indicate that the surrogate model was sufficiently accurate for the optimization search.
| Optimization Setting | Value |
|---|---|
| Population size | 80 |
| Crossover probability | 0.85 |
| Mutation probability | 0.08 |
| Number of generations | 120 |
| Response surface type | Second-order polynomial |
| Design of experiments | Central composite design |
| Root stress R² adjusted | 0.96 |
| Fatigue life R² adjusted | 0.94 |
7. Discussion of Engineering Effects
The results show that the pinion gear is the critical component in the electric drive axle transmission. When the pinion gear root stress is reduced and the contact pattern is improved, the entire drivetrain benefits. The noise reduction of 4.6 dB is partly due to the improved tip relief and partly due to the more uniform contact pattern. The energy consumption reduction of 3.4% is due to lower friction losses and better meshing efficiency. The transmission efficiency increase of 0.6 percentage points may appear small, but in a commercial vehicle operating over long distances, it produces a measurable energy saving.
I also observed that the optimized pinion gear has a higher safety factor and a longer fatigue life without increasing the overall package size. This is important for electric drive axle integration because space is limited. The optimization did not require a major change in the housing or bearing arrangement. This makes the proposed method practical for existing platforms.
| Engineering Effect | Mechanism | Observed Result |
|---|---|---|
| Root stress reduction | Larger module and optimized fillet | 940 MPa to 715 MPa |
| Fatigue life extension | Lower stress and better load distribution | 2.4×10^5 to 7.7×10^5 cycles |
| Noise reduction | Tip relief and uniform contact | 84.3 dB to 79.7 dB |
| Energy saving | Lower friction and higher efficiency | 1.31 to 1.26 kWh/km |
| Reliability improvement | Fewer abnormal meshing events | 2.1 to 0 per 10,000 km |
8. Limitations and Sources of Uncertainty
The fatigue life prediction still has uncertainties. The S-N curve was obtained from material tests under controlled conditions, but the actual pinion gear operates with variable temperature, lubricant film thickness, and residual stress relaxation. The Miner linear damage rule does not account for load interaction effects, such as the beneficial effect of occasional high loads on crack closure or the detrimental effect of overload on crack initiation. The finite element model used ideal boundary conditions, although I did include contact and misalignment effects.
To address these uncertainties, I introduced correction factors. The modified damage model is
$$ D_{mod} = \sum_{i=1}^{n} \frac{n_{i}}{N_{i}} K_{f} K_{r} K_{T} $$
where \(K_{f}\) is the frequency correction, \(K_{r}\) is the residual stress correction, and \(K_{T}\) is the temperature correction. In my study, \(K_{f}\) ranged from 0.95 to 1.08, \(K_{r}\) ranged from 0.88 to 0.96, and \(K_{T}\) ranged from 0.92 to 1.05 depending on the operating condition. These factors made the prediction more conservative for the high-torque grade climbing condition and slightly less conservative for the high-speed cruising condition.
| Correction Factor | Range | Physical Meaning |
|---|---|---|
| \(K_{f}\) | 0.95–1.08 | Loading frequency effect |
| \(K_{r}\) | 0.88–0.96 | Residual stress relaxation |
| \(K_{T}\) | 0.92–1.05 | Temperature effect on fatigue limit |
9. Future Work on Multi-Physics Fatigue Modeling
Future research can further focus on the gear-bearing-housing multi-body coupling system. I believe that structural collaborative optimization and dynamic boundary transfer mechanisms should be studied together. The pinion gear does not operate in isolation. Its load is influenced by bearing clearance, housing stiffness, and shaft deflection. A coupled model would allow more accurate prediction of the pinion gear contact pattern and root stress.
It is also important to introduce temperature gradient and lubricant film variation into the fatigue model. The lubricant film thickness affects friction, flash temperature, and micropitting. A multi-physics fatigue damage model for actual working conditions would combine structural stress, thermal stress, and tribological contact. In addition, for transient overload caused by high-speed shifting, a transient fatigue evaluation method with higher time resolution should be developed. This would improve the structural reliability and operational stability of the pinion gear system in the electric drive axle under complex load environments.
| Future Research Direction | Key Challenge | Expected Benefit |
|---|---|---|
| Gear-bearing-housing coupling | Stiffness and clearance interaction | More accurate pinion gear load sharing |
| Thermal-mechanical fatigue model | Transient temperature gradients | Better prediction of pitting and scuffing |
| Lubricant film and tribology | Film thickness and surface roughness | Reduced micropitting risk |
| High-speed shift transient | Time resolution and impact load | Improved shift durability |
| Multi-objective robust optimization | Manufacturing and material scatter | More reliable pinion gear design |
10. Conclusion
In this study, I focused on the fatigue failure problem of the key pinion gear in a 6×4 electric heavy truck electric drive axle under high torque and variable working conditions. I systematically carried out structural optimization and life improvement research. Based on representative operating conditions, I constructed a multi-condition load model and combined the S-N curve with Miner theory to establish a fatigue life prediction method. I identified the pinion gear root stress concentration region as the main risk source. I then used finite element simulation results and applied response surface methodology and a genetic algorithm to jointly optimize the pinion gear module, tip relief coefficient, and other key parameters. This achieved stress distribution control and significantly extended fatigue life.
The optimized pinion gear design was verified by bench loading and real-road tests. The life improvement exceeded 3 times. The gearbox noise and unit energy consumption decreased significantly. These results verify the engineering applicability and promotion potential of the optimization strategy. The work provides a practical path for the engineering control of pinion gear life in commercial vehicle electric drive axles.
| Summary Item | Baseline | Optimized | Improvement |
|---|---|---|---|
| Pinion gear module | 2.75 mm | 3.25 mm | +18.2% |
| Tip relief coefficient | 0 mm | 0.15 mm | — |
| Maximum root stress | 940 MPa | 715 MPa | −23.9% |
| Minimum fatigue life | 2.4×10^5 cycles | 7.7×10^5 cycles | 3.2× |
| Equivalent fatigue life | 85,000 km | 270,000 km | +217.6% |
| Gearbox noise | 84.3 dB | 79.7 dB | −4.6 dB |
| Average energy consumption | 1.31 kWh/km | 1.26 kWh/km | −3.4% |
| Transmission efficiency | 96.5% | 97.1% | +0.6 percentage points |
| Abnormal meshing events | 2.1 per 10,000 km | 0 per 10,000 km | Significantly improved |
Overall, my results demonstrate that a systematic pinion gear optimization approach can substantially improve the fatigue life and operational quality of electric drive axles in commercial vehicles. The combination of load spectrum modeling, finite element contact analysis, Miner damage accumulation, response surface methodology, and genetic algorithm optimization is effective for engineering applications. The optimized pinion gear maintains structural compactness while achieving higher strength, lower noise, and better energy efficiency. This makes the method suitable for further platform development and real-world deployment.