
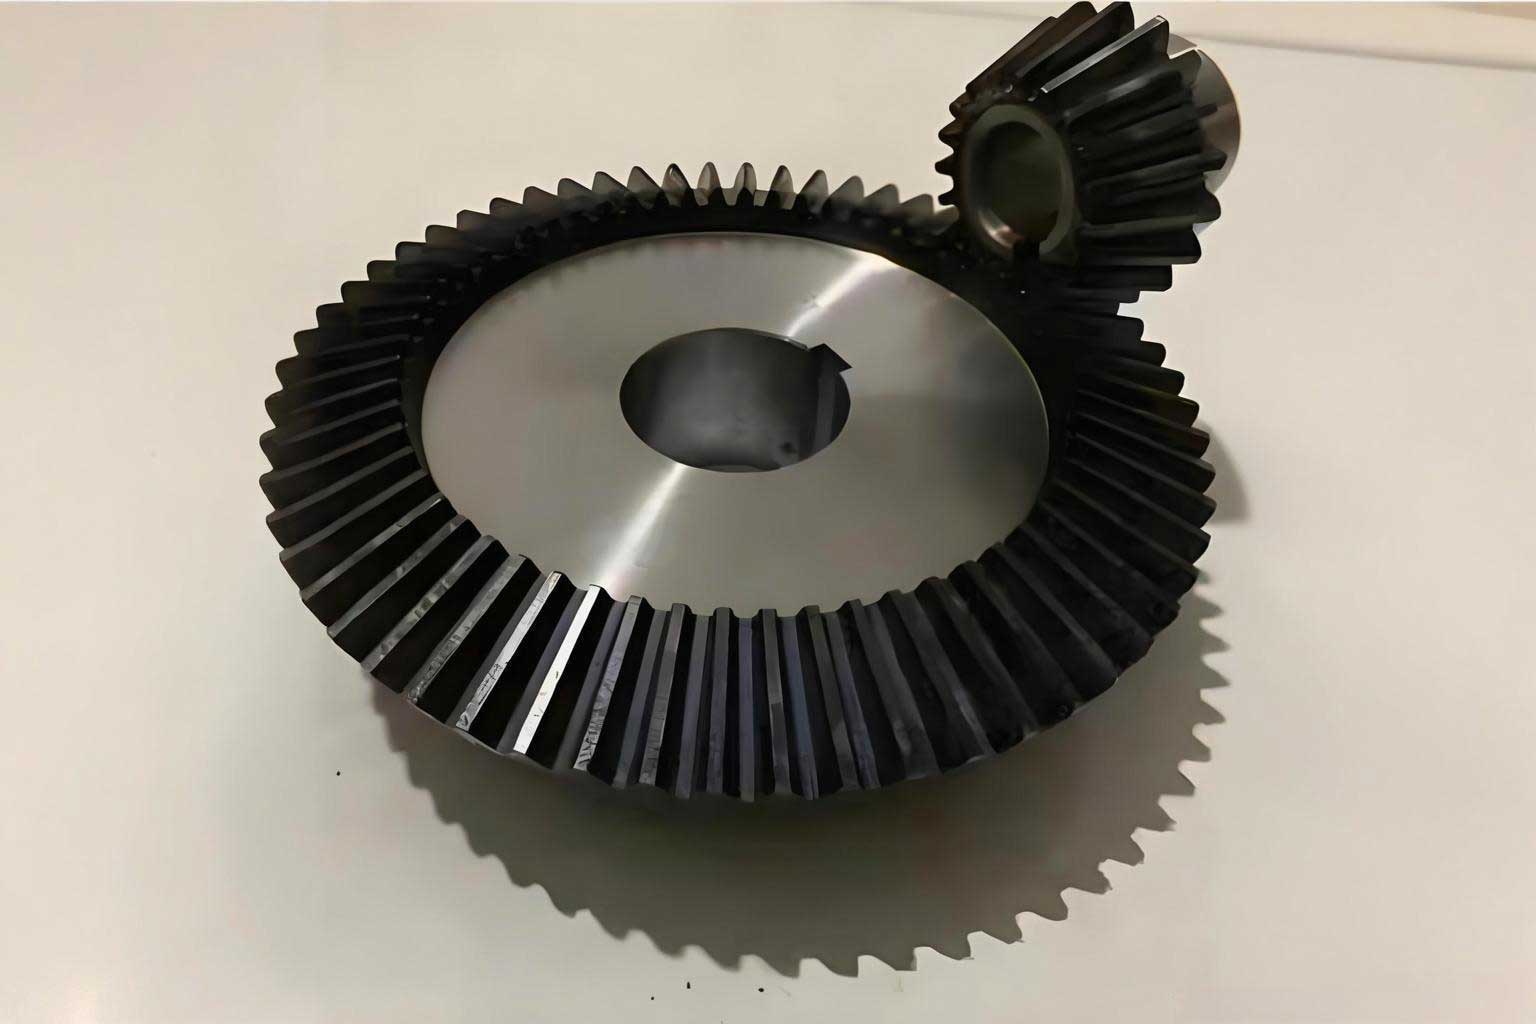
In modern high-speed and heavy-load mechanical equipment, the miter gear transmission system, especially the herringbone gear pair, serves as a core subsystem. The scuffing phenomenon caused by continuously rising tooth surface temperature during contact is one of the main failure modes. This failure often occurs instantaneously and unpredictably, restricting service life and reliability. The contact characteristics of miter gear tooth surfaces determine the anti-scuffing load capacity. However, current research on the scuffing load capacity of miter gear transmission systems is insufficient. Most existing studies ignore the influence of tooth surface contact characteristics on scuffing load capacity. Therefore, I conducted a more accurate and in-depth analysis of the anti-scuffing load capacity of miter gear transmission systems, focusing on a single-stage herringbone gear pair. The following sections describe my modeling, numerical analysis, and findings.
Mixed thermal elastohydrodynamic lubrication model for miter gear. The miter gear transmission system can be regarded as a pair of helical gears with opposite rotation directions. Helical gear transmission is a typical line contact. I first established a mixed thermal elastohydrodynamic lubrication (TEHL) model to analyze the lubrication state. The one-dimensional isothermal Reynolds equation is written as:
$$ \frac{d}{dx}\left( \frac{\rho h^3}{\eta} \frac{dp}{dx} \right) = 12 u_s \frac{d(\rho h)}{dx} $$
where \(h\) is the oil film thickness, \(\eta\) and \(\rho\) are the lubricant viscosity and density, \(u_s\) is the rolling speed, and \(p\) is the pressure. To include surface roughness, I used an improved Reynolds equation with pressure flow factors:
$$ \frac{\partial}{\partial x}\left( \phi_x \frac{\rho h_T^3}{\eta} \frac{\partial p}{\partial x} \right) = 12 \frac{\partial (\rho u h_T)}{\partial x} $$
where \(\phi_x\) is the pressure flow factor and \(h_T\) is the average gap between contact surfaces. The film thickness equation considering Hertzian geometry and elastic deformation is:
$$ h(x) = h_0 + \frac{x^2}{2R_{eq}} – \frac{2}{\pi E_{eq}} \int_{x_{in}}^{x_{end}} p(s) \ln (x-s)^2 ds $$
The lubricant density–pressure–temperature relationship follows:
$$ \rho = \rho_0 \left[ 1 + \frac{0.6 \times 10^{-9} p}{1 + 1.7 \times 10^{-9} p} – 0.0007 (T – T_0) \right] $$
The viscosity–pressure–temperature relationship is:
$$ \eta = \eta_0 \exp \left\{ \ln \eta_0 + 9.67 \left[ \left( 1 + 5.1 \times 10^{-9} p \right)^Z \left( \frac{T – 138}{T_0 – 138} \right)^{-S} – 1 \right] \right\} $$
where \(Z\) and \(S\) are the viscosity–pressure and viscosity–temperature indices. The energy equation for the lubricant film is:
$$ \rho c_p \left( u \frac{\partial T}{\partial x} + v \frac{\partial T}{\partial z} \right) = K \frac{\partial^2 T}{\partial z^2} + \eta \left( \frac{\partial v}{\partial z} \right)^2 $$
I solved these equations using dimensionless parameters. The dimensionless Reynolds equation becomes:
$$ \frac{dP}{dX} = \frac{U H_T – \rho H_T}{H_T^3 \phi_x} \left( 1 – 0.9 e^{-0.56 H_T / \sigma} \right)^{-1} $$
The dimensionless film thickness is:
$$ H(X) = H_0 + \frac{X^2}{2} – \frac{1}{\pi} \int_{X_{in}}^{X_{end}} P(S) \ln (X-S)^2 dS $$
For line-contact mixed EHL, I adopted the formulas for central film thickness, minimum film thickness, and asperity load ratio:
$$ H_c = 2.691 W^{-0.135} U^{0.705} G^{0.556} \left( 1 + 0.2 \sigma^{1.222} V^{0.223} \right) \left( 1 + 0.229 W^{0.748} U^{-0.842} G^{-0.229} \right) $$
$$ H_{min} = 1.652 W^{-0.077} U^{0.716} G^{0.695} \left( 1 + 0.026 \sigma^{1.12} V^{0.185} \right) \left( 1 + 0.312 W^{0.809} U^{-0.977} G^{-0.185} \right) $$
$$ L_a = 0.005 \ln \left( 1 + 4470 W^{0.408} U^{-0.088} G^{0.103} V^{6.015} \right) \left( 1 + 1.168 W^{0.485} U^{-3.741} G^{-2.898} \right) $$
The film thickness ratio is \(\Lambda = H_{min} / \sigma\). Based on load sharing theory, the total pressure is the sum of hydrodynamic pressure and asperity contact pressure:
$$ p = p_h + p_a, \quad p_a = L_a p, \quad p_h = (1 – L_a) p $$
I also introduced the oil film defect fraction \(\psi\) to reflect the influence of sliding speed and contact temperature:
$$ \psi = 1 – \exp \left( – \frac{X}{u_s t_0} \exp \left( – \frac{E_a}{R_g T_{flash}} \right) \right) $$
I used the geometric and operating parameters of a single-stage herringbone gear pair, as summarized in Table 1. The material properties are given in Table 2, and the lubricant properties for SAE 30 are listed in Table 3.
| Parameter | Unit | Driving gear | Driven gear |
|---|---|---|---|
| Number of teeth | – | 17 | 26 |
| Normal module | mm | 4.5 | 4.5 |
| Normal pressure angle | ° | 20 | 20 |
| Face width | mm | 45 | 45 |
| Helix angle | ° | 15 | 15 |
| Input speed | rpm | 150 | – |
| Input torque | N·m | 200 | – |
| Property | Unit | Driving gear | Driven gear |
|---|---|---|---|
| Density | kg/m³ | 7800 | 7800 |
| Specific heat | J/kg·K | 465 | 465 |
| Thermal conductivity | W/m·K | 50 | 50 |
| Hardness | HRC | 50 | 50 |
| Elastic modulus | GPa | 206 | 206 |
| Poisson’s ratio | – | 0.3 | 0.3 |
| Surface roughness | μm | 0.5 | 0.5 |
| Friction coefficient | – | 0.135 | 0.135 |
| Parameter | Symbol | Value |
|---|---|---|
| Viscosity at reference temperature | \(\eta_0\) | 0.35 Pa·s |
| Pressure–viscosity coefficient | \(\alpha\) | 2.5×10⁻⁸ m²/N |
| Pressure–viscosity index | \(Z\) | 0.5687 |
| Temperature–viscosity coefficient | \(\beta_T\) | 0.045 K⁻¹ |
| Temperature–viscosity index | \(S\) | 0.8099 |
| Limiting shear stress coefficient | \(\Lambda_{lim}\) | 0.091 |
| Density | \(\rho\) | 888 kg/m³ |
I computed the dimensionless load and rolling speed along the line of action. The load is higher at the approach and recess points, while the rolling speed is minimum at the pitch point. The asperity contact ratio increases with surface roughness. For \(\sigma = 0.5 \mu m\), the film thickness ratio is between 0.5 and 1, indicating mixed lubrication. The central film thickness decreases with increasing torque because higher load compresses the oil film. The minimum film thickness follows a similar trend. The oil film defect fraction \(\psi\) is maximum at the pitch point and decreases with increasing rotational speed.
Tooth surface contact temperature. The contact temperature \(T_c\) consists of bulk temperature \(T_{bulk}\) and flash temperature \(T_{flash}\):
$$ T_c = T_{bulk} + T_{flash} $$
According to the ISO standard, the flash temperature for line contact is:
$$ T_{flash} = \frac{2.52 X_M X_J X_\Gamma w_{Bt}^{0.75} n_1^{0.25}}{X_{M} \left( R_{y1} R_{y2} \right)^{0.25}} \mu_m $$
where \(X_M\) is the thermal elastic coefficient, \(X_J\) is the approach coefficient, \(X_\Gamma\) is the load sharing coefficient, \(w_{Bt}\) is the unit load, and \(R_{y1}, R_{y2}\) are local radii of curvature. The bulk temperature is estimated as:
$$ T_{bulk} = T_{oil} + 0.47 X_S X_{mp} T_{Af} $$
I improved the contact temperature calculation by considering mixed EHL. The flash temperature for a moving square heat source is:
$$ T_f = \frac{2 a_h q_m}{\pi (k_1 \sqrt{1+Pe_1} + k_2 \sqrt{1+Pe_2})} $$
where \(a_h\) is the contact half-width, \(q_m\) is the friction heat flux, and \(Pe\) is the Peclet number:
$$ Pe_1 = \frac{v_p a_h \rho_p c_p}{k_p}, \quad Pe_2 = \frac{v_g a_h \rho_g c_g}{k_g} $$
The heat flux consists of asperity friction heat and lubricant shear heat:
$$ q_m = q_h + q_a, \quad q_h = \tau_{lim} u_s, \quad q_a = \mu_m p_a u_s $$
where \(\tau_{lim} = \Lambda_{lim} p_h\). The average friction coefficient is:
$$ \mu_{avg} = 0.048 \left( \frac{F_{bt}}{b v_{\Sigma C} \rho_{red C}} \right)^{0.2} \eta_{oil}^{-0.05} Ra^{0.25} X_L $$
I calculated the contact temperature distribution along the line of action for a herringbone gear. The ISO method gives higher values because it is conservative. My improved method accounts for asperity friction and lubricant shear heat, yielding more reasonable results. The contact temperature increases with torque and rotational speed. Every 100 N·m increase in torque or 100 rpm increase in speed raises the temperature by about 10 °C. Higher surface roughness increases asperity contact and reduces film thickness ratio, thus raising temperature. Using a high-quality lubricant such as PAO reduces contact temperature compared to SAE 30. Table 4 compares the contact temperature for different lubricants.
| Lubricant | Viscosity (Pa·s) | Pressure–viscosity index \(Z\) | Temperature–viscosity index \(S\) | Max contact temperature (K) |
|---|---|---|---|---|
| SAE 30 | 0.35 | 0.5687 | 0.8099 | 395 |
| PAO | 0.04 | 0.4559 | 0.6494 | 412 |
Tooth surface contact evolution and wear. The miter gear contact can be modeled as two opposite conical rollers. I used the slice method to discretize the helical gear into many thin slices. The contact line length \(l(t)\) varies periodically. For \(\varepsilon_\alpha \leq \varepsilon_\beta\):
$$ l(t) = \begin{cases} \frac{p_{bt} t}{T_m \sin \beta_b} & 0 \leq t \leq \varepsilon_\alpha T_m \\ \frac{\varepsilon_\alpha p_{bt}}{\sin \beta_b} & \varepsilon_\alpha T_m < t \leq \varepsilon_\beta T_m \\ \frac{\varepsilon_\alpha p_{bt}}{\sin \beta_b} \left( 1 – \frac{t – \varepsilon_\beta T_m}{\varepsilon_\alpha T_m} \right) & \varepsilon_\beta T_m < t \leq \varepsilon_\gamma T_m \end{cases} $$
The total contact line length is \(L_{total}(t) = \sum_{i=1}^N L_i(t)\). The Hertzian contact half-width and equivalent curvature radius are:
$$ a_h(i,j) = \sqrt{\frac{2 F(i,j) R(i,j)}{\pi l(t) E_{eq}}}, \quad R(i,j) = \frac{R_p(i,j) R_g(i,j)}{R_p(i,j) + R_g(i,j)} $$
The average and maximum contact pressures are:
$$ p(i,j) = \frac{F(i,j)}{2 l(t) a_h(i,j)}, \quad p_{max}(i,j) = \sqrt{\frac{F(i,j) E_{eq}}{2 \pi l(t) R(i,j)}} $$
The sliding distance for driving and driven gears is:
$$ s_p = 2 a_h \frac{v_{t1} – v_{t2}}{v_{t1}}, \quad s_g = 2 a_h \frac{v_{t1} – v_{t2}}{v_{t2}} $$
I established a wear model based on irreversible thermodynamics and the degradation entropy generation (DEG) theorem. The entropy generation rate is:
$$ \dot{S} = \frac{F_\mu V}{T A_p T_{hc}} $$
The degradation coefficient \(B\) is defined as:
$$ B = \frac{\dot{w}_v T_c}{V F_\mu} $$
The wear depth is then:
$$ h(i,j) = \frac{B \mu_m p(i,j) s(i,j)}{T_c(i,j)} \left( \frac{L_a}{\psi} \right)_{EHL} $$
I determined the degradation coefficient \(B\) for the gear steel through pin-on-disc tests. The test conditions are listed in Table 5, and the results are in Table 6. The average \(B\) is \(2.86 \times 10^{-10} \, \text{m}^3 \text{K/J}\).
| Test | Load (N) | Speed (rpm) | Time (min) | Sliding distance (m) |
|---|---|---|---|---|
| 1 | 70 | 90 | 20 | 79 |
| 2 | 60 | 90 | 20 | 79 |
| 3 | 60 | 80 | 20 | 70 |
| Test | Average friction coefficient | Temperature rise (°C) | \(B\) (×10⁻¹⁰ m³ K/J) |
|---|---|---|---|
| 1 | 0.32 | 4.2 | 2.88 |
| 2 | 0.29 | 3.1 | 2.86 |
| 3 | 0.27 | 2.6 | 2.84 |
The wear depth distribution shows that the driving gear wears more than the driven gear. The wear is minimum at the pitch point because sliding distance is nearly zero. The wear depth along the face width is non-uniform due to the helix angle. I compared my DEG-based model with the classical Archard wear model. The Archard model gives higher wear depth, but the distribution trends are similar. I updated the tooth surface contact parameters after every \(3 \mu m\) of wear depth. Ignoring wear updates leads to underestimation of contact temperature and overestimation of film thickness, especially in later stages.
Anti-scuffing load capacity calculation. I simulated the miter gear scuffing test using an extended standardized load stage program. The input torque and normal load for 16 stages are given in Table 7. The initial oil temperature was 60 °C with jet lubrication, and the driving gear speed was 1455 rpm. Each stage lasted 15 minutes.
| Stage | Driving torque (N·m) | Normal load (N) |
|---|---|---|
| 1 | 3.3 | 91.81 |
| 2 | 13.7 | 381.16 |
| 3 | 35.3 | 982.1 |
| 4 | 60.8 | 1691.56 |
| 5 | 94.1 | 2618.02 |
| 6 | 135.5 | 3769.83 |
| 7 | 183.4 | 5102.49 |
| 8 | 239.3 | 6657.72 |
| 9 | 302 | 8402.14 |
| 10 | 372.6 | 10366.34 |
| 11 | 450.1 | 12522.52 |
| 12 | 534.5 | 14870.67 |
| 13 | 629.7 | 17519.29 |
| 14 | 730.3 | 20318.14 |
| 15 | 838.4 | 23325.66 |
| 16 | 953.9 | 26539.06 |
As the input torque increases, the friction coefficient rises, reaching 0.37 at stage 14. The contact temperature increases proportionally. The lubricant viscosity decreases with increasing temperature and pressure. The minimum film thickness and film thickness ratio decrease. At stage 14, the film thickness ratio approaches zero, indicating boundary lubrication and high scuffing risk. Based on the critical scuffing temperature criterion \(T_S = 26.2 \ln(v_{40})\), where \(v_{40} = 105 \, \text{cSt}\) for SAE 30, the critical scuffing temperature is 395.15 K. My model predicts scuffing failure between stages 10 and 11, with bulk temperature rising from 60 °C to 122 °C. The contact temperature is highest at the approach and recess points, which explains why scuffing damage often occurs there.
I compared the ISO standard flash temperature method with my improved method. The ISO method overestimates contact temperature because it ignores mixed EHL effects and uses a conservative Blok flash temperature. My improved method considers asperity friction heat, lubricant shear heat, and viscosity–pressure–temperature coupling. The improved method is more accurate for miter gear and can also be applied to spur and helical gears.
I analyzed the influence of tooth surface contact state updates. In early stages, wear is small and ignoring updates has little effect. In later stages, accumulated wear significantly changes the contact state. Ignoring updates leads to lower computed contact temperature and higher film thickness, causing inaccurate scuffing prediction. Therefore, updating contact parameters is essential for accurate anti-scuffing analysis.
Surface hardness strongly affects scuffing load capacity. Higher hardness (60 HRC) delays scuffing to stage 12, while lower hardness (40 HRC) causes scuffing near stage 10. Higher hardness reduces wear and maintains better contact state. Surface roughness also affects scuffing. Lower roughness (0.2 μm) improves anti-scuffing performance, while higher roughness (0.8 μm) reduces it. The effect is less pronounced in early stages but becomes significant as wear accumulates.
Conclusions. I established a mixed thermal elastohydrodynamic lubrication model for miter gear and calculated film thickness, asperity load ratio, and film thickness ratio. The pressure is shared by asperities and the oil film. Higher roughness increases asperity contact ratio and decreases film thickness ratio. The ISO standard overestimates contact temperature. My improved method accounts for asperity friction and lubricant shear heat, giving more reasonable results. Torque and speed increase contact temperature, while better lubricants reduce it. The DEG-based wear model predicts wear depth distribution along the line of action and face width. The wear depth is higher on the driving gear and minimum at the pitch point. Updating contact parameters during wear analysis is necessary for accurate scuffing prediction. The scuffing failure stage for the herringbone gear is predicted between stages 10 and 11 of the standard test. Surface hardness and roughness significantly affect anti-scuffing load capacity. Higher hardness and lower roughness improve performance. These findings provide theoretical support for designing miter gear transmission systems with enhanced anti-scuffing capacity.