
The stress ratio r = 0.6, the number of cycles n corresponding to the stress intensity factor at the crack tip under different crack lengths and different crack lengths obtained by simulation, and the number of cycles n obtained from the test and the calculated n are drawn into a curve. The relationship between the two groups of data is shown in the figure.
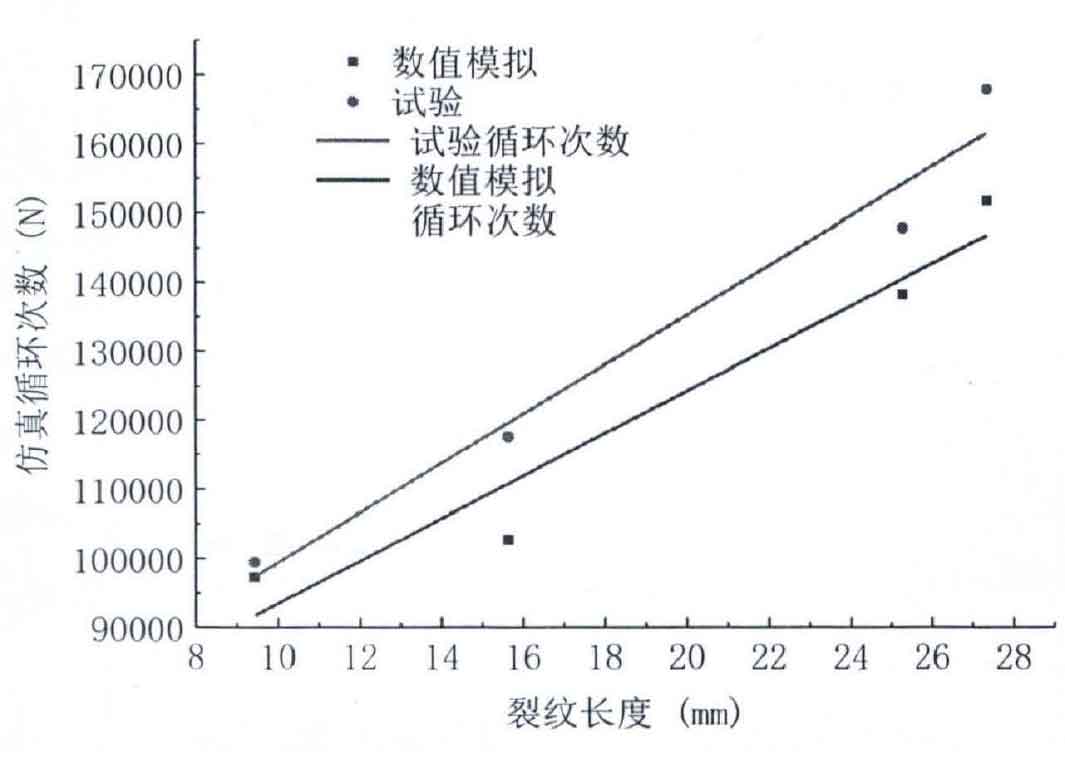
It can be seen from the figure that under the same crack length, the number of cycles obtained from the test is always higher than the theoretical value obtained by simulation, but there is little difference between the two. That is to say, when the sample is extended to the same crack length, the number of cycles is always calculated by using the numerical simulation method. When the numerical simulation calculation shows that the sample has been fatigue damaged, but in fact, the sample has not reached the fatigue life.