
As the engineer responsible for the post-test teardown and failure investigation described in this work, I examined a turboprop engine reducer whose pinion gears exhibited a highly distinctive damage pattern on the working flanks of the driving gear teeth. The reducer is an independent unit mounted at the front of the engine, and it is the component that ultimately drives the propeller; all propeller blades and aircraft accessories are attached to its rear face. Structurally, the unit consists of a casing, a gear train, a propeller shaft, bearings, and a lubrication system. Within that architecture, the pinion gears of the main transmission chain carry the highest loads and are therefore designed with material and heat-treatment requirements that exceed those normally applied to general-purpose gearing.
Because the pinion gears in this reducer transmit the full engine power at high rotational speed and under severe loading, the reliability of the whole transmission system depends on the contact performance of their flanks. In service and during rig testing, however, I have repeatedly observed flank distress on these pinion gears, including pitting and, in the most severe instance, a characteristic inverted-triangular spall. The purpose of my investigation was to establish the failure mode, identify the root cause, and propose modifications that would allow the unit to pass its qualification test. The damage was analysed by macroscopic and microscopic observation, metallographic sectioning, hardness and case-depth measurement, dimensional metrology of the tooth geometry, and numerical contact simulation.
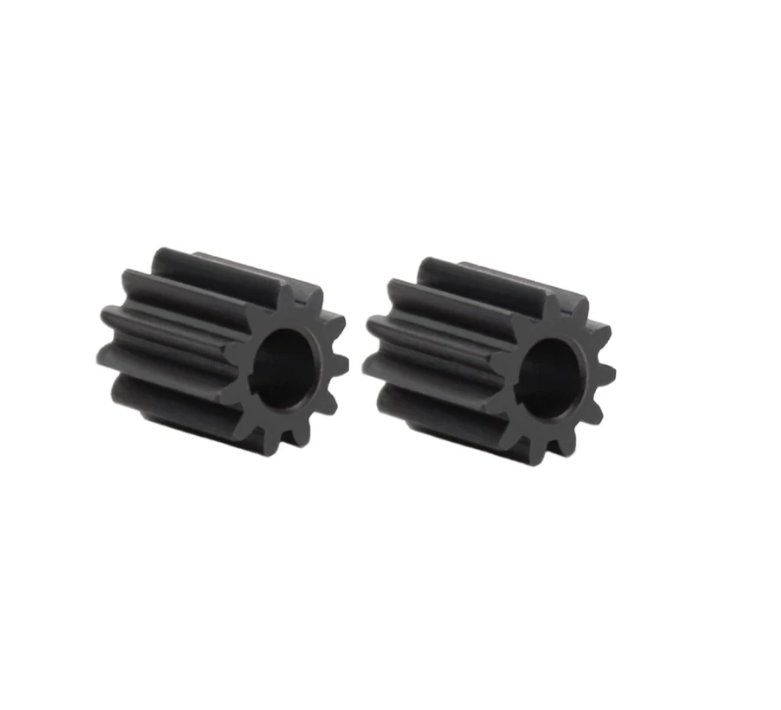
1. Component Description and Material Specification
The driving gear, which is the pinion gear of primary interest here, is a symmetric component with left-hand and right-hand helical teeth distributed about a central shaft and two journals. Multiple teeth on the left-hand helix showed identical damage on the working flank, while the two journals displayed only light fretting marks and no other abnormality. The mating driven gear is the larger wheel of the pair, and the interaction between the driven gear tooth tip and the pinion gear flank near the root proved to be the critical tribological interface in this failure.
The pinion gears are manufactured from a carburizing gear steel of the 10CrNi2Mo3Cu2V type. The teeth are case-carburized and quenched so that the surface hardness exceeds 60 HRC, the core hardness lies in the range of 33 to 41 HRC, and the effective case depth, defined at a hardness of 550 HV, lies between 0.6 and 0.9 mm. These requirements are summarized in Table 1 together with the measured values that I obtained later in the investigation.
| Parameter | Requirement | Measured (damaged pinion gear) | Measured (undamaged tooth) | Assessment |
|---|---|---|---|---|
| Material | 10CrNi2Mo3Cu2V carburizing steel | Conforming | Conforming | Acceptable |
| Surface hardness | ≥ 60 HRC | 61.0–63.5 HRC | 61.0–63.0 HRC | Acceptable |
| Core hardness | 33–41 HRC | 39–40 HRC | 39–40 HRC | Acceptable |
| Effective case depth (550 HV) | 0.6–0.9 mm | 0.807–0.897 mm | 0.753–0.898 mm | Acceptable |
| Surface microstructure | Hidden needle martensite + fine carbides | Conforming | Conforming | Acceptable |
| Core microstructure | Tempered martensite | Conforming | Conforming | Acceptable |
Because the material system was fully conforming, I could exclude material quality, case-depth deficiency, and hardness deficiency as primary causes at a very early stage. The remainder of the investigation therefore concentrated on the geometry of the gear pair and on the resulting contact stress field.
2. Experimental Programme
I structured the work as a sequence of progressively finer examinations, each designed to test a specific hypothesis. The macroscopic examination established the shape and orientation of the damage; the microscopic examination revealed the initiation site and the local damage mechanism; the metallurgical work eliminated material factors; the dimensional metrology quantified geometrical deviations; and the numerical simulation translated those deviations into contact stress values that could be compared directly with the fatigue limit of the material.
| Stage | Technique | Instrumentation / Standard | Information Obtained |
|---|---|---|---|
| 1 | Visual and stereoscopic examination | Stereo microscope, low magnification | Damage location, shape, extent, contact pattern |
| 2 | Scanning electron microscopy | Secondary electron imaging | Initiation site, striations, micro-pitting |
| 3 | Metallography | Sectioning, mounting, polishing, 4 vol.% nital etch | Crack path, case depth, microstructure |
| 4 | Microhardness gradient | 500 g load, 550 HV criterion, conversion to HRC | Case depth, subsurface hardness |
| 5 | Gear geometry metrology | Profile and lead measurement | Profile modification, tip chamfer radius |
| 6 | Numerical simulation | Loaded tooth contact analysis software | Contact stress distribution, peak stress |
| 7 | Verification test | Reducer rig, cumulative 160 h | Effectiveness of corrective actions |
3. Macroscopic Damage Characteristics
Under stereoscopic examination I found that the damage on the pinion gears was remarkably consistent from tooth to tooth. The affected region was located close to the middle of the working flank in the face-width direction, and in the tooth-height direction it lay at approximately one third of the tooth height measured from the root. The apex of the inverted triangle was located about 3.5 mm above the root, and the damaged area widened continuously from that apex toward the tooth tip.
Below the triangular spall I observed a linear heavy-contact trace that ran in the face-width direction and was centred on the flank. Its position coincided exactly with the lower boundary of the triangular damage. This heavy-contact band is the fingerprint of an edge or near-edge contact condition rather than a nominal, uniformly distributed rolling contact. The measured overall extent of the spalling region was approximately 8.4 mm in the face-width direction and 11.0 mm in the tooth-height direction, with a micro-pitted band approximately 1.89 mm wide located immediately below the origin of the spall. In addition, the tooth tip of at least one tooth had already lost a block of material, which I interpreted as a secondary event following the main spall.
| Feature | Observation | Engineering Interpretation |
|---|---|---|
| Spall shape | Inverted triangle, widening toward the tip | Directional crack propagation driven by rolling plus sliding |
| Apex position | ≈ 3.5 mm above the root, ≈ 1/3 tooth height | Region of combined maximum Hertzian and shear stress |
| Face-width location | Central portion of the flank | Consistent with the nominal contact pattern, not a misalignment artifact |
| Spall dimensions | ≈ 8.401 mm × 11.046 mm | Large, fully developed macro-spall |
| Micro-pitting band | ≈ 1.89 mm wide, below the spall | Initiation zone of the fatigue process |
| Heavy contact trace | Linear, near the root, below the spall | Local stress concentration at the contact boundary |
| Tooth tip condition | Block loss on one tooth | Secondary brittle fracture of the deep, hard case |
| Journals | Light fretting only | No independent bearing-related root cause |
4. Microscopic Examination
Scanning electron microscopy confirmed the macroscopic impression of directionality. The spalling region had a clear directional character, and by following the progression of the flaking I concluded that the spall initiated along the lower edge of the inverted triangle, in the micro-pitted zone, and then propagated toward the tooth tip. The surface surrounding the initiation area showed the same micro-pitting morphology, and at the most severely affected locations the micro-pits had already coalesced into small spall craters. Within the initiation zone I found distinct heavy-contact marks produced by the mating tooth, and inside the triangular spall crater itself the fracture surface displayed well-defined fatigue striations.
The presence of fatigue striations is decisive evidence for a cyclic damage mechanism rather than a single overload event. Taken together, the observations allowed me to construct the following sequence:
$$ \text{local stress concentration} \;\rightarrow\; \text{micro-pitting} \;\rightarrow\; \text{crack initiation} \;\rightarrow\; \text{crack propagation} \;\rightarrow\; \text{macro-spalling} \;\rightarrow\; \text{tip chipping} $$
Each stage in this sequence is associated with a distinct morphological signature, and all of the signatures were found on the same set of pinion gears.
5. Metallographic Investigation
I extracted metallographic specimens from the spalled tooth at the mid-height position of the flank, and also from an intact tooth of the same gear at the equivalent position. After mounting and polishing, the unetched specimens revealed a crack propagating at approximately 30° to the tooth surface in the vicinity of the spall initiation site. The crack originated in a region where a distinct block of material had already been removed, and no non-metallic inclusions or other material defects were found at the origin.
After etching with 4 vol.% nital by cold swabbing, the carburized case was clearly visible on both the damaged and the undamaged teeth. The case depth appeared uniform around the profile. The case microstructure consisted of hidden needle martensite with a small amount of granular carbide and a small amount of retained austenite, while the core was tempered martensite. I found no abnormality in the microstructure of the pinion gears, and no significant microstructural difference between the damaged tooth and the neighbouring intact teeth. This result is important: it demonstrates that the spalling was not caused by microstructural degradation, carbide networking, excessive retained austenite, or intergranular oxidation.
| Metallographic Feature | Damaged Tooth | Intact Tooth | Conclusion |
|---|---|---|---|
| Case microstructure | Hidden needle martensite, fine carbides, minor retained austenite | Same | Normal |
| Core microstructure | Tempered martensite | Same | Normal |
| Case depth uniformity | Uniform around profile | Uniform around profile | Normal |
| Crack path | ≈ 30° to the surface, propagating inward and toward the tip | None | Fatigue driven by contact stress |
| Inclusions at origin | None observed | Not applicable | No material defect contribution |
| Oxidation or decarburization | None observed | None observed | No heat-treatment defect |
6. Hardness and Case-Depth Results
Hardness was measured using a microhardness gradient method with a load of 500 g. Subsurface Vickers values were converted to Rockwell C hardness according to the relevant conversion standard. The effective case depth was determined at the 550 HV threshold. The results are listed in Table 6.
| Measurement Zone | Damaged Tooth: Case Depth / mm | Damaged Tooth: Subsurface Hardness / HRC | Intact Tooth: Case Depth / mm | Intact Tooth: Subsurface Hardness / HRC |
|---|---|---|---|---|
| Working flank | 0.897 | 63.5 | 0.881 | 63.0 |
| Non-working flank | 0.883 | 63.0 | 0.898 | 61.0 |
| Dedendum region | 0.807 | 61.0 | 0.753 | 61.0 |
Every measured value falls inside the specified window. The hardness transition from the case to the core is smooth and consistent between the damaged and undamaged teeth, which again indicates that the pinion gears were correctly manufactured from a metallurgical point of view. Consequently, the failure had to be explained by a mechanical overload of an otherwise sound component.
7. Geometry Metrology of the Gear Pair
The decisive measurements came from the inspection of the tooth geometry. Re-examination of the profile modification of both members of the pair showed that the driving gear, the pinion gear, was manufactured within the design tolerance, whereas the driven gear exhibited a modification amount that was too small, with out-of-tolerance values, the minimum measured value being only 9.4 µm against a design requirement of 10 to 20 µm.
Even more significantly, the drawing specifies a tooth tip chamfer or tip rounding of 0.4 to 0.5 mm on the driven gear, but the measured tip condition was a chamfer with a radius of only 0.10 to 0.19 mm. All measured values were below the lower limit of the specification. Furthermore, the chamfer had been produced by manual dressing, so the geometry was irregular and local sharp edges were inevitably generated.
| Geometrical Feature | Design Requirement | Measured Value | Deviation | Impact |
|---|---|---|---|---|
| Driving gear (pinion gear) profile modification | Within specified band | Within band | None | Not the cause |
| Driven gear profile modification | 10–20 µm | Minimum 9.4 µm | Below lower limit | Contact band shifted toward the root of the pinion gear |
| Driven gear tip chamfer radius | 0.4–0.5 mm | 0.10–0.19 mm | Far below lower limit | Sharp edge contact, severe local stress concentration |
| Chamfer regularity | Machined, uniform | Manual dressing, irregular | Non-conforming | Local edge contact and load spikes |
The two deviations act in the same direction. The insufficient profile modification allows the contact band on the pinion gear to migrate toward the root, and the undersized tip chamfer of the driven gear creates a sharp, poorly blended edge that bears against exactly that region. The consequence is a local contact stress far in excess of the nominal design value.
8. Numerical Contact Analysis
I built a numerical model of the reducer transmission in a professional gear contact analysis environment and imported the measured geometry, including the actual modification amounts and the actual tip chamfer radii of the driven gear. The model accounts for the elastic deformation of the teeth, the load sharing between simultaneously meshing tooth pairs, and the boundary conditions imposed by the bearings and the casing.
The fundamental contact mechanics of the interface are described by the Hertzian formulation. For two elastic bodies in line contact, the maximum contact pressure is
$$ \sigma_{H,\max}=\sqrt{\frac{F_n}{b}\cdot\frac{1}{2\pi}\cdot\frac{\left(\frac{1}{\rho_1}+\frac{1}{\rho_2}\right)}{\left(\frac{1-\nu_1^{2}}{E_1}+\frac{1-\nu_2^{2}}{E_2}\right)}} $$
where Fn is the normal force on the tooth pair, b is the contact width, ρ1 and ρ2 are the local radii of curvature of the two flanks, and ν and E are the Poisson ratios and elastic moduli. The corresponding semi-contact width is
$$ a=\sqrt{\frac{4F_n}{\pi b}\cdot\frac{\left(\frac{1-\nu_1^{2}}{E_1}+\frac{1-\nu_2^{2}}{E_2}\right)}{\left(\frac{1}{\rho_1}+\frac{1}{\rho_2}\right)}} $$
The maximum subsurface shear stress, which governs the initiation of rolling contact fatigue, occurs at a depth of approximately
$$ z_{\tau}\approx 0.786\,a,\qquad \tau_{\max}\approx 0.300\,\sigma_{H,\max} $$
Because the local radius of curvature enters the denominator of the Hertzian expression under a square root, the contact stress scales with the equivalent curvature radius as
$$ \sigma_{H,\max}\propto \rho_{eq}^{-1/2},\qquad \frac{1}{\rho_{eq}}=\frac{1}{\rho_1}+\frac{1}{\rho_2} $$
This relationship explains why the small tip chamfer radius of the driven gear is so damaging. When the driven gear tip is nearly sharp, the local radius of curvature at the point of contact collapses, the equivalent curvature radius becomes small, and the contact stress rises sharply. I express the resulting amplification by an edge stress concentration factor,
$$ K_{edge}=\frac{\sigma_{H,tip}}{\sigma_{H,flank}} = \left(\frac{\rho_{eq,flank}}{\rho_{eq,tip}}\right)^{1/2} $$
Using the simulated stress values for the as-built geometry, the measured amplification was 2113 MPa at the tip against approximately 918 MPa on the nominal flank, giving
$$ K_{edge}=\frac{2113}{918}\approx 2.30,\qquad \frac{\rho_{eq,flank}}{\rho_{eq,tip}}\approx 2.30^{2}\approx 5.3 $$
The condition is thus not a marginal overload but a very large local stress concentration. In addition, the contact stress distribution can be written in the conventional gear-design format as
$$ \sigma_{H}=Z_E Z_H Z_{\varepsilon}\sqrt{\frac{F_t}{d_1 b}\cdot\frac{u+1}{u}\cdot K_A K_V K_{H\beta}K_{H\alpha}} $$
where ZE, ZH, and Zε are the elasticity, zone, and contact ratio factors; Ft is the tangential force; d1 is the reference diameter of the pinion gear; u is the gear ratio; and the K factors account for application, dynamic, face load distribution, and transverse load distribution effects. The undersized tip chamfer mainly alters KHα and the local value of ρeq, and both effects increase σH.
I ran the model for a series of driven gear tip chamfer radii while holding everything else constant. The results are summarized in Table 8.
| Tip Chamfer Radius of the Driven Gear / mm | Peak Contact Stress at the Tip / MPa | Peak Contact Stress on the Flank / MPa | Location of the Overall Maximum | Ratio to Nominal Flank Stress |
|---|---|---|---|---|
| 0.1 (as-built, worst case) | 2113 | ≈ 918 | Tip region contacting the pinion gear root | 2.30 |
| 0.4 | 779–1025 | ≈ 1025 | Mid-flank | ≈ 1.12 |
| 0.5 | 779 | 851 | Mid-flank | ≈ 0.93 |
The trend is unambiguous. As the tip chamfer radius of the driven gear increases, the stress at the tip falls steeply, and the position of the maximum stress migrates from the tip region to the mid-flank, which is the intended design condition. At a radius of 0.4 mm the maximum stress is located in the middle of the flank and does not exceed the fatigue limit of the material. At 0.5 mm the whole contact field becomes benign, with the flank maximum at 851 MPa and the tip maximum at 779 MPa.
I also examined the sensitivity of the result to the profile modification amount. The undersized modification had the effect of shifting the heavy-load region of the pinion gear downward toward the root, so that the lower boundary of the contact band encroached on the region where the root fillet begins to influence the local compliance. When the modification amount is increased, the contact band migrates back toward the tip on the pinion gear flank and toward the root on the driven gear flank, which is exactly the intended load distribution.
| Simulation Case | Driven Gear Modification / µm | Driven Gear Tip Radius / mm | Peak Stress / MPa | Contact Band Position on the Pinion Gear | Assessment |
|---|---|---|---|---|---|
| Baseline, as-built | 9.4 (minimum measured) | 0.10–0.19 | 2113 | Shifted toward the root, heavy boundary trace | Unacceptable |
| Radius corrected only | 9.4 | 0.40 | 1025 | Mid-flank | Acceptable stress level |
| Radius corrected only | 9.4 | 0.50 | 851 (flank), 779 (tip) | Mid-flank | Comfortable margin |
| Fully corrected | 18–25 | 0.40 | 1025 | Mid-flank, boundary moved toward the tip | Acceptable and verified |
9. Comparison with the Material Fatigue Limit
To convert the computed stresses into a pass or fail judgement, I compared them with the allowable contact stress for this class of case-carburized gear steel. The allowable value used as a reference in my assessment was of the order of 1500 MPa, consistent with the fatigue performance normally expected from a properly carburized and hardened surface with a hardness above 60 HRC. The safety factor is defined as
$$ S_H=\frac{\sigma_{H,\lim}}{\sigma_{H,\max}} $$
and the results are given in Table 10.
| Condition | Peak Contact Stress / MPa | Reference Allowable Stress / MPa | Safety Factor SH | Outcome |
|---|---|---|---|---|
| As-built, tip radius 0.1 mm | 2113 | 1500 | 0.71 | Overload, fatigue initiation expected |
| Nominal flank stress, as-built | 918 | 1500 | 1.63 | No failure expected on the nominal flank |
| After tip radius correction to 0.4 mm | 1025 | 1500 | 1.46 | Acceptable |
| After tip radius correction to 0.5 mm | 851 | 1500 | 1.76 | Acceptable with margin |
The table makes the root cause quantitatively explicit. The nominal flank loading of the pinion gears was entirely acceptable, with a safety factor above 1.5. The failure occurred only because the local stress at the contact boundary, produced by the combination of insufficient profile modification and an undersized tip chamfer, exceeded the fatigue limit by a factor of approximately 1.4 in the reverse sense. The material was not at fault; the local geometry was.
10. Lubrication Regime and Micro-Pitting
Because the failure began as micro-pitting, I also assessed the lubrication condition of the contact. For concentrated counterformal contacts, the minimum film thickness is commonly estimated with the Hamrock–Dowson relation
$$ h_{min}=3.63\,R’\,U^{0.68}G^{0.49}W^{-0.073}\left(1-e^{-0.68k}\right) $$
where R′ is the equivalent radius, U, G, and W are the dimensionless speed, material, and load parameters, and k is the ellipticity ratio. The severity of the lubrication regime is expressed by the lambda ratio
$$ \Lambda=\frac{h_{min}}{\sigma_{rms}},\qquad \sigma_{rms}=\sqrt{R_{q1}^{2}+R_{q2}^{2}} $$
where Rq1 and Rq2 are the root-mean-square roughness values of the two surfaces. When the lambda ratio is low, the surfaces operate in the mixed lubrication regime, the load is carried by a limited number of micro-convex asperities, and the local pressure at those asperities greatly exceeds the nominal Hertzian value. The actual area of contact is then a very small fraction of the apparent area.
In this reducer, the pinion gears operate with a loaded contact that is already close to the mixed lubrication regime. Because the driven gear tip was effectively sharp, the equivalent radius of curvature at that specific location became small, the nominal contact stress there rose, and the real area of contact was further restricted to a few asperities. Those asperities therefore carried extremely high Hertzian pressures, exceeding the fatigue limit of the 10CrNi2Mo3Cu2V material.
| Mechanism Stage | Contact Condition | Governing Quantity | Resulting Damage Feature |
|---|---|---|---|
| Nominal rolling | Flank contact away from the boundary | σH ≈ 918 MPa | None |
| Boundary loading | Sharp tip of the driven gear against the pinion gear flank | σH ≈ 2113 MPa | Localized high pressure at asperities |
| Mixed lubrication | Partial film, asperity contact | Low lambda ratio | Micro-pitting |
| Cyclic stressing | Repeated meshing | τmax ≈ 0.30 σH | Crack initiation |
| Lubricant entrapment | Oil forced into the micro-pits and cracks | Hydraulic pressure at the crack tip | Accelerated crack growth |
| Final stage | Case embrittlement at the tip | Reduced fracture toughness of the deep case | Tip chipping as secondary damage |
11. Damage Mechanism and the Role of Sliding
The kinematics of the mesh are essential to understanding why the damage took the form of an inverted triangle. The pinion gear and the driven gear first come into contact near the root of the pinion gear and the tip of the driven gear. At that instant the sliding velocity is at a maximum, and its direction is toward the root of the pinion gear, while the rolling velocity is directed toward the tip.
For a contact point at a distance x from the pitch point, the sliding velocity is
$$ v_s=(\omega_1+\omega_2)\,x $$
for an external gear pair, and the specific sliding is
$$ \gamma_s=\frac{v_s}{v_t} $$
where vt is the tangential velocity. Because the sliding velocity increases with distance from the pitch point, the region near the root of the pinion gear experiences high sliding combined with high normal load. The friction force generated by that sliding adds a shear stress to the surface asperities on top of the Hertzian compressive stress field.
The stress state at an asperity can therefore be written as a superposition,
$$ \sigma_{asperity}=\sigma_{H,local}+\sigma_{friction},\qquad \sigma_{friction}=\mu\,p_{asperity} $$
where μ is the local friction coefficient and pasperity is the local asperity pressure. Under the combined action of the Hertzian and shear cyclic stresses, the surface asperities deform plastically. With continued cycling, plastic deformation accumulates, residual tensile stresses develop, and fatigue cracks initiate. This is the origin of the micro-pitting observed immediately below the inverted triangular spall.
Once micro-pits have formed, the mechanism accelerates through the hydraulic pressure propagation effect. Lubricant is trapped in the pits and, under the rolling and sliding action of the mating tooth, is pressurized. The pressure acts at the crack tip and generates an additional tensile stress intensity that is not present in a dry contact. The total stress intensity at the crack tip can be written as
$$ K_I=K_{I,mech}+K_{I,fluid} $$
where the first term results from the mechanical loading and the second from the entrapped lubricant. Because the contact stress near the root of the pinion gear was exceptionally high, the lubricant pressure in the pits was correspondingly high, and the crack propagated rapidly. This is why the resulting spall has a characteristic fan or inverted-triangle shape that differs from the morphology produced by ordinary mechanical fatigue alone.
The crack then propagated toward the tip under the repeated tensile stress cycles produced by meshing. When the crack reached the tip region, where the carburized case is deep and therefore relatively brittle, a block of material separated, producing the tip chipping that I observed as a secondary damage event. In other words, the tip fracture was not an independent failure but the final stage of a single continuous damage process.
I can express the cumulative damage in the framework of the Palmgren–Miner rule,
$$ D=\sum_i \frac{n_i}{N_i},\qquad N_i=\frac{1}{2}\left(\frac{\sigma_{a,i}}{\sigma_f’}\right)^{1/b} $$
where ni is the number of cycles at the stress amplitude σa,i, Ni is the corresponding fatigue life from the Basquin relation
$$ \sigma_{a}=\sigma_f’\left(2N_f\right)^{b} $$
and σf′ and b are material constants. The presence of the local stress concentration means that a small fraction of the tooth flank area accumulates damage at a vastly higher rate than the rest, because life depends on stress raised to the inverse power of the fatigue exponent, which for carburized steels is typically in the range of −0.07 to −0.12. Damage therefore localizes at the boundary of the contact band, exactly where the spall initiated.
12. Corrective Actions
Having established the root cause, I proposed a set of corrective actions focused on the driven gear, because the pinion gears themselves were manufactured to specification. The measures were deliberately conservative so that the contact pattern would be corrected without altering the load-carrying capacity of the transmission.
| Measure | Previous Condition | Corrected Condition | Expected Effect |
|---|---|---|---|
| Increase the driven gear profile modification | 10–20 µm band, measured minimum 9.4 µm | 18–25 µm band | Shift the pinion gear contact band toward the tip and the driven gear band toward the root |
| Standardize the tip chamfer process | Manual dressing, 0.10–0.19 mm, irregular | Machined, 0.4–0.5 mm, uniform | Eliminate sharp edges and reduce the local stress concentration |
| Introduce chamfer inspection requirements | Not formally controlled | Formal metrology of the tip radius on every driven gear | Prevent recurrence and ensure process capability |
| Improve overall machining quality of the driven gear | Inconsistent | Controlled process with documented capability | Stable contact pattern |
| Verify the contact pattern by simulation before assembly | Not routine | Loaded tooth contact analysis with measured geometry | Early detection of boundary loading |
I re-ran the simulation with the corrected geometry. With the increased modification amount and a tip chamfer radius of 0.4 mm on the driven gear, the lower boundary of the heavy-load region on the pinion gears moved upward, away from the root, and the maximum stress moved to the middle of the flank at a value of 1025 MPa. This is below the allowable contact stress of the material and corresponds to a safety factor of approximately 1.46. The edge stress concentration factor dropped from 2.30 to a value close to unity, which means that the sharp-edge contact condition had been eliminated.
| Parameter | Before Correction | After Correction | Change |
|---|---|---|---|
| Driven gear modification / µm | 9.4–20 | 18–25 | Increased |
| Driven gear tip radius / mm | 0.10–0.19 | 0.40–0.50 | Increased by more than a factor of two |
| Peak contact stress / MPa | 2113 | 1025 | Reduced by 51.5% |
| Edge concentration factor | 2.30 | ≈ 1.00 | Eliminated |
| Location of maximum stress | Tip of the driven gear against the pinion gear root | Mid-flank | Restored to the design intent |
| Safety factor against the fatigue limit | 0.71 | 1.46 | Above unity |
| Contact pattern | Heavy trace near the root | Centred on the flank | Normal |
13. Verification Testing
The corrected gear pairs were assembled into reducers and subjected to the same series of tests that had previously produced the failure. The units accumulated 160 hours of operation before teardown. After disassembly, the working flanks of the pinion gears showed a normal contact pattern, and there was no heavy-contact band near the root, no micro-pitting, and no inverted-triangular spalling. The tip condition of the driven gears was also satisfactory, with no evidence of edge loading. The reducer consequently passed its qualification examination.
| Verification Item | Acceptance Criterion | Observed Result | Assessment |
|---|---|---|---|
| Cumulative running time | Qualification duration | 160 h | Completed |
| Contact pattern on the pinion gears | Centred, no boundary trace | Normal | Pass |
| Micro-pitting near the root | None | None | Pass |
| Inverted-triangular spalling | None | None | Pass |
| Tip chipping | None | None | Pass |
| Overall reducer status | Pass the examination | Passed | Pass |
The success of the verification test confirms that the root cause had been correctly identified. Had the failure been caused by a material defect, by an inadequate case depth, or by a lubrication deficiency, the geometrical corrections would not have eliminated the damage. Since they did, the evidence forms a closed loop: the observed damage, the measured geometry, the computed stress, and the corrected behaviour all point to the same conclusion.
14. Design and Manufacturing Lessons
Several general lessons emerge from this investigation, and I consider them applicable to any high-power-density gearbox in which pinion gears operate at high speed and high load.
First, the tip chamfer of the mating gear is not a cosmetic feature. It directly controls the local radius of curvature at the boundary of the contact band, and because contact stress scales as the inverse square root of the equivalent curvature radius, an undersized chamfer can more than double the local stress. In this case, the chamfer was specified as 0.4 to 0.5 mm but delivered at 0.10 to 0.19 mm, and the stress at the tip reached 2113 MPa instead of a nominal flank value of approximately 918 MPa.
Second, profile modification must be treated as a system-level parameter. The purpose of modification is to compensate for elastic deflection and misalignment and to keep the contact band away from the edges. When the modification on one member is too small, the contact band migrates on the other member, and the migration direction is precisely toward the region where the pinion gear is most vulnerable, namely the root region where the mating tooth tip enters the mesh.
Third, the interaction between the two deviations is nonlinear. A small modification error alone would probably not have caused failure, and a small chamfer error alone might also have been tolerable. Together they produced a stress concentration factor of 2.30 and a safety factor of 0.71 against the fatigue limit, which is a severe overload condition.
Fourth, the failure morphology carries diagnostic information. The inverted triangular shape is the signature of a mixed mechanism combining cyclic contact stress, sliding friction, and hydraulic pressure propagation from entrapped lubricant. Micro-pitting at the origin and fatigue striations inside the spall are the evidence of a progressive, cycle-dependent process rather than an instantaneous overload.
Fifth, simulation based on measured, as-built geometry rather than nominal geometry is a powerful diagnostic and preventive tool. In this investigation, the numerical model was able to reproduce the observed pattern of boundary loading, quantify the stress concentration, and predict the effect of each corrective action before any hardware was changed.
15. Conclusions
Based on the macroscopic and microscopic observation, metallographic examination, hardness and case-depth measurement, geometry metrology, and numerical contact simulation that I carried out on the damaged reducer pinion gears, I draw the following conclusions.
The inverted-triangular damage on the working flanks of the pinion gears is contact fatigue spalling. The spall originated in a micro-pitted zone located below the spall crater, close to the root, and propagated toward the tooth tip. The presence of fatigue striations and the characteristic directional morphology confirm the cyclic nature of the damage. The damage is not related to material quality, case depth, hardness, or microstructure, all of which were within specification and uniform between the damaged and undamaged teeth.
The root cause is a local contact stress overload produced by two geometrical deviations acting together. The profile modification of the driven gear was below the design range, with a minimum measured value of 9.4 µm against a requirement of 10 to 20 µm, which shifted the contact band of the pinion gears toward the root. The tip chamfer radius of the driven gear was far below specification, with measured values of 0.10 to 0.19 mm against a requirement of 0.4 to 0.5 mm, and the manual dressing process produced irregular and locally sharp edges. The combination raised the local contact stress at the boundary of the contact band to 2113 MPa, which exceeds the allowable contact stress of the case-carburized material and initiates micro-pitting, crack growth, and finally macro-spalling.
The mechanism proceeds in stages. Mixed lubrication at the asperity level causes local plastic deformation and crack initiation. Lubricant entrapped in the resulting micro-pits is pressurized during meshing and accelerates crack growth through the hydraulic pressure propagation effect, producing the characteristic inverted triangular spall. Continued crack growth toward the tip finally causes brittle chipping of the deep, hard case as a secondary event.
The corrective actions were to increase the driven gear profile modification to 18 to 25 µm, to standardize the tip chamfer process so that the radius is held at 0.4 to 0.5 mm, to add formal chamfer inspection requirements, and to improve the overall machining quality of the driven gear. Simulation with the corrected geometry showed that the maximum contact stress moves to the mid-flank and falls to 1025 MPa, which is below the allowable value. Reducers built with the corrected pinion gears and driven gears completed 160 hours of operation and passed the qualification test with a normal contact pattern and no evidence of micro-pitting or spalling.
The broader conclusion is that edge geometry and profile modification of the mating gear control the local stress state of the pinion gears far more strongly than is often assumed. Because contact stress varies with the inverse square root of the equivalent curvature radius, small geometrical deviations at the tooth tip can produce stress concentrations that dominate the fatigue life of the entire transmission. Controlling those deviations by process specification, inspection, and simulation-based verification is therefore essential for high-reliability gearboxes.