
In my maintenance engineering work on metro vehicles, I have repeatedly observed a mismatch between calendar-based oil replacement and the actual condition of gearbox lubricating oil. The regulated practice requires annual replacement of the lubricating oil inside metro vehicle gearboxes. However, when I examined oil samples that had reached the replacement interval, the oil often remained clear and transparent, with low wear-element content and acceptable physicochemical properties. This suggests that traditional time-based oil replacement does not fully use the remaining performance of the lubricant. Because the reliable operation of pinion gears, bearings, and related transmission components depends strongly on lubricant film integrity and additive performance, I decided to study the degradation behavior of gearbox lubricating oil and to establish data-driven thresholds that can support condition-based oil replacement, often described as quality-based oil replacement.
The central object of my investigation is the metro vehicle gearbox, especially the contact and lubrication environment of pinion gears. Pinion gears operate under high contact stress, repeated loading, and varying speed conditions. Their surfaces depend on a stable lubricating film to avoid scuffing, pitting, and excessive wear. When the lubricating oil degrades, the film may become thinner, additive depletion may reduce extreme-pressure protection, and wear particles may accumulate. These effects can accelerate damage to pinion gears and bearings. Therefore, I focused on wear elements, additive elements, and physicochemical indicators that reflect the condition of the oil and the health of pinion gears.
The literature and field experience show several gaps. Some studies have reported that synthetic gearbox oil can last at least two years, but their conclusions were based mainly on change rates rather than statistical thresholds. Some work has found that the three-line value method is suitable for wear-element thresholds in diesel engine oil, but sampling methods were not controlled sufficiently to guarantee representative samples. Other studies have reported that gearboxes can operate for 300,000 vehicle-km with oil properties within standard limits, but they often neglected additive elements. Additional work has shown slow wear-element variation below 1.5 million km, but did not track additive elements or physicochemical indicators. Some research has indicated that extending the oil change interval to 600,000 vehicle-km is feasible for certain high-speed train gearboxes, but only 100 °C kinematic viscosity was emphasized, while actual gearbox operating temperatures are often in the range of 60–70 °C, making 40 °C kinematic viscosity equally important. Existing heavy-duty gear oil standards are not specific to urban rail transit, and there is no dedicated national standard for metro vehicle gearbox lubricating oil replacement thresholds. I designed this study to address these gaps.
1. Sampling and Monitoring Design
I selected metro vehicles operating on multiple lines with different passenger-flow characteristics. The sample set covered low-passenger-flow lines, medium-passenger-flow lines, and high-passenger-flow lines. In each line and for each train type, I randomly selected eight gearboxes. I collected oil samples approximately every 900 operating hours, producing a total of 450 samples over an operating mileage range of 0 to 200,000 vehicle-km. For each sample, I recorded the sampling time and the accumulated operating mileage. The target was to capture the real degradation process of lubricating oil under normal service conditions and to relate the oil condition to the wear state of pinion gears and bearings.
To ensure effective monitoring and evaluation, I strictly controlled four aspects of sampling: sampling time, sampling tools, sampling depth, and preservation method. I prioritized sampling when the oil was hot, defined as oil temperature of at least 40 °C, or within 30 minutes after the train returned to the depot. This allowed thermal convection to mix the oil sufficiently. I used an automatic sampling device controlled by a programmable logic controller, which applied negative pressure to draw oil. Except for the suction tube, the device had no contact with the oil sample, which reduced external contamination from manual operation and enabled automatic quantitative sampling. I also fabricated a sampling guide tube with an insertion depth of 50% ± 5% of the oil level height, avoiding interference from the surface oxidation layer and bottom sediment. I used disposable sample bottles and stored them in a dark, sealed environment to prevent oxidation from affecting data accuracy.
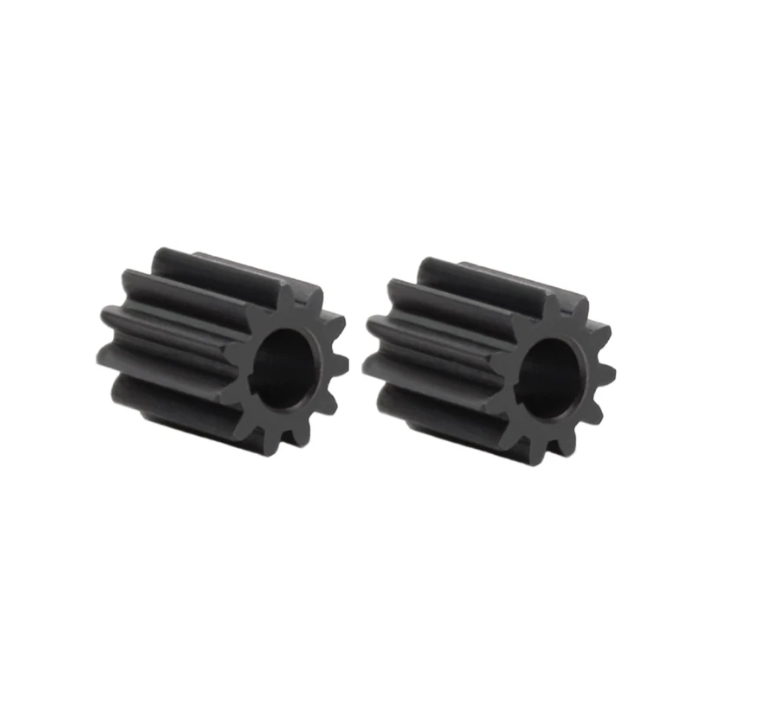
These controls are important because pinion gears and their mating gears generate wear particles that can be unevenly distributed in the oil. A nonrepresentative sample may understate or overstate the actual wear condition of pinion gears. By standardizing the sampling depth and thermal condition, I improved the repeatability of the measured indicators. The sampling protocol is summarized in Table 1.
| Control Aspect | Specification | Reason |
|---|---|---|
| Sampling time | Hot oil at 40 °C or above, or within 30 minutes after depot return | Promote thermal convection and uniform mixing of oil and wear particles from pinion gears |
| Sampling tool | Automatic sampler with PLC-controlled negative pressure | Reduce manual contamination and achieve quantitative sampling |
| Sampling depth | 50% ± 5% of oil level height | Avoid surface oxidation layer and bottom sediment |
| Preservation | Disposable bottles, dark and sealed | Prevent oxidation and light-induced changes |
2. Monitoring Indicators and Their Degradation Logic
In service, metro gearboxes are affected by temperature, load, oxygen, dust, and other environmental factors. These factors can cause oil oxidation, deterioration, emulsification, and the formation of pentane-insoluble matter. Poor lubrication can then lead to abnormal wear of pinion gears, bearings, and other metal components. To protect train operation safety, I studied how wear indicators, additive elements, and physicochemical indicators change with operating mileage. The selected indicators were iron, copper, phosphorus, boron, acid value, 40 °C kinematic viscosity, and 100 °C kinematic viscosity.
Iron and copper represent the wear condition of internal metal components. The gearbox contains gears, including pinion gears, bearings, and cages. During high-speed operation, friction pairs generate wear. Increased wear not only accelerates the wear of pinion gears and bearings but also promotes oil oxidation. Therefore, I tracked iron and copper content as wear indicators for internal metal components. Phosphorus is used to improve anti-wear and extreme-pressure performance, while boron is mainly used to improve oxidation resistance and thermal stability. Additive elements may be consumed by oxidation, which weakens anti-wear, extreme-pressure, antioxidant, and thermal stability performance. As a result, lubricating oil protection for pinion gears can decline even if wear-element values remain moderate.
Kinematic viscosity characterizes the flow performance of the oil. The viscosity directly determines the thickness of the lubricating film on metal surfaces. If the film-forming ability is strong, the oil can effectively protect friction pairs under extreme conditions, reduce friction and wear, and provide anti-friction effects. Acid value represents the total amount of acidic substances in the oil. Because high temperatures occur between friction pairs, the oil gradually oxidizes and produces organic acids, which increases the acid value. Acid value alone cannot fully reflect lubricating oil performance, but its change can serve as an indicator of oil quality change. Excessive acid value can accelerate corrosion of metal parts and cause abnormal wear. The monitoring indicators and their threshold directions are summarized in Table 2.
| Indicator | Unit | Role in Gearbox and Pinion Gears | Expected Trend | Threshold Direction |
|---|---|---|---|---|
| Iron (Fe) | mg/kg | Wear of gears, pinion gears, bearings, and cages | Increases with mileage | Upper bound only |
| Copper (Cu) | mg/kg | Wear of bearing cages and copper-containing components | Increases with mileage | Upper bound only |
| Phosphorus (P) | mg/kg | Anti-wear and extreme-pressure additive for pinion gears | Decreases with consumption | Lower bound only |
| Boron (B) | mg/kg | Antioxidant and thermal stability additive | Decreases with consumption | Lower bound only |
| Acid value | mg KOH/g | Oxidation and acidic product accumulation | May increase or decrease | Two-sided |
| 40 °C kinematic viscosity | cSt | Oil film thickness and flow at normal gearbox temperature | May increase or decrease | Two-sided |
| 100 °C kinematic viscosity | cSt | Oil film behavior at high temperature | May increase or decrease | Two-sided |
3. Data Processing Methods
I first summarized the collected data and examined the distribution of each monitoring indicator. I then used the three-line value method and the maximum entropy method to determine thresholds for specific operating mileage ranges. The three-line value method is based on the Shewhart control chart and the central limit theorem. As sample size increases, the sample mean from a population is assumed to follow a normal distribution. Equipment condition is divided into normal, warning, and abnormal levels. The warning threshold is usually set as the sample mean plus or minus two standard deviations, while the abnormal threshold is set as the sample mean plus or minus four standard deviations.
Let \(n\) be the total number of randomly collected gearbox oil samples. The sample mean is calculated as:
$$\bar{x}_n = \frac{\sum_{i=1}^{n} x_i}{n}$$
The sample standard deviation is calculated as:
$$s_n = \sqrt{\frac{\sum_{i=1}^{n}(x_i – \bar{x}_n)^2}{n-1}}$$
For indicators that can change in both directions, the warning and abnormal thresholds are:
$$y_a = \bar{x}_n \pm 2s_n$$
$$y_b = \bar{x}_n \pm 4s_n$$
where \(\bar{x}_n\) is the sample mean in mg/kg or the relevant unit, \(x_i\) is the value of the \(i\)-th sample, \(s_n\) is the sample standard deviation, \(y_a\) is the three-line warning threshold, and \(y_b\) is the three-line abnormal threshold.
For wear elements such as iron and copper, the content is expected to increase with operating mileage. Therefore, only the upper threshold is relevant. I used:
$$y_{a1} = \bar{x}_n + 2s_n$$
$$y_{b1} = \bar{x}_n + 4s_n$$
For additive elements such as phosphorus and boron, the content is expected to decrease as the additives are consumed. Therefore, only the lower threshold is relevant. I used:
$$y_{a2} = \bar{x}_n – 2s_n$$
$$y_{b2} = \bar{x}_n – 4s_n$$
The maximum entropy method is based on the maximum entropy principle to obtain an unbiased and consistent probability distribution of the sample. Its threshold determination is as follows: if the probability that the sample is less than or equal to an element content \(A\) is exactly 0.9772, then \(A\) is the warning threshold. Similarly, if the probability that the sample is less than or equal to an element content \(B\) is 0.9987, then \(B\) is the abnormal threshold. These relationships are expressed as:
$$y_{a3} = A, \quad \text{when } P(\leqslant A) = 0.9772$$
$$y_{b3} = B, \quad \text{when } P(\leqslant B) = 0.9987$$
where \(P(\leqslant A)\) is the probability of occurrence less than or equal to \(A\), \(P(\leqslant B)\) is the probability of occurrence less than or equal to \(B\), \(y_{a3}\) is the maximum entropy warning value, and \(y_{b3}\) is the maximum entropy abnormal value. The maximum entropy method can only calculate an upper boundary threshold. Therefore, it cannot be used directly for additive elements that decrease or for two-sided indicators such as acid value and kinematic viscosity.
4. Distribution Characteristics of the Oil Data
I analyzed the distribution of iron, copper, phosphorus, boron, acid value, 40 °C kinematic viscosity, and 100 °C kinematic viscosity. The distribution graphs of these indicators generally followed a normal distribution. Because the samples came from the entire metro network, each sample differed in train operating section, passenger load, train speed, station spacing, and gearbox condition. Therefore, the distributions showed some anomalies, but they were still suitable for further threshold confirmation. As the sample size increased, the values of different indicators under different gearbox operating conditions within 0–200,000 vehicle-km became more approximately normal. This supports the use of statistical threshold methods.
For a normal distribution, the probability density function can be written as:
$$f(x) = \frac{1}{\sigma \sqrt{2\pi}} \exp\left[-\frac{(x-\mu)^2}{2\sigma^2}\right]$$
where \(\mu\) is the population mean and \(\sigma\) is the population standard deviation. In practice, I used the sample mean \(\bar{x}_n\) and sample standard deviation \(s_n\) to estimate the threshold values. The normal-like behavior of the data is important because pinion gears and bearings generate wear particles that are influenced by many independent operating factors. When the sample size is sufficient, the combined effect of these factors tends to produce a distribution that is close to normal.
Table 3 presents a qualitative summary of the distribution behavior and the main expected direction of change for each indicator.
| Indicator | Observed Distribution | Main Direction of Change | Implication for Pinion Gears |
|---|---|---|---|
| Iron (Fe) | Approximately normal | Increases with mileage | Wear particles from pinion gears, gears, and bearings |
| Copper (Cu) | Approximately normal | Increases with mileage | Wear from bearing cages and copper-containing components |
| Phosphorus (P) | Approximately normal | Decreases with additive consumption | Loss of anti-wear and extreme-pressure protection for pinion gears |
| Boron (B) | Approximately normal | Decreases with additive consumption | Reduced oxidation resistance and thermal stability |
| Acid value | Approximately normal | May increase or decrease | Oxidation and corrosion risk for pinion gears and bearings |
| 40 °C kinematic viscosity | Approximately normal | May increase or decrease | Changes in oil film thickness at normal gearbox temperature |
| 100 °C kinematic viscosity | Approximately normal | May increase or decrease | Changes in high-temperature oil film behavior |
5. Threshold Results
Using the two methods described above, I calculated thresholds for the monitoring indicators. The results are shown in Table 4. For iron and copper, the warning and abnormal thresholds from the three-line value method and the maximum entropy method were relatively close. The maximum entropy results were slightly larger than the three-line results for the warning threshold. However, because the maximum entropy method has limitations, it could not be used for additives, acid value, or viscosity. When the sample size is sufficiently large, the three-line value method has practical advantages for data processing and interpretation. Therefore, I selected the three-line value method as the final method for threshold calculation.
| Monitoring Indicator | Unit | Three-Line Value Method | Maximum Entropy Method | ||
|---|---|---|---|---|---|
| Warning Threshold | Abnormal Threshold | Warning Threshold | Abnormal Threshold | ||
| Iron (Fe) | mg/kg | 90.37 | 136.92 | 93.61 | 136.37 |
| Copper (Cu) | mg/kg | 20.38 | 31.09 | 22.42 | 37.81 |
| Phosphorus (P) | mg/kg | 1,272.02 | 562.06 | Not applicable | Not applicable |
| Boron (B) | mg/kg | 116.56 | 44.02 | Not applicable | Not applicable |
| Acid value | mg KOH/g | 2.99 ± 0.30 | 2.99 ± 0.60 | Not applicable | Not applicable |
| 40 °C kinematic viscosity | cSt | 111.72 ± 11.35 | 111.72 ± 22.70 | Not applicable | Not applicable |
| 100 °C kinematic viscosity | cSt | 15.33 ± 1.17 | 15.33 ± 2.34 | Not applicable | Not applicable |
For iron, the three-line warning threshold was 90.37 mg/kg and the abnormal threshold was 136.92 mg/kg. For copper, the warning threshold was 20.38 mg/kg and the abnormal threshold was 31.09 mg/kg. These values are directly relevant to the wear state of pinion gears, bearings, and other internal components. If iron or copper exceeds the warning threshold, I interpret this as a signal that wear in pinion gears or related components may be increasing. If the abnormal threshold is exceeded, more immediate maintenance action is needed.
For phosphorus, the warning threshold was 1,272.02 mg/kg and the abnormal threshold was 562.06 mg/kg. Because phosphorus is an anti-wear and extreme-pressure additive, its depletion reduces the protection of pinion gears under high contact stress. For boron, the warning threshold was 116.56 mg/kg and the abnormal threshold was 44.02 mg/kg. Boron contributes to oxidation resistance and thermal stability. When boron falls below the warning threshold, the oil may oxidize more rapidly, especially around hot surfaces of pinion gears and bearings.
For acid value, the three-line warning range was 2.99 ± 0.30 mg KOH/g, and the abnormal range was 2.99 ± 0.60 mg KOH/g. For 40 °C kinematic viscosity, the warning range was 111.72 ± 11.35 cSt, and the abnormal range was 111.72 ± 22.70 cSt. For 100 °C kinematic viscosity, the warning range was 15.33 ± 1.17 cSt, and the abnormal range was 15.33 ± 2.34 cSt. These two-sided indicators are important because both increases and decreases can harm lubrication. An increase in viscosity may reduce oil flow and increase churning loss, while a decrease may reduce oil film thickness and increase wear risk for pinion gears.
Table 5 summarizes the recommended interpretation of the final thresholds for condition-based maintenance.
| Indicator | Normal Condition | Warning Condition | Abnormal Condition |
|---|---|---|---|
| Iron (Fe) | ≤ 90.37 mg/kg | > 90.37 and ≤ 136.92 mg/kg | > 136.92 mg/kg |
| Copper (Cu) | ≤ 20.38 mg/kg | > 20.38 and ≤ 31.09 mg/kg | > 31.09 mg/kg |
| Phosphorus (P) | ≥ 1,272.02 mg/kg | < 1,272.02 and ≥ 562.06 mg/kg | < 562.06 mg/kg |
| Boron (B) | ≥ 116.56 mg/kg | < 116.56 and ≥ 44.02 mg/kg | < 44.02 mg/kg |
| Acid value | 2.69–3.29 mg KOH/g | 2.39–2.69 or 3.29–3.59 mg KOH/g | < 2.39 or > 3.59 mg KOH/g |
| 40 °C kinematic viscosity | 100.37–123.07 cSt | 89.02–100.37 or 123.07–134.42 cSt | < 89.02 or > 134.42 cSt |
| 100 °C kinematic viscosity | 14.16–16.50 cSt | 12.99–14.16 or 16.50–17.67 cSt | < 12.99 or > 17.67 cSt |
6. Regression Model and Degradation Behavior
Using the data set as a foundation, I constructed a linear regression model of lubricating oil performance degradation. Taking iron content as an example, I derived a univariate linear regression equation between the iron threshold and operating mileage. When mileage is expressed in ten-thousand vehicle-km, the warning threshold line can be written as:
$$y_{\text{warning}} = 5.9003x$$
and the abnormal threshold line can be written as:
$$y_{\text{abnormal}} = 8.9308x$$
where \(x\) is operating mileage in ten-thousand vehicle-km and \(y\) is the iron content threshold in mg/kg. These equations indicate that the iron warning and abnormal thresholds increase steadily with operating mileage. At 200,000 vehicle-km, the warning threshold is approximately 118.0 mg/kg and the abnormal threshold is approximately 178.6 mg/kg. These values are consistent with the overall trend that iron content increases as pinion gears and other internal components accumulate service exposure. The regression model helps distinguish normal degradation from abnormal wear. If the measured iron content increases much faster than the regression line, or if a sudden change point appears, the lubricating oil or the gearbox may have reached a critical degradation state.
The same approach can be applied to other indicators. Table 6 presents a conceptual regression summary for the main indicators, with the understanding that the exact coefficients depend on the mileage range and the sample population. The important point is that the linear regression model becomes more stable as the sample size increases. Within 0–200,000 vehicle-km, the degradation behavior was stable enough to support a preliminary extension of the oil change interval.
| Indicator | Regression Direction | Expected Behavior | Use in Pinion Gear Protection |
|---|---|---|---|
| Iron (Fe) | Increasing | Steady increase with mileage | Detect wear acceleration in pinion gears and bearings |
| Copper (Cu) | Increasing | Steady increase with mileage | Detect wear of bearing cages and copper components |
| Phosphorus (P) | Decreasing | Gradual additive consumption | Track loss of anti-wear and extreme-pressure protection |
| Boron (B) | Decreasing | Gradual additive consumption | Track loss of oxidation resistance and thermal stability |
| Acid value | Two-sided | May rise from oxidation or change from contamination | Detect corrosion risk for pinion gears and bearings |
| 40 °C kinematic viscosity | Two-sided | May rise from oxidation or fall from shear | Detect oil film thickness change at normal gearbox temperature |
| 100 °C kinematic viscosity | Two-sided | May rise or fall | Detect high-temperature oil film behavior |
I also compared the two threshold calculation methods in terms of applicability, data requirements, and interpretation. Table 7 summarizes this comparison. The three-line value method is more flexible because it can handle upper-bound, lower-bound, and two-sided indicators. The maximum entropy method is useful for upper-bound wear elements but cannot handle additive depletion or two-sided physicochemical indicators. This limitation is critical when the goal is to protect pinion gears, because both wear increase and additive decrease must be monitored.
| Method | Suitable Indicator Type | Statistical Basis | Main Advantage | Main Limitation |
|---|---|---|---|---|
| Three-line value method | Upper, lower, and two-sided | Mean and standard deviation under approximately normal data | Flexible and easy to apply with large samples | Requires sufficient sample size and normal-like distribution |
| Maximum entropy method | Upper-bound only | Maximum entropy probability distribution | Can provide unbiased probability-based thresholds | Cannot directly handle lower-bound or two-sided indicators |
7. Discussion
The results show that the lubricating oil in metro vehicle gearboxes does not degrade rapidly within 0–200,000 vehicle-km under normal operating conditions. Iron and copper contents increase gradually, while phosphorus and boron contents decrease gradually. Acid value and kinematic viscosity remain within reasonable ranges. These observations indicate that the oil performance at 200,000 vehicle-km is still good. Therefore, the gearbox oil change interval can be extended beyond the traditional annual replacement cycle, provided that condition monitoring is implemented and the thresholds are used correctly.
The protection of pinion gears is a central concern. Pinion gears experience high contact stress, sliding, and rolling contact. The lubricating oil must maintain a sufficient film thickness and provide extreme-pressure and anti-wear additives. When phosphorus and boron decrease, the oil may still appear clear, but its ability to protect pinion gears under severe conditions can decline. Therefore, additive elements should be monitored together with wear elements. A low iron value alone does not guarantee that pinion gears are fully protected, because additive depletion can occur before significant wear appears. Conversely, a rise in iron or copper can indicate that pinion gears or bearings are already experiencing wear, even if the oil appearance remains acceptable.
I found that the three-line value method is more suitable for practical threshold calculation in this application. It provides warning and abnormal thresholds for iron and copper, lower thresholds for phosphorus and boron, and two-sided thresholds for acid value and viscosity. The maximum entropy method gave similar results for iron and copper, but it could not provide the full set of thresholds needed for condition-based maintenance. This is why I selected the three-line value method for the final thresholds. The maximum entropy method remains useful as a cross-check for upper-bound wear elements, but it is not sufficient on its own.
The linear regression model adds another dimension to threshold interpretation. A fixed threshold is useful, but it does not account for the expected change with mileage. The regression model shows that iron thresholds increase steadily with mileage. If the measured iron content is close to the regression line, the wear rate is likely normal. If the measured value deviates significantly above the line, or if a sudden change point appears, the oil may have reached a critical degradation stage or the pinion gears may be experiencing abnormal wear. In this way, the regression model supports early warning and helps avoid unnecessary oil changes while maintaining safety.
Acid value and viscosity require two-sided monitoring. An increase in acid value indicates oxidation and acidic product accumulation, which can corrode pinion gears and bearings. A decrease in acid value may indicate contamination or additive interaction, but it is less common. For 40 °C kinematic viscosity, an increase may be caused by insoluble matter, oxidation, or mixing with other oil, while a decrease may be caused by high-speed shear or mixing. Because the actual gearbox operating temperature is often around 60–70 °C, the 40 °C viscosity is particularly relevant to the oil film thickness experienced by pinion gears during typical service. The 100 °C viscosity remains important for high-temperature conditions. Both should be monitored within their warning and abnormal ranges.
I also considered the influence of route characteristics. Low-passenger-flow lines, medium-passenger-flow lines, and high-passenger-flow lines impose different load cycles on the gearbox. High passenger flow can increase torque demand and thermal load, while low passenger flow may lead to different speed profiles. These differences can affect the degradation rate of the oil and the wear of pinion gears. For this reason, the thresholds should be interpreted with route context. If a particular line shows a faster increase in iron or a faster decrease in phosphorus, the maintenance strategy may need to be adjusted for that line, even if the overall network thresholds remain unchanged.
Sampling quality is another critical factor. If the sample is taken from the surface oxidation layer, the measured additive content may be misleading. If the sample is taken from the bottom sediment, the wear-element content may be artificially high. If the sample is taken when the oil is cold, the wear particles may not be uniformly suspended. My sampling protocol was designed to avoid these errors. The use of an automatic sampler, controlled depth, and sealed bottles improved the reliability of the data. This reliability is essential for pinion gear protection because maintenance decisions based on poor samples can lead to either unnecessary oil changes or undetected wear.
Table 8 presents a condition-based action matrix that I recommend for field application. The matrix combines the thresholds and the regression model. It is intended to support maintenance engineers in making consistent decisions about oil replacement and gearbox inspection.
| Condition | Indicator Pattern | Recommended Action |
|---|---|---|
| Normal | All indicators within normal ranges; measured values close to regression lines | Continue normal operation; maintain regular sampling |
| Warning | Any indicator enters warning range; iron or copper slightly above warning threshold; phosphorus or boron slightly below warning threshold | Increase sampling frequency; inspect pinion gears and bearings at next opportunity; check oil temperature and load history |
| Abnormal | Any indicator enters abnormal range; iron or copper above abnormal threshold; phosphorus or boron below abnormal threshold; acid value or viscosity outside abnormal range | Schedule maintenance; replace oil if confirmed; inspect pinion gears, bearings, and seals; investigate root cause |
| Critical transition | Measured value deviates sharply from regression model; sudden change point in iron or copper | Treat as abnormal even if absolute value is not extremely high; perform immediate inspection of pinion gears and related components |
8. Practical Implications for Condition-Based Oil Replacement
The traditional annual oil change is simple but not optimal. It ignores the actual condition of the oil and the operating context of the gearbox. My data show that oil at 200,000 vehicle-km can still be in good condition. This means that a well-designed condition-based maintenance strategy can extend the oil change interval, reduce oil consumption, lower maintenance costs, and reduce environmental impact. At the same time, safety must not be compromised. The thresholds and regression model provide a framework for making informed decisions about pinion gears and the entire gearbox.
For implementation, I recommend the following steps. First, standardize sampling across all depots using the protocol described in this study. Second, use the three-line value thresholds as the primary decision criteria for iron, copper, phosphorus, boron, acid value, and viscosity. Third, use the linear regression model as a trend-monitoring tool. Fourth, review the data periodically to update thresholds as more samples are collected at higher mileages. Fifth, classify routes by operating conditions so that thresholds can be adjusted if necessary. Sixth, train maintenance personnel to recognize the relationship between oil indicators and pinion gear health.
The thresholds should not be treated as fixed forever. As more data become available, especially beyond 200,000 vehicle-km, the regression model can be extended. The current study covers 0–200,000 vehicle-km. Within this range, the degradation is stable and the oil performance is good. The next step is to continue sampling at higher mileages and to refine the full life-cycle degradation model. This will allow the oil change interval to be extended further while ensuring that pinion gears and bearings remain protected.
I also note that additive elements and wear elements should be interpreted together. For example, if iron is low but phosphorus is below the warning threshold, the oil may still be protecting pinion gears under normal conditions, but its reserve for extreme-pressure protection is reduced. If iron begins to rise at the same time, the risk to pinion gears increases. If copper rises, bearing cage wear may be occurring. If acid value rises, corrosion risk increases. If viscosity moves outside the warning range, the oil film may be too thin or too thick, both of which can affect pinion gears. A combined interpretation is more reliable than any single indicator.
9. Full Life-Cycle Degradation Model and Future Work
The linear regression model established in this study is a first step toward a full life-cycle degradation model. Within 0–200,000 vehicle-km, the model shows stable degradation. The oil performance remains good at 200,000 vehicle-km. By continuing the same sampling and analysis method at higher mileages, I can determine thresholds for additional mileage stages. These stages could include 200,000–400,000 vehicle-km, 400,000–600,000 vehicle-km, and beyond. Each stage would have its own warning and abnormal thresholds, and the regression model would be updated accordingly.
The full life-cycle model should consider several factors. First, the operating environment of pinion gears varies with route, load, and speed. Second, the oil formulation may differ between gearbox types. Third, maintenance practices such as top-up and oil change can affect the degradation path. Fourth, the interaction between wear particles and additives can change over time. By incorporating these factors, the model can become more accurate and more useful for condition-based maintenance. The ultimate goal is to ensure safe operation of pinion gears while avoiding unnecessary oil changes.
Table 9 presents a proposed roadmap for extending the threshold calculation to higher mileages. The roadmap is based on the same data-driven principles used in this study.
| Stage | Mileage Range | Data Collection Focus | Threshold Update |
|---|---|---|---|
| Current | 0–200,000 vehicle-km | Baseline degradation of oil and wear of pinion gears | Three-line thresholds and linear regression model |
| Next | 200,000–400,000 vehicle-km | Additive depletion and wear-particle accumulation | Stage-specific thresholds and updated regression slopes |
| Future | 400,000–600,000 vehicle-km | Critical transition detection and pinion gear inspection | Full life-cycle warning and abnormal thresholds |
| Long term | Beyond 600,000 vehicle-km | Remaining useful life estimation for oil and pinion gears | Integrated degradation model for condition-based maintenance |
10. Conclusions
I studied the degradation behavior of metro vehicle gearbox lubricating oil using data from 0–200,000 vehicle-km. I collected 450 samples under strictly controlled sampling conditions and monitored iron, copper, phosphorus, boron, acid value, 40 °C kinematic viscosity, and 100 °C kinematic viscosity. The data were approximately normally distributed, and the three-line value method was more suitable than the maximum entropy method for calculating the full set of thresholds.
The main conclusions are as follows. First, acid value, 40 °C kinematic viscosity, and 100 °C kinematic viscosity can change in both directions, so the three-line value method is more appropriate for calculating their thresholds. Second, the linear regression model of lubricating oil performance degradation becomes more stable as the sample size increases. Iron warning and abnormal thresholds increase steadily with operating mileage. Within 0–200,000 vehicle-km, the degradation is stable. When the oil reaches a critical degradation value, its performance may change sharply, and the deviation from the linear model can serve as an early warning signal. Third, the oil performance at 200,000 vehicle-km is still good, which supports extending the gearbox oil change interval under a condition-based maintenance strategy. The thresholds calculated from the 0–200,000 vehicle-km data can be used as the oil change criteria for this mileage range. Fourth, the same method can be used to determine thresholds at higher operating mileages, eventually producing a full life-cycle degradation model for gearbox lubricating oil and improving the protection of pinion gears.
For pinion gears, the practical benefit of this work is a more precise understanding of when the lubricating oil still provides adequate protection and when it begins to lose that ability. By monitoring wear elements, additive elements, and physicochemical indicators together, I can detect both wear acceleration and additive depletion. This combined approach is more reliable than calendar-based replacement and more protective than relying on a single indicator. The thresholds and regression model provide a foundation for condition-based oil replacement that can reduce cost, reduce waste, and maintain the safe operation of metro vehicle gearboxes and their pinion gears.
In future work, I plan to continue sampling at higher mileages, refine the thresholds for each operating stage, and incorporate route-specific and gearbox-specific factors into the degradation model. I also plan to explore how the combined interpretation of iron, copper, phosphorus, boron, acid value, and viscosity can be used to estimate the remaining useful life of the oil and the health of pinion gears. The ultimate goal is a complete data-driven maintenance framework that uses oil condition as a direct indicator of gearbox health and supports quality-based oil replacement in urban rail transit.