
In the realm of mechanical power transmission, few components are as ubiquitous and critical as gears. Among these, bevel gears hold a position of particular importance in aerospace applications, most notably within helicopter drivetrains. The tail transmission system, responsible for delivering power to the anti-torque rotor, heavily relies on robust and precise bevel gears in intermediate and tail gearboxes. Their ability to transmit high torque at intersecting shafts, typically at a 90-degree angle, with smooth operation is paramount for flight safety and performance. However, the very nature of their operation—subjected to cyclic loading, potential misalignments, and harsh environmental conditions—makes bevel gears susceptible to various failure modes such as pitting, cracking, and tooth breakage. Early and accurate detection of these faults is therefore a cornerstone of modern helicopter Health and Usage Monitoring Systems (HUMS), directly impacting operational safety, maintenance costs, and aircraft availability.
The primary challenge in diagnosing faults in bevel gears, especially within complex assemblies like a helicopter tail gearbox, lies in the signal-to-noise ratio. Vibration sensors are typically mounted on the gearbox casing, not directly on the gear mesh point. This, coupled with the overlapping vibration signatures from bearings, shafts, and other gears, often buries the subtle, early-stage fault signatures within a sea of ambient noise and structural vibrations. Traditional spectral analysis, focusing on gear mesh frequencies and sidebands, is a powerful tool, but its effectiveness can be limited when fault signatures are weak. This has spurred significant research into developing and refining sensitive Health Condition Indicators (CIs) that can amplify and quantify changes in the vibration signal corresponding to specific gear pathologies.
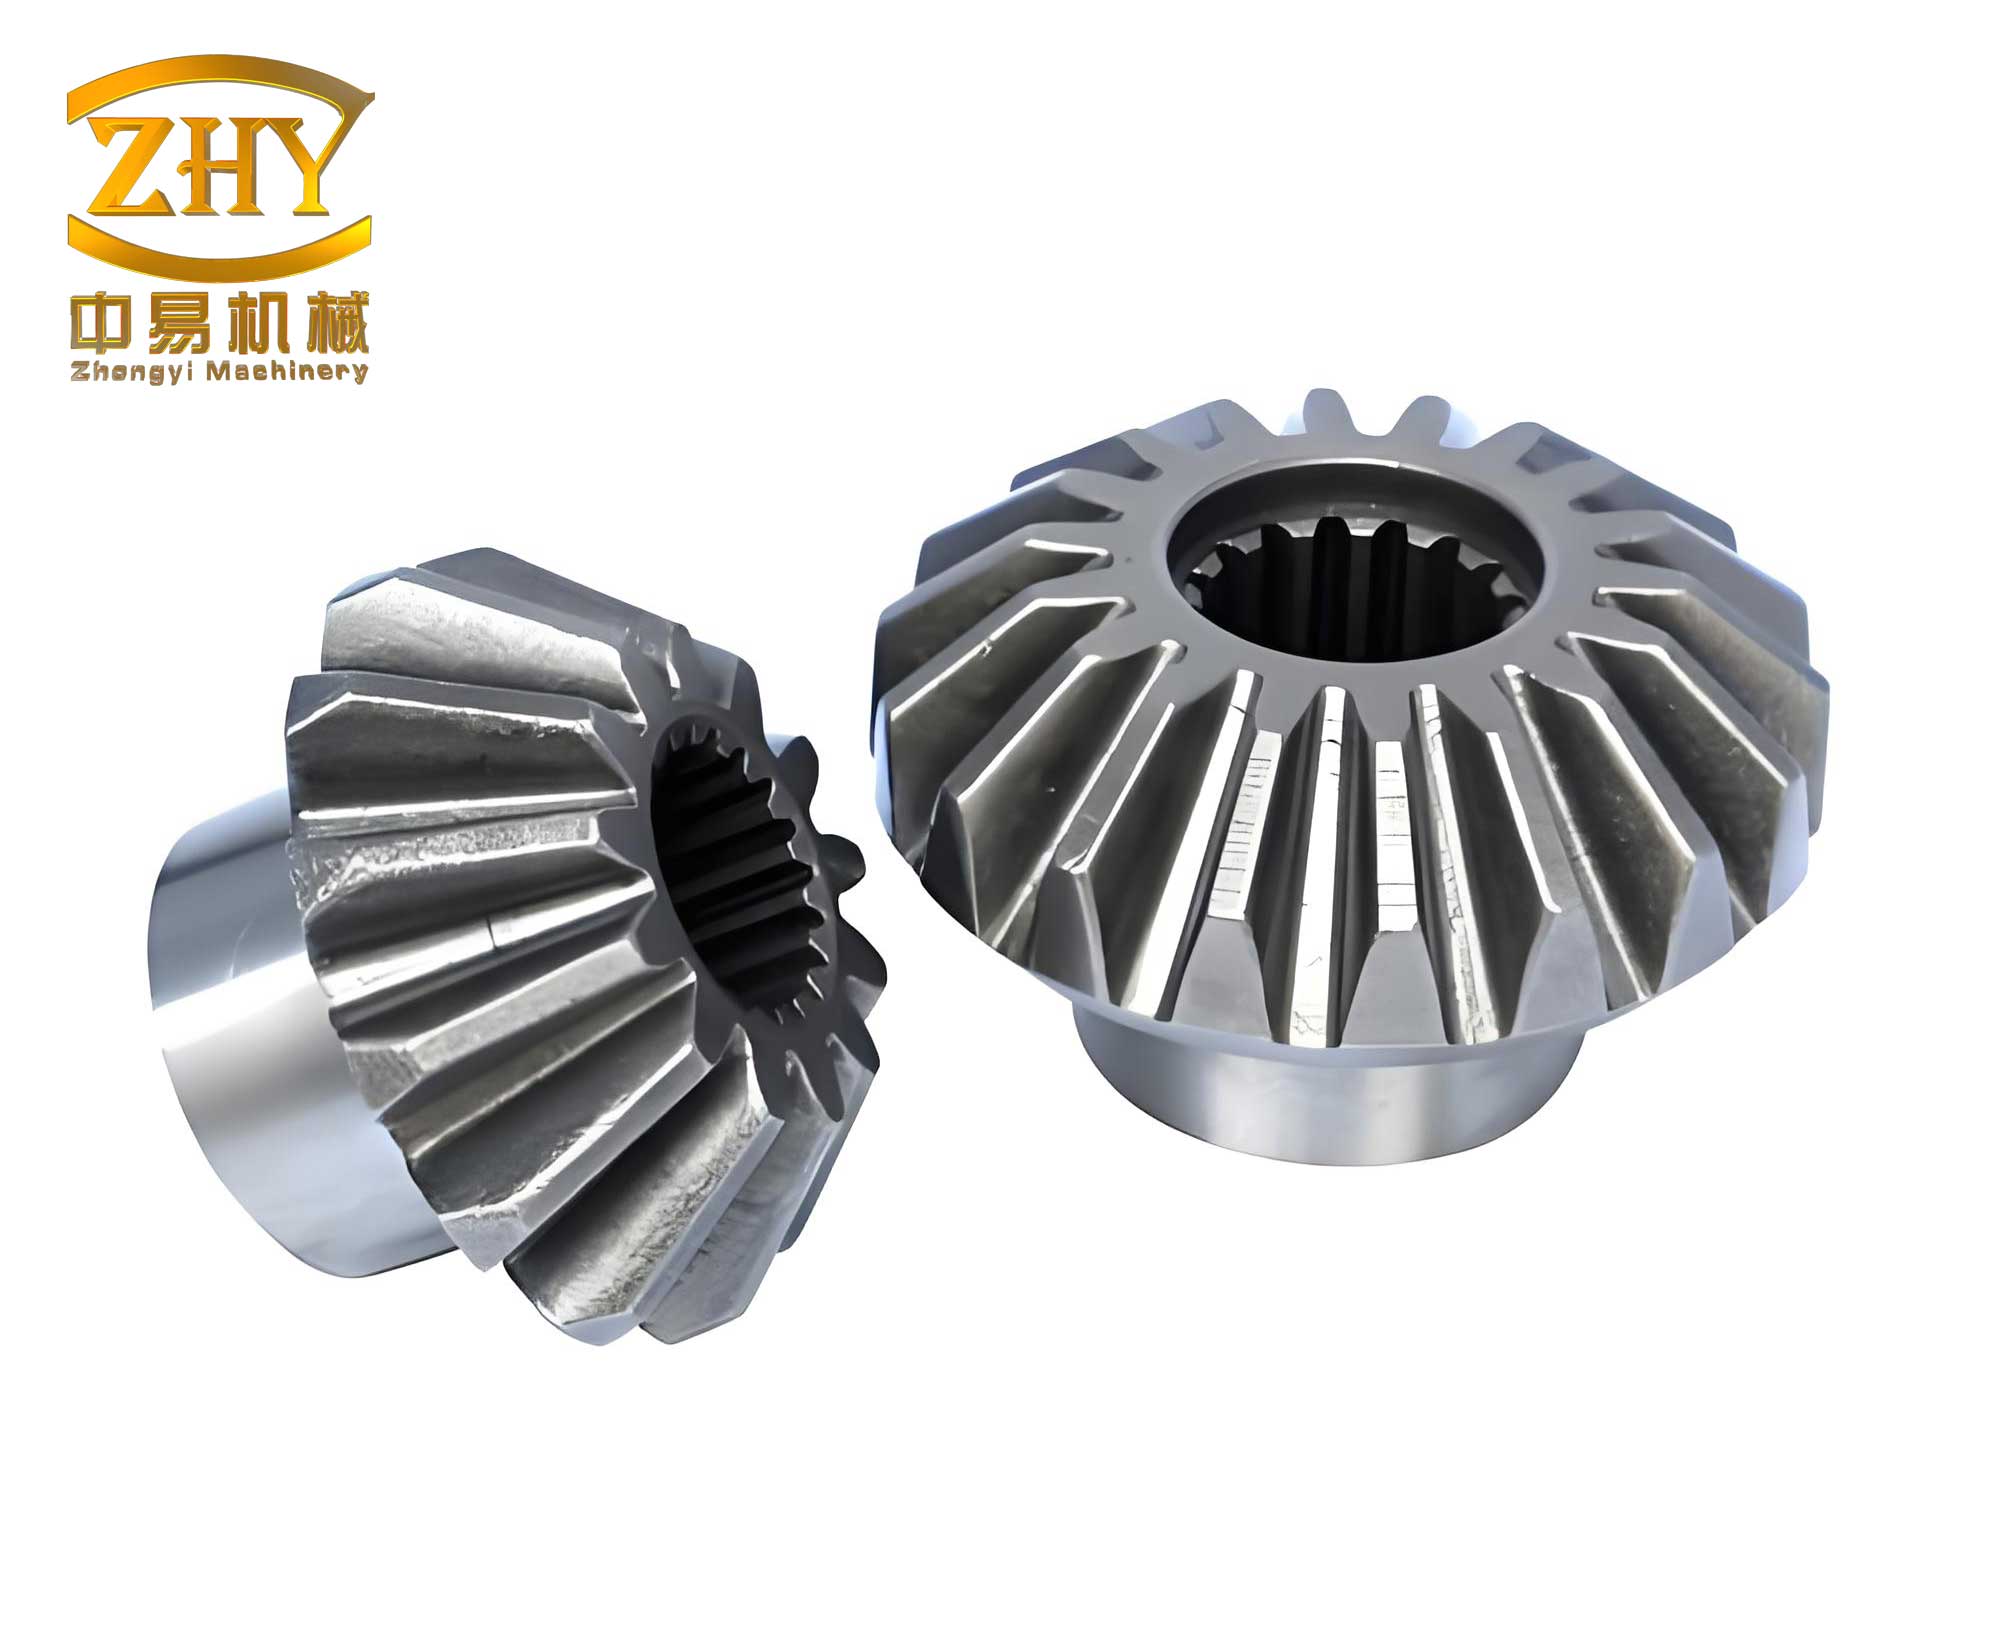
This work presents a comprehensive methodology for the health state assessment of helicopter tail transmission bevel gears by synergistically combining a robust signal pre-processing technique with a suite of multi-feature condition indicators. The core premise is that different failure modes manifest through distinct alterations in the vibration signal’s statistical and morphological properties. Consequently, no single indicator is universally superior; a pitting fault might be best detected by one metric, while a crack might be more evident in another. Our approach begins with Time Synchronous Averaging (TSA), a pre-processing step crucial for isolating the vibration component synchronous with the gear of interest from extraneous noise. Subsequently, a battery of established condition indicators is computed from the refined signal. Through controlled fault-seeded testing on a representative bevel gear pair, we empirically determine the sensitivity profile of each indicator to specific fault types. The ultimate goal is to establish a reliable diagnostic framework where the collective response of multiple indicators provides a robust and unambiguous assessment of the gear’s health.
Signal Pre-Processing: Time Synchronous Averaging (TSA)
The effectiveness of any condition indicator is predicated on the quality of the input signal. Raw vibration data from a gearbox is a composite signal. To extract the signal component purely related to the rotation of a specific gear, we employ Time Synchronous Averaging (TSA). This technique is a noise-rejection method that enhances periodic waveforms buried in noise by coherently averaging signal segments aligned with a reference trigger, typically once per revolution of the target component.
Mathematically, consider a discrete vibration signal sequence \( x_n = x(n\Delta) \), where \( \Delta \) is the sampling interval. The rotational frequency of the target bevel gear is \( f_0 \), corresponding to a period \( T = 1/f_0 \). If the signal is divided into \( p \) contiguous segments, each spanning exactly one period \( T \) (or an integer number of periods), and each segment contains \( N \) data points (achieved via resampling if necessary), then the TSA signal \( \bar{x}_n \) is given by:
$$ \bar{x}_n = \frac{1}{p} \sum_{k=0}^{p-1} x_{n + kN} $$
where \( n = 0, 1, …, N-1 \).
The underlying principle is that the vibration components synchronous with the reference trigger (e.g., the meshing of the target gear) will add up coherently across averages, amplifying their amplitude linearly with the number of averages \( p \). In contrast, non-synchronous components, such as random noise or vibrations from other shafts operating at different speeds, will tend to cancel out, as their phase relative to the trigger is random. The process effectively acts as a comb filter, passing frequencies at the trigger rate and its harmonics while attenuating others. For bevel gear diagnosis, applying TSA using a tachometer signal from the gear’s shaft dramatically improves the signal-to-noise ratio, providing a much clearer representation of the gear’s meshing vibration, which is the primary carrier of fault information. The figure below conceptually illustrates the TSA process, showing how the periodic signal emerges from the noisy background as averaging progresses.
Health Condition Indicators (CIs)
Once a clean, gear-synchronous signal is obtained via TSA, it is analyzed using a set of condition indicators. These indicators are mathematical functions that compute specific statistical or spectral features from the vibration signal. Their values are tracked over time, and deviations from a healthy baseline are interpreted as signs of deterioration. The following indicators, prominent in gear diagnostics literature, form the core of our multi-feature analysis for bevel gears.
| Indicator Name | Formula | Primary Sensitivity / Rationale |
|---|---|---|
| Root Mean Square (RMS) | $$ \text{RMS} = \sqrt{ \frac{1}{N} \sum_{i=1}^{N} x(i)^2 } $$ | Overall vibration energy. Increases with general wear, severe pitting, or gross faults. |
| FM4 (Fourth-Order Moment of Residual) | $$ \text{FM4} = \frac{ \frac{1}{N} \sum_{i=1}^{N} (d_i – \bar{d})^4 }{ \left( \frac{1}{N} \sum_{i=1}^{N} (d_i – \bar{d})^2 \right)^2 } $$ where \( d_i \) is the differenced signal \( x(i) – x(i-1) \). |
Kurtosis of the differenced signal. Sensitive to impulsive events (e.g., tooth breakage). A healthy signal tends toward Gaussian kurtosis (~3). Faults create peaks, raising FM4. |
| M6A (Sixth-Order Normalized Moment) | $$ \text{M6A} = \frac{ N^2 \sum_{i=1}^{N} (d_i – \bar{d})^6 }{ \left( \sum_{i=1}^{N} (d_i – \bar{d})^2 \right)^3 } $$ | Higher-order moment of the differenced signal. More sensitive to distributed surface faults like pitting/spalling than FM4. |
| M8A (Eighth-Order Normalized Moment) | $$ \text{M8A} = \frac{ N^3 \sum_{i=1}^{N} (d_i – \bar{d})^8 }{ \left( \sum_{i=1}^{N} (d_i – \bar{d})^2 \right)^4 } $$ | Even higher-order moment. Provides potentially greater sensitivity to incipient surface damage than M6A. |
| DA1 (Demodulated Analysis 1st Order) | $$ \text{DA1} = \text{RMS}( \text{TSA} – \text{mean}(\text{TSA}) ) $$ | Energy of the TSA signal after removing its DC mean. Sensitive to the growth of sideband energy around mesh harmonics, often indicative of distributed faults like cracks or eccentricity. |
Sensitivity Analysis Through Fault-Seeded Testing
Experimental Design
To rigorously evaluate the sensitivity of the proposed indicators to specific faults in bevel gears, a controlled fault-seeded test was conducted. The test rig replicated a 90-degree intersection tail drive system section. The central test articles were a pair of spiral bevel gears: a driving pinion with 31 teeth and a driven gear with 28 teeth. The driven gear was the component subjected to seeded faults.
The test matrix was designed to cover multiple fault types and severities under varying load conditions, as detailed in the table below. For each configuration, vibration data was acquired from an accelerometer mounted on the gearbox casing near the output bearing. A tachometer provided the necessary once-per-revolution signal for TSA processing.
| Fault Type | Severity Level | Description |
|---|---|---|
| Healthy Baseline | N/A | Undamaged gear. |
| Root Crack | Level 1 | Crack length: 20mm, depth: 25% of tooth thickness. |
| Level 2 | Crack length: 20mm, depth: 50% of tooth thickness. | |
| Surface Pitting | Level 1 | Area: ~5% of tooth face, shallow depth. |
| Level 2 | Area: ~10% of tooth face, moderate depth. | |
| Tooth Breakage | Level 1 | Partial break, ~1/4 of tooth missing. |
| Level 2 | Severe break, ~1/2 of tooth missing. |
Data Analysis Procedure
For each test condition (fault type/severity and load), one minute of steady-state vibration data was analyzed. The procedure was as follows:
- Signal Segmentation & TSA: The raw signal was resampled to obtain 256 points per revolution of the driven bevel gear. Consecutive blocks of 30 revolutions were synchronously averaged using the tachometer signal, producing one TSA waveform per block. This resulted in approximately 10 independent TSA waveforms for each test condition.
- Indicator Calculation: For each of the 10 TSA waveforms, the five condition indicators (RMS, FM4, M6A, M8A, DA1) were calculated. The differenced signal \( d_i \) required for FM4, M6A, and M8A was derived from the TSA waveform.
- Sensitivity Assessment: The distribution of each indicator’s value across its 10 samples was compared across different fault states and the healthy baseline. An indicator was deemed sensitive to a particular fault if its value distribution for that fault state showed clear separation from the distribution of the healthy state, with minimal overlap.
Results and Findings
The analysis of the fault-seeded test data yielded distinct sensitivity profiles for each condition indicator when applied to bevel gears.
1. Root Mean Square (RMS): The RMS indicator showed a pronounced sensitivity to crack faults. The value distributions for both Level 1 and Level 2 crack conditions were significantly higher and showed almost no overlap with the healthy baseline distribution. For pitting and breakage faults, the RMS values increased but with considerable overlap with the healthy range, making it less reliable for early detection of these faults alone. The sensitivity increased with crack depth and applied load.
2. FM4 Indicator: The FM4 metric demonstrated high sensitivity to tooth breakage faults. The impulsive nature of the meshing impact when a broken tooth engages causes large peaks in the differenced signal, sharply increasing its kurtosis (FM4 value). The distributions for broken tooth conditions were markedly elevated compared to the healthy, pitting, and crack conditions. It showed relatively low sensitivity to distributed faults like pitting and cracks.
3. M6A & M8A Indicators: Both higher-order moment indicators, M6A and M8A, exhibited excellent sensitivity to surface pitting faults. The distributed, rough surface generated by pitting creates a non-Gaussian amplitude distribution in the differenced signal with heavier tails, which is effectively captured by these higher-order statistics. Their value distributions for pitting faults were distinctly higher than for healthy, cracked, or broken teeth. M8A often showed marginally greater separation than M6A, as expected from its higher order.
4. DA1 Indicator: The DA1 indicator, representing the energy of the oscillatory part of the TSA signal, proved to be sensitive to crack faults, similar to RMS. A developing crack can induce slight modulation in the mesh vibration, increasing the energy in the sidebands, which is reflected in the DA1 value. Its response to pitting and breakage was less consistent and pronounced.
The following table synthesizes the primary sensitivity findings for bevel gear fault diagnosis:
| Target Fault Mode | Most Sensitive Indicator(s) | Supporting Indicator(s) |
|---|---|---|
| Surface Pitting/Spalling | M6A, M8A | – |
| Root Crack | RMS, DA1 | – |
| Tooth Breakage | FM4 | RMS (for severe breaks) |
Validation via “Blind” Test Data Analysis
To validate the practical utility of the established sensitivity profiles, the methodology was applied to a set of “blind” test data—vibration data from a test condition whose fault state was unknown to the analysis algorithm beforehand. The process involved:
- Processing the blind data through the identical TSA and indicator calculation pipeline.
- Comparing the computed indicator values (RMS, FM4, M6A, M8A, DA1) against the normative ranges established from the known healthy baseline data.
- Diagnosing the fault based on which indicators showed significant deviation according to the sensitivity table.
For the provided blind dataset, the analysis revealed a clear pattern: the values for M6A, M8A, and FM4 fell within the range expected for a healthy gear. However, the RMS and DA1 values were significantly elevated, well outside the healthy baseline distribution. According to the determined sensitivity profiles—where RMS and DA1 are primary indicators for crack faults—the diagnosis pointed conclusively towards a crack fault in the bevel gear. This diagnosis was later confirmed to be correct, validating the effectiveness of the multi-indicator approach. The synergistic use of multiple indicators prevented a misdiagnosis; if only FM4 (sensitive to breakage) was monitored, the gear would have been considered healthy, while monitoring RMS and DA1 correctly flagged an abnormality consistent with a crack.
Conclusion
The health assessment of helicopter bevel gears demands a sophisticated approach that can discern between different incipient failure modes in a noisy operational environment. This work demonstrates that a methodology combining Time Synchronous Averaging for signal enhancement with a multi-feature indicator analysis provides a robust solution. TSA effectively isolates the vibration signature of the target gear, providing a clean signal for precise feature extraction.
The core finding is that different condition indicators possess distinct and complementary sensitivity profiles for common bevel gear faults. No single indicator is a panacea. Specifically, surface-initiated faults like pitting are most reliably detected by higher-order statistical moments of the differenced signal (M6A, M8A). Faults that modulate the meshing vibration or increase overall energy, such as root cracks, are prominently flagged by RMS and DA1 indicators. Discrete, impulsive events like tooth breakage are uniquely captured by the kurtosis-based FM4 indicator.
Therefore, a comprehensive health monitoring strategy for critical bevel gears should implement a suite of these indicators in parallel. Tracking the collective trajectory of RMS, DA1, FM4, M6A, and M8A over time provides a multidimensional health signature. Deviations in specific subsets of these indicators, interpreted through their known sensitivity profiles, allow for not only the detection of a fault but also a preliminary classification of its likely type (pitting, crack, or breakage). This capability, validated through controlled fault-seeded testing and blind data analysis, forms a solid foundation for developing more intelligent, prognostic health management systems for helicopter drivetrains, ultimately enhancing safety and operational efficiency.