
In this study, I focus on the casting forming design and optimization of a herringbone face gear. A face gear transmission offers a compact structure, smooth operation, and good interchangeability, making it a key component for intersecting-axis power transmission. Compared with traditional spiral bevel gears, the herringbone face gear provides higher load capacity, a more compact layout, and better tolerance to assembly errors. However, the geometric complexity of the herringbone face gear makes conventional machining inefficient and costly. To overcome these manufacturing difficulties, I adopt lost foam casting as the primary forming method and systematically investigate the tooth surface generation, gating system design, numerical simulation, parameter optimization, and experimental verification. The entire work is summarized in the following sections.
Tooth Surface Derivation and Modification of the Herringbone Face Gear
I begin by establishing the mathematical model of the herringbone face gear based on spatial meshing theory. The relative position and orientation of the gear pair in space are analyzed through coordinate transformation, and the parametric expression of the herringbone tooth surface is derived. To address local stress concentration on the tooth surface, I adopt an active topology modification strategy. The influence of different modification parameters on stress distribution is systematically analyzed, and the geometric structure model of the herringbone face gear is finally established.
For the coordinate transformation, I define several reference systems. The transformation matrices are expressed as follows:
$$
M_{10,1} = \begin{bmatrix}
\cos \xi_1 & -\sin \xi_1 & 0 & 0 \\
\sin \xi_1 & \cos \xi_1 & 0 & 0 \\
0 & 0 & 1 & 0 \\
0 & 0 & 0 & 1
\end{bmatrix}
$$
$$
M_{20,10} = \begin{bmatrix}
0 & 0 & 1 & L_0 \\
0 & 1 & 0 & 0 \\
1 & 0 & 0 & 0 \\
0 & 0 & 0 & 1
\end{bmatrix}
$$
$$
M_{2,20} = \begin{bmatrix}
\cos \xi_2 & \sin \xi_2 & 0 & 0 \\
-\sin \xi_2 & \cos \xi_2 & 0 & 0 \\
0 & 0 & 1 & 0 \\
0 & 0 & 0 & 1
\end{bmatrix}
$$
The combined transformation matrix from the pinion coordinate system to the face gear coordinate system is:
$$
M_{2,1} = M_{2,20} M_{20,10} M_{10,1}
$$
The pinion involute tooth surface is described by the following parametric equations:
$$
\begin{cases}
x_1 = r_{bs} \left[ \cos(\theta_1 + \eta_1) + \theta_1 \sin(\theta_1 + \eta_1) \right] \\
y_1 = r_{bs} \left[ \sin(\theta_1 + \eta_1) – \theta_1 \cos(\theta_1 + \eta_1) \right] \\
z_1 = 0
\end{cases}
$$
where \(r_{bs}\) is the base circle radius, \(\eta_1\) is the angle parameter at the intersection of the involute and the base circle, and \(\theta_1\) is the position parameter on the tooth surface. The upper and lower signs correspond to the inner and outer regions of the pinion tooth surface.
After considering the helical motion of the pinion, the tooth surface parameters \(r_{ot}\) and \(r_{it}\) are expressed as:
$$
\begin{cases}
x_{1ot} = r_{bs} \left[ \cos(\theta_1 + \eta_1 + \lambda_1) + \theta_1 \sin(\theta_1 + \eta_1 + \lambda_1) \right] \\
y_{1ot} = r_{bs} \left[ \sin(\theta_1 + \eta_1 + \lambda_1) – \theta_1 \cos(\theta_1 + \eta_1 + \lambda_1) \right] \\
z_{1ot} = p_1 \lambda_1
\end{cases}
$$
$$
\begin{cases}
x_{1it} = r_{bs} \left[ \cos(\theta_1 + \eta_1 – \lambda_1) + \theta_1 \sin(\theta_1 + \eta_1 – \lambda_1) \right] \\
y_{1it} = r_{bs} \left[ \sin(\theta_1 + \eta_1 – \lambda_1) – \theta_1 \cos(\theta_1 + \eta_1 – \lambda_1) \right] \\
z_{1it} = p_1 \lambda_1
\end{cases}
$$
The meshing equation for the face gear pair is given by:
$$
n_1 \cdot v_1^{(12)} = 0
$$
where \(n_1\) is the normal vector on the pinion tooth surface, and \(v_1^{(12)}\) is the relative velocity between the pinion and the face gear in the pinion coordinate system. The relative velocity components are:
$$
\begin{cases}
v_{1x}^{(12)} = y_1 – i_{21} z_1 \sin \varphi_1 – L_0 i_{21} \sin \varphi_1 \\
v_{1y}^{(12)} = -x_1 – i_{21} z_1 \cos \varphi_1 – L_0 i_{21} \cos \varphi_1 \\
v_{1z}^{(12)} = i_{21} x_1 \sin \varphi_1 + i_{21} y_1 \cos \varphi_1
\end{cases}
$$
The unit normal vector of the pinion tooth surface is expressed as:
$$
n_1 = \begin{bmatrix}
n_{1x} \\
n_{1y} \\
n_{1z}
\end{bmatrix} = \begin{bmatrix}
\cos \beta_b \sin \alpha \\
\cos \beta_b \cos \alpha \\
-\sin \beta_b
\end{bmatrix}
$$
Substituting the velocity and normal vector into the meshing equation yields the meshing relation \(f(\theta_1, \lambda_1, \varphi_1) = 0\). The face gear tooth surface is then obtained by mapping the pinion surface family through the coordinate transformation matrix:
$$
\begin{cases}
f(\theta_1, \lambda_1, \varphi_1) = 0 \\
r_2(\theta_1, \lambda_1, \varphi_1) = M_{2,1}(\varphi_1) r_1(\theta_1, \lambda_1)
\end{cases}
$$
For the modification, I use a parabolic modification curve along the preset contact path. The modification amount is calculated as \(m = a d_i^2\), where \(d_i\) is the perpendicular distance from each tooth surface point to the projection line of the contact trace. I select \(a = 0.8\) and a modification amount of \(m = 0.8\,\mu\text{m}\). The modified tooth surface coordinates are obtained by subtracting the modification amount from the original \(x_1\) coordinate while keeping \(y_1\) and \(z_1\) unchanged.
I build the modified herringbone face gear model in UG and perform finite element contact analysis in ABAQUS. A five-tooth sector model is used to improve computational efficiency. The maximum contact stress before and after modification is compared. The modification range is set from 0.5 mm to 0.9 mm. The results show that an edge contact problem exists before modification, with stress concentrated at the tooth ends. After modification, the contact trace moves toward the central meshing area, and the maximum contact stress is reduced by 44% compared with the unmodified case. The optimal modification amount is 0.8 mm.
| Modification amount (mm) | Maximum contact stress (MPa) | Observation |
|---|---|---|
| 0.5 | 235 | Contact trace close to preset path; right side still has stress concentration |
| 0.6 | 210 | Stress concentration moves downward; right side still has concentration |
| 0.7 | 180 | Stress concentration area reduced; right side improved |
| 0.8 | 96 | Best result; almost no stress concentration at tooth tip |
| 0.9 | 150 | Stress concentration reappears near tooth tip |
The unmodified maximum contact stress is 235 MPa, and the modified optimal maximum contact stress is 96 MPa. This confirms that the active topology modification effectively mitigates edge contact and improves the load distribution of the herringbone face gear.
Casting Process Design for the Herringbone Face Gear
Based on the geometric structure of the herringbone face gear, I analyze the casting performance and select the appropriate material and process. The gear casting has a weight of 35.2 kg, an outer diameter of 680 mm, an inner diameter of 470 mm, a tooth height of 24.63 mm, a tooth width of 10 mm, and a base thickness of 15 mm. The material selected is ZG30Cr1MnSi1, a cast steel with good strength, toughness, and wear resistance. The chemical composition is listed in the following table.
| Element | C | Si | Mn | Cr | P | S |
|---|---|---|---|---|---|---|
| Content (%) | 0.27–0.34 | 0.40–0.70 | 0.90–1.20 | 0.50–0.80 | ≤0.035 | ≤0.035 |
I choose lost foam casting because it is suitable for complex thin-walled parts and provides near-net shape. The process flow includes pattern preparation, coating, sand filling, vibration compaction, negative pressure application, and pouring. The pattern material is a combination of EPS and STMMA to reduce casting defects. The coating must have good permeability, high-temperature resistance, and sufficient strength. The sand used is artificial ceramic sand, which has low thermal expansion and good chemical stability. A double-layer sand box is selected to ensure uniform vacuum distribution.
For the gating system, I design both top pouring and bottom pouring schemes. The gating system is designed as a closed system to facilitate post-processing. The choke area is calculated using the following equation:
$$
S_{\text{choke}} = \frac{G_L}{0.31 \mu t \sqrt{H_P}}
$$
where \(G_L\) is the total mass of liquid metal, \(\mu\) is the flow coefficient, \(t\) is the pouring time, and \(H_P\) is the average static pressure head. The total mass is \(G_L = 41.4\) kg. The flow coefficient is corrected to \(\mu = 0.35\). The pouring time is calculated as:
$$
t = K_t \sqrt{G_L} + \sqrt[3]{G_L}
$$
with \(K_t = 0.85\). The average pressure head is:
$$
H_P = h_{\text{inner}} – \frac{p^2}{2C}
$$
For the bottom pouring scheme, the sprue height is 410 mm, and the cross-sectional area ratio is set as \(A_{\text{sprue}} : A_{\text{runner}} : A_{\text{ingate}} = 1 : 1.5 : 1.2\). The calculated areas are: sprue area \(A_{\text{sprue}} = 10.6\,\text{cm}^2\), runner area \(A_{\text{runner}} = 5.3\,\text{cm}^2\), and ingate area \(A_{\text{ingate}} = 3.6\,\text{cm}^2\). The actual dimensions are: sprue radius 18 mm, runner cross-section \(5.3 \times 2.0\) mm, and ingate radius 10.6 mm. The gating system parameters are summarized in the table below.
| Component | Calculated area (cm²) | Actual shape | Actual dimension |
|---|---|---|---|
| Sprue | 10.6 | Circular | r = 18 mm |
| Runner | 5.3 | Rectangular | 5.3 mm × 2.0 mm |
| Ingate | 3.6 | Circular | r = 10.6 mm |
I design two pouring schemes: top pouring and bottom pouring. The bottom pouring scheme has the ingate at the bottom of the casting, allowing the metal to flow upward and gas to escape in the same direction. This promotes stable filling and reduces slag inclusion. The top pouring scheme has the ingate at the top, which may cause turbulence and gas entrapment. No riser is initially designed because the sprue itself can provide feeding for the gear disk. The three-dimensional models of the two schemes are built in UG.
Numerical Simulation and Parameter Optimization of Lost Foam Casting
I use ProCAST to simulate the filling and solidification processes. The governing equations include the continuity equation, the Navier–Stokes equations, and the energy equation. The continuity equation is:
$$
\frac{\partial \rho}{\partial t} + \nabla \cdot (\rho \mathbf{V}) = 0
$$
For incompressible fluid, it reduces to:
$$
\frac{\partial u}{\partial x} + \frac{\partial v}{\partial y} + \frac{\partial w}{\partial z} = 0
$$
The energy equation is:
$$
\rho c_p \frac{\partial T}{\partial t} + \rho c_p u \frac{\partial T}{\partial x} + \rho c_p v \frac{\partial T}{\partial y} + \rho c_p w \frac{\partial T}{\partial z} = \lambda \nabla^2 T + Q
$$
The solidification process is governed by the Fourier heat conduction equation:
$$
\rho c_p \frac{\partial T}{\partial t} = \frac{\partial}{\partial x} \left( \lambda \frac{\partial T}{\partial x} \right) + \frac{\partial}{\partial y} \left( \lambda \frac{\partial T}{\partial y} \right) + \frac{\partial}{\partial z} \left( \lambda \frac{\partial T}{\partial z} \right) + Q
$$
where \(Q = \rho L \frac{\partial f_s}{\partial t}\). The Niyama criterion is used to predict shrinkage porosity:
$$
\frac{G}{\sqrt{v_c}} < C_N
$$
where \(G\) is the local temperature gradient, \(v_c\) is the cooling rate, and \(C_N\) is the critical value.
The mesh is generated with a surface mesh size of 7 mm. The number of surface mesh elements is 698,326, and the total number of volume mesh elements is 3,253,682. The pouring temperature is set to 1600 °C initially, and the sand box temperature is 20 °C. The gravity direction is along the negative z-axis. The interface heat transfer coefficients are set according to the software defaults.
For the bottom pouring scheme, the filling process is stable. At t = 2.8 s, the metal enters the sprue. At t = 4.6 s, the runner is filled. At t = 7.9 s, the bottom of the gear is filled. At t = 10 s, the entire cavity is filled. The filling speed shows a “slow–fast–slow” trend. For the top pouring scheme, the filling process is less stable. At t = 4.6 s, the runner is not filled simultaneously. At t = 7.9 s, some regions are still unfilled. At t = 10 s, the filling is complete, but the temperature drop is more significant. The top pouring scheme results in a higher risk of cold shuts and misruns.
The solidification process for the bottom pouring scheme shows that the gear starts to solidify at t = 177 s. At t = 337 s, the temperature is about 1283 °C, and the solidification front moves toward the center. At t = 995 s, the outer surface solid fraction reaches 70%. At t = 2153 s, most of the casting is solidified. The temperature field shows a sequential solidification pattern. For the top pouring scheme, the solidification is similar, but the feeding ability is weaker because the ingate is not located at the hot spot. The shrinkage porosity distribution shows that the top pouring scheme has a defect volume of 19.25%, while the bottom pouring scheme has a lower defect volume. Therefore, I select the bottom pouring scheme for further optimization.
I then perform single-factor experiments to determine the influence of negative pressure, pouring speed, pouring temperature, and pattern density on shrinkage porosity. The results are shown in the following tables.
| Negative pressure (MPa) | Shrinkage porosity (%) |
|---|---|
| 0.035 | 9.80 |
| 0.040 | 8.30 |
| 0.045 | 9.10 |
| 0.050 | 10.20 |
| 0.055 | 11.50 |
| Pouring speed (s) | Shrinkage porosity (%) |
|---|---|
| 12.0 | 11.20 |
| 12.5 | 9.50 |
| 13.0 | 8.62 |
| 13.5 | 9.10 |
| 14.0 | 10.30 |
| Pouring temperature (°C) | Shrinkage porosity (%) |
|---|---|
| 1520 | 11.80 |
| 1550 | 10.20 |
| 1600 | 9.12 |
| 1620 | 9.80 |
| 1640 | 10.50 |
| Pattern density (kg/cm³) | Shrinkage porosity (%) |
|---|---|
| 18 | 8.90 |
| 19 | 7.50 |
| 20 | 6.11 |
| 21 | 7.20 |
| 22 | 8.60 |
The single-factor experiments show that the optimal negative pressure is 0.04 MPa, the optimal pouring speed is 13 s, the optimal pouring temperature is 1600 °C, and the optimal pattern density is 20 kg/cm³. Since pattern density has a relatively small effect, I fix it at 20 kg/cm³ and focus on the other three parameters for response surface optimization.
I use the Box–Behnken design in Design-Expert 13. The factors are pouring temperature (A), filling speed (B), and negative pressure (C). The factor levels are given in the table below.
| Factor | Level -1 | Level 0 | Level +1 |
|---|---|---|---|
| A: Pouring temperature (°C) | 1550 | 1575 | 1600 |
| B: Filling speed (s) | 12.5 | 13.0 | 13.5 |
| C: Negative pressure (MPa) | 0.04 | 0.045 | 0.05 |
The response surface experiments and results are shown in the following table.
| Run | A (°C) | B (s) | C (MPa) | Shrinkage porosity (%) |
|---|---|---|---|---|
| 1 | 1550 | 12.5 | 0.045 | 8.22 |
| 2 | 1600 | 12.5 | 0.045 | 7.51 |
| 3 | 1550 | 13.5 | 0.045 | 6.07 |
| 4 | 1600 | 13.5 | 0.045 | 6.79 |
| 5 | 1550 | 13 | 0.04 | 7.83 |
| 6 | 1600 | 13 | 0.04 | 6.41 |
| 7 | 1550 | 13 | 0.05 | 6.23 |
| 8 | 1600 | 13 | 0.05 | 8.67 |
| 9 | 1575 | 12.5 | 0.04 | 8.40 |
| 10 | 1575 | 13.5 | 0.04 | 6.11 |
| 11 | 1575 | 12.5 | 0.05 | 8.61 |
| 12 | 1575 | 13.5 | 0.05 | 7.10 |
| 13 | 1575 | 13 | 0.045 | 10.11 |
| 14 | 1575 | 13 | 0.045 | 10.03 |
| 15 | 1575 | 13 | 0.045 | 10.42 |
| 16 | 1575 | 13 | 0.045 | 9.31 |
| 17 | 1575 | 13 | 0.045 | 10.11 |
The regression model for shrinkage porosity is obtained as follows:
$$
Y = 9.07 + 0.1262A – 0.8237B + 0.2275C + 0.3775AB + 0.9750AC + 0.1650BC – 1.58A^2 – 1.35B^2 – 1.20C^2
$$
The analysis of variance shows that the model is significant, with an F-value of 57.88 and a P-value less than 0.0001. The lack-of-fit P-value is 0.2324, which is not significant. The coefficient of determination \(R^2\) is 0.9867, and the adjusted \(R^2\) is 0.9697. The predicted \(R^2\) is 0.8604. The coefficient of variation is 3.77%. The ANOVA table is presented below.
| Source | Sum of squares | df | Mean square | F-value | P-value |
|---|---|---|---|---|---|
| Model | 37.60 | 9 | 4.18 | 57.88 | <0.0001 |
| A | 0.1275 | 1 | 0.1275 | 1.77 | 0.0255 |
| B | 5.43 | 1 | 5.43 | 75.21 | <0.0001 |
| C | 0.4141 | 1 | 0.4141 | 5.74 | 0.0478 |
| AB | 0.5700 | 1 | 0.5700 | 7.90 | 0.0261 |
| AC | 3.80 | 1 | 3.80 | 52.68 | 0.0002 |
| BC | 0.1089 | 1 | 0.1089 | 1.51 | 0.2590 |
| A² | 10.57 | 1 | 10.57 | 146.50 | <0.0001 |
| B² | 7.73 | 1 | 7.73 | 107.06 | <0.0001 |
| C² | 6.04 | 1 | 6.04 | 83.62 | <0.0001 |
| Residual | 0.5053 | 7 | 0.0722 | ||
| Lack of fit | 0.3138 | 3 | 0.1046 | 2.18 | 0.2324 |
| Pure error | 0.1915 | 4 | 0.0479 | ||
| Total | 38.10 | 16 |
The interaction effects are analyzed through contour plots and response surface curves. The interaction between pouring temperature and negative pressure is the most significant, followed by pouring temperature and filling speed, and then filling speed and negative pressure. The optimal parameters obtained by the optimization algorithm are: pouring temperature 1600 °C, filling speed 13 s, and negative pressure 0.04 MPa. Three verification simulations are performed under these parameters, and the shrinkage porosities are 5.12%, 5.07%, and 5.03%. The independent sample t-test shows no significant difference between the predicted and verified values (p ≥ 0.05). The optimized filling and solidification processes show stable filling and a significant reduction in shrinkage porosity. The defect distribution after optimization shows that the shrinkage cavities are mainly located in the runner, and the gear body is almost free of defects.
Experimental Verification of the Herringbone Face Gear
I use UG to plan the CNC machining path for the lost foam white pattern. A foam-specific ball-end milling cutter is selected. The tool material is 20Cr or T10, with a hardness of about 50 HRC. The spindle speed is 2500 rpm, the feed rate is 3000 mm/min, the cutting depth is 2 mm, and the cutting mode is reciprocating. The machining coordinate system and workpiece coordinate system are set up. The safety height is 10 mm above the highest surface of the gear. The inner gear disk, outer gear ring, and tooth surface are machined in sequence. The tooth surface finishing uses a depth contour milling strategy with an R1 ball-end milling cutter.
The white pattern is coated with a water-based coating. The coating is applied three times to ensure uniform thickness. The pattern is dried in a drying room at 45–50 °C and a humidity below 10%. The first drying takes about 6 hours, and the second drying takes at least 24 hours. The pattern is placed in a sand box, and the casting system is assembled. The molten metal is poured into the sprue cup. The pouring follows a slow–fast–slow rhythm. After pouring, pressure is maintained for a period to ensure feeding. The casting is cooled naturally and then removed from the sand. The appearance of the casting is complete, and no sand inclusion, carbon segregation, or insufficient filling is observed.
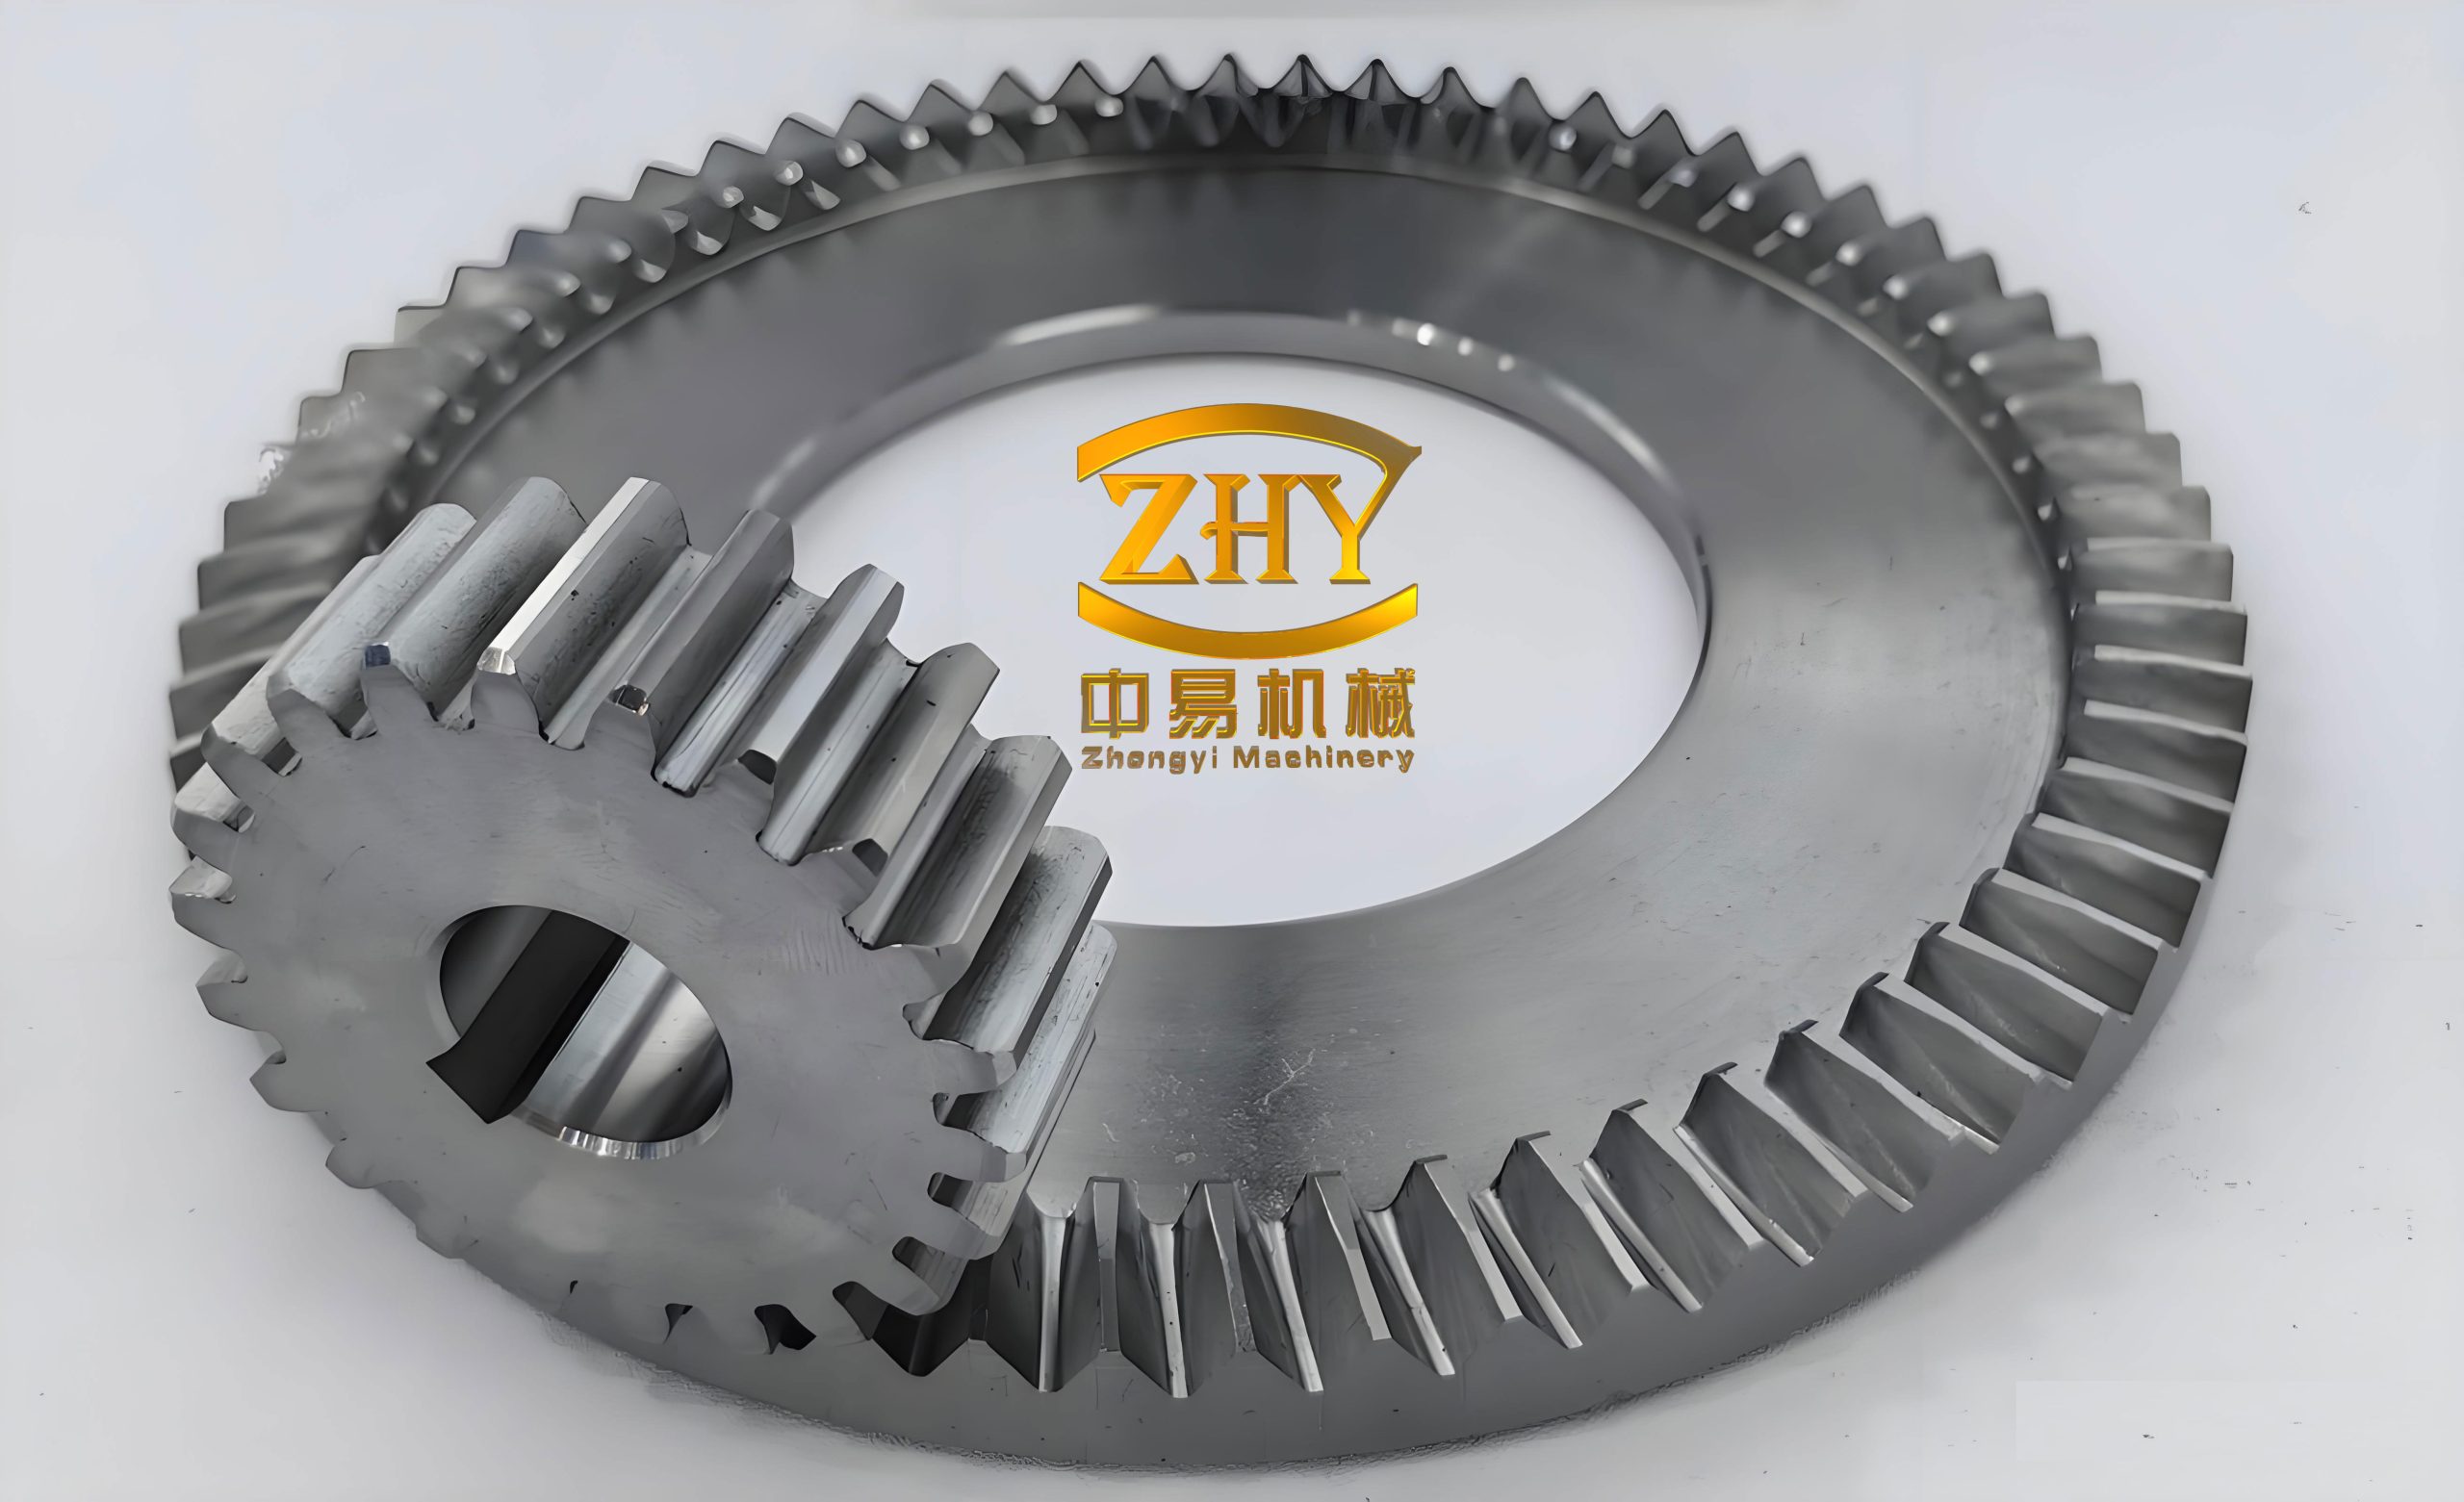
The gear tooth surface accuracy is measured using a coordinate measuring machine. The maximum normal deviation between the measured tooth surface and the theoretical tooth surface is less than 138 μm, which meets the accuracy requirements for a cast steel face gear under normal transmission conditions. The ultrasonic testing is performed using a CTS-1002 ultrasonic flaw detector. The working frequency is 0.5–15 MHz, the pulse repetition frequency is about 25–800 Hz, the gain range is 0–110 dB, the dynamic range is ≥32 dB, and the detection range is 0–6000 mm. The vertical linearity error is ≤3%, and the horizontal linearity error is ≤0.4%. The detection results show that there are obvious peaks at steps 14 and 56 in the central region, indicating slight shrinkage porosity. The tooth surface detection curve does not exceed the standard sample curve, indicating that the internal defect level is low. In summary, the lost foam casting process produces a herringbone face gear with acceptable tooth surface accuracy and internal quality.
Conclusion
In this study, I designed and optimized the lost foam casting process for a herringbone face gear. I derived the tooth surface equations based on spatial meshing theory, proposed an active topology modification method, and determined the optimal modification amount of 0.8 mm. I designed a bottom pouring gating system and verified its superiority over top pouring through numerical simulation. I used response surface methodology to optimize the pouring temperature, filling speed, and negative pressure. The optimal parameters are 1600 °C, 13 s, and 0.04 MPa. The verification simulation shows that the shrinkage porosity is reduced to about 5%, and the gear body is almost defect-free. I manufactured the white pattern by CNC milling, conducted the casting experiment, and verified the casting quality by coordinate measurement and ultrasonic testing. The tooth surface deviation is less than 138 μm, and the internal shrinkage porosity is minor. The results demonstrate that the proposed casting design and optimization method is effective for manufacturing complex herringbone face gears with good quality and accuracy.