
Accurate simulation of gear tooth surfaces remains challenging with existing methods, particularly for capturing machining-induced features like tool marks. This study presents a high-fidelity simulation methodology for gear shaping based on CATIA V5. Traditional approaches often fail to replicate actual surface topography due to insufficient modeling of machining kinematics and tool-workpiece interactions. Our method overcomes these limitations through precise spatial motion modeling combined with CATIA’s Boolean operations and secondary development capabilities, enabling digital twin representation of actual manufacturing processes.
Kinematic Foundation of Gear Shaping
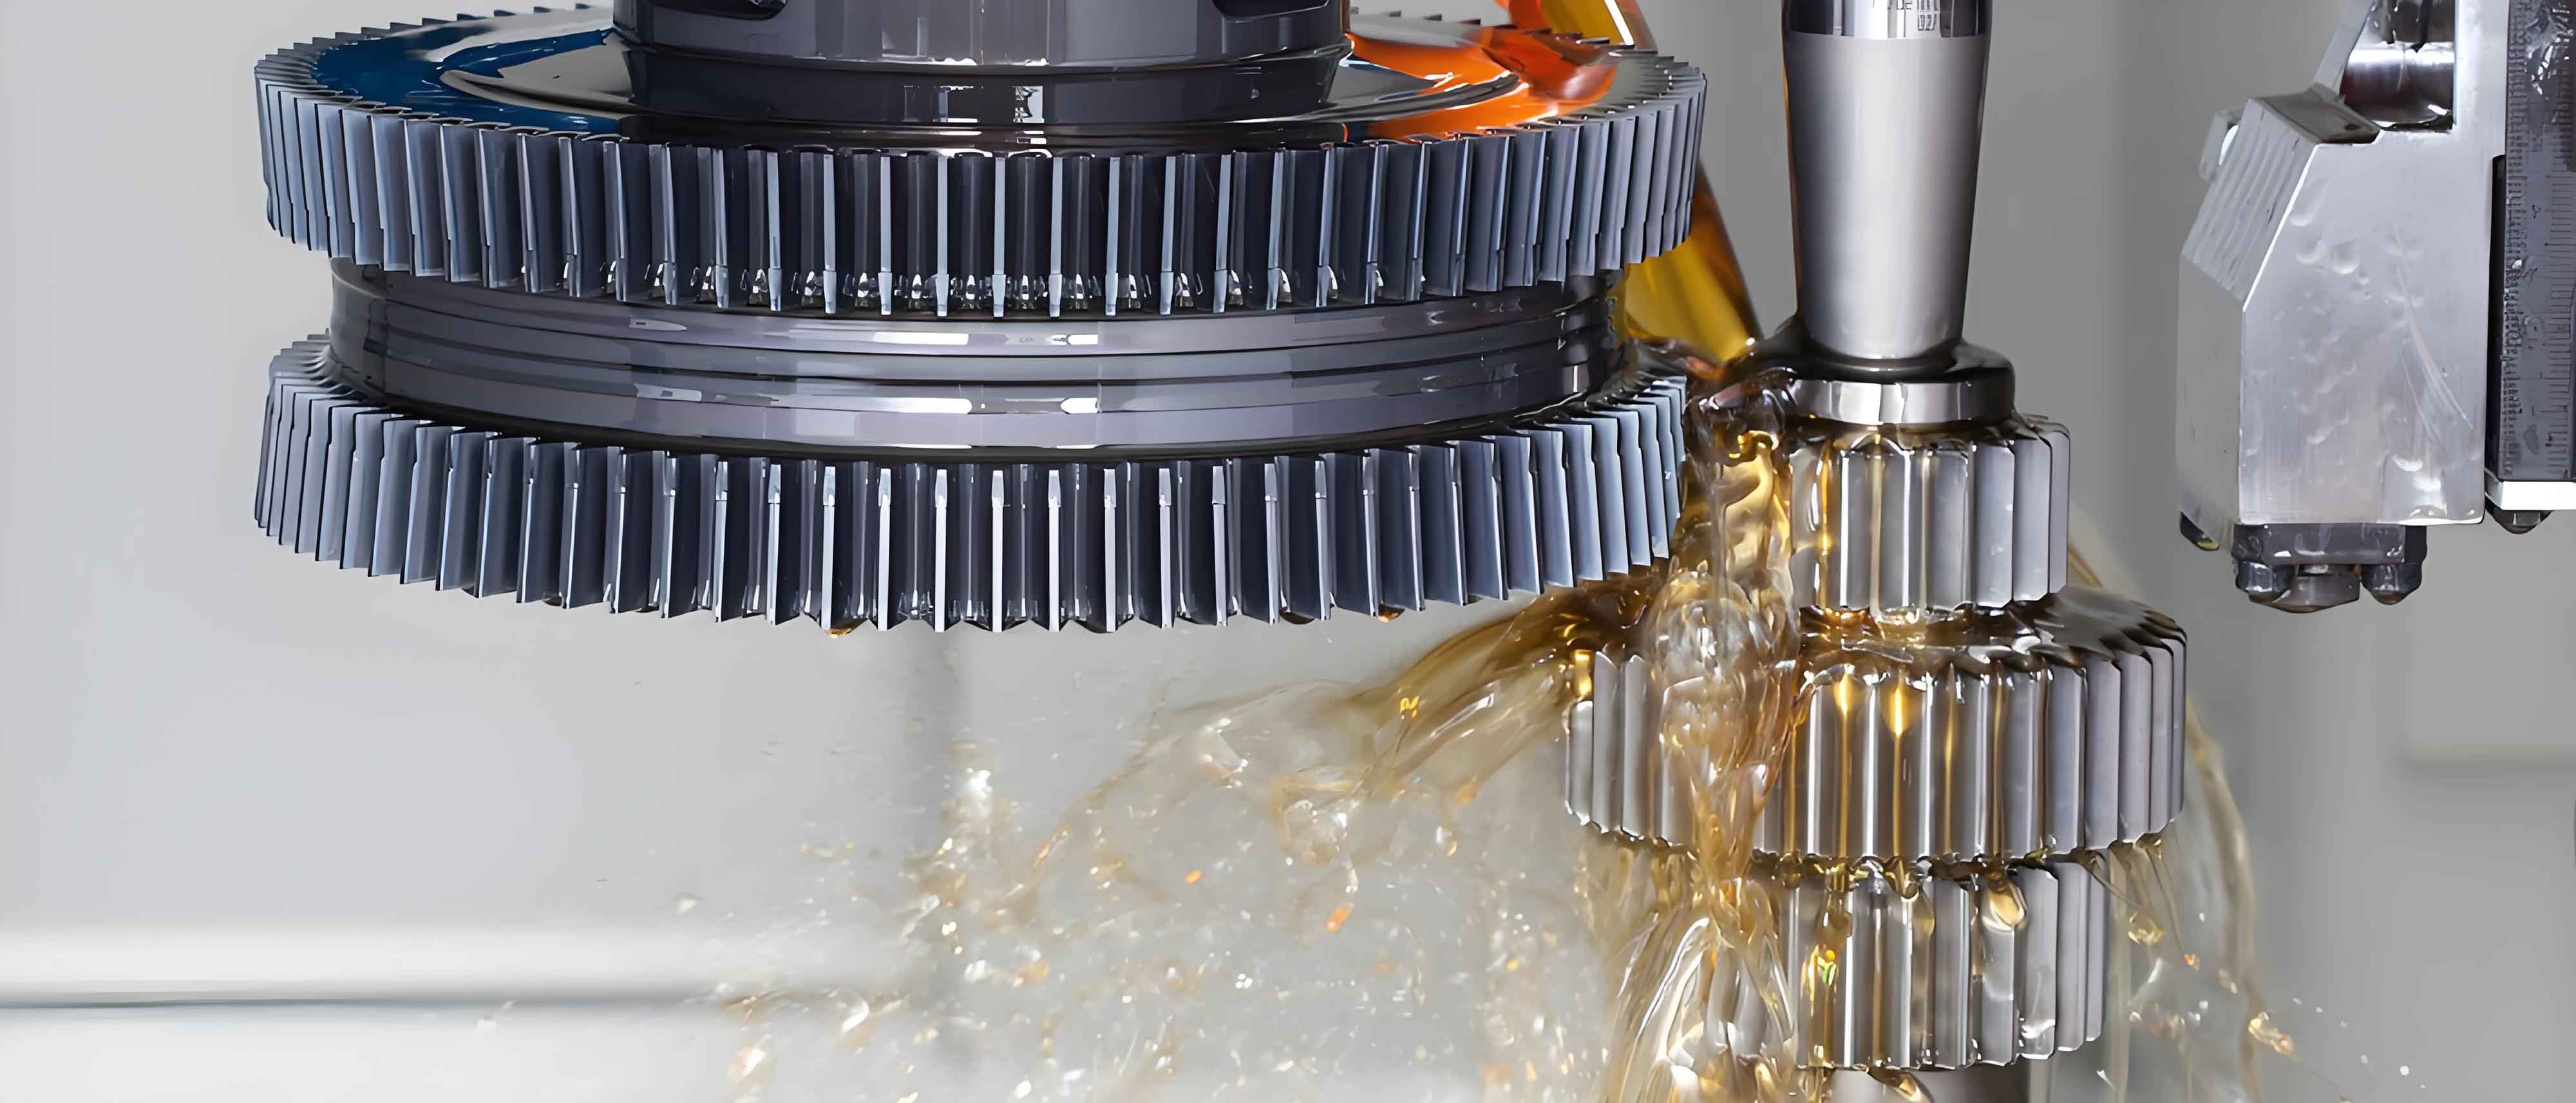
The gear shaping process emulates discontinuous meshing between two spur gears, where the cutting tool generates the workpiece through four coordinated motions:
- Primary cutting motion: Axial reciprocation of cutter $$z(t) = A \cdot \sin(2\pi f t)$$ where $A$ = amplitude, $f$ = frequency
- Generating motion: Synchronized rotation satisfying $$\frac{\omega_1}{\omega_0} = \frac{z_0}{z_1}$$ where $\omega$ = angular velocity, $z$ = tooth count
- Radial feed motion: Incremental infeed $\Delta r$ per stroke cycle
- Retraction motion: Radial clearance during return stroke
The cutter profile requires geometric compensation for rake ($\alpha$) and relief angles ($\beta$). The modified pressure angle $\alpha_n$ is calculated as:
$$\tan\alpha_n = \frac{\tan\alpha}{1 – \tan\alpha \cdot \tan\gamma \cdot \cos\beta}$$
where $\gamma$ = shear angle. This correction ensures accurate tooth profile generation during virtual gear shaping.
| Parameter | Cutter | Gear |
|---|---|---|
| Module (mm) | 2 | 2 |
| Teeth count | 38 | 20 |
| Pressure angle (°) | 20 (modified) | 20 |
| Addendum coefficient | 1.25 | 1.0 |
| Rake/relief angles (°) | 5/6 | N/A |
High-Fidelity Simulation Methodology
The gear shaping simulation implements five core processes in CATIA:
- Parametric modeling: Creation of compensated cutter profile and gear blank
- Kinematic emulation: Coordinate transformation matrices for simultaneous rotation and translation
$$\begin{bmatrix} x’ \\ y’ \\ z’ \\ 1 \end{bmatrix} = \begin{bmatrix} \cos\theta & -\sin\theta & 0 & \Delta x \\ \sin\theta & \cos\theta & 0 & \Delta y \\ 0 & 0 & 1 & z(t) \\ 0 & 0 & 0 & 1 \end{bmatrix} \begin{bmatrix} x \\ y \\ z \\ 1 \end{bmatrix}$$
- Boolean subtraction: Material removal via iterative cutter sweeping
- Memory optimization: Dynamic model reassembly when RAM exceeds 12GB threshold
- Automation: VBA-controlled loop structure with angular increment $\Delta\theta$
The circumferential feed increment $\Delta\theta$ governs simulation fidelity through iteration count:
$$n = \frac{\pi m z}{\Delta\theta}$$
where $m$ = module, $z$ = teeth count. Smaller $\Delta\theta$ values yield higher precision but increase computational load. The VBA implementation features adaptive memory management for large-scale gear shaping simulations.
| $\Delta\theta$ (°) | Iterations | CPU time (hr) | Surface deviation RMS (μm) |
|---|---|---|---|
| 0.4 | 314 | 2.1 | 8.2 |
| 0.2 | 628 | 4.7 | 3.5 |
| 0.1 | 1256 | 9.8 | 2.9 |
Surface Accuracy Verification
Tooth surface accuracy was quantified through normal distance measurements between simulated profiles and theoretical involutes. The involute curve is defined parametrically:
$$\begin{cases} x = r_b(\sin u – u \cos u) \\ y = r_b(\cos u + u \sin u) \end{cases}$$
where $r_b$ = base radius, $u$ = roll angle. Error distribution analysis reveals critical relationships:
- Maximum deviation occurs at tooth tip (12-15μm) and root (8-10μm)
- Sub-micron accuracy at pitch circle ($u$ = $\tan\alpha$)
- Error reduction follows logarithmic decay with decreasing $\Delta\theta$:
$$\epsilon = k_1 \cdot \ln(\Delta\theta) + k_2$$
These results validate the virtual gear shaping approach, showing excellent correlation with industrial machining standards where $\Delta\theta$ = 0.2° is typically used for finishing operations.
Finite Element Analysis of Tool Mark Effects
Two models were analyzed to investigate tool mark influences:
- Raw simulation model: Preserves actual tool marks from gear shaping
- Reconstructed model: B-spline smoothed surface without tool marks
Both models underwent high-fidelity meshing with localized refinement at contact zones (element size = 50μm). Material properties were defined for 40Cr alloy steel:
$$E = 211 \text{ GPa}, \quad \nu = 0.277, \quad \mu = 0.1$$
Contact analysis under 25 N·m torque revealed significant differences:
| Model | Max contact stress (MPa) | Stress fluctuation (±%) | Critical location |
|---|---|---|---|
| Simulation (with tool marks) | 868 | 40 | Pitch point |
| Reconstructed (smooth) | 716 | 3 | Pitch point |
The simulation model exhibits 21.2% higher peak stress and pronounced stress oscillations due to micro-contact at tool mark ridges. This demonstrates the necessity of incorporating actual gear shaping topography for accurate contact fatigue prediction.
Conclusions
This research establishes a comprehensive framework for high-fidelity gear shaping simulation and analysis:
- The CATIA-based methodology successfully replicates actual machining kinematics through coordinated motion emulation and adaptive Boolean operations
- Surface error analysis confirms sub-5μm accuracy when $\Delta\theta \leq 0.2°$, matching industrial finishing standards
- Finite element results demonstrate that tool marks increase maximum contact stress by >20% and cause significant stress fluctuations
- The validated approach provides a digital twin platform for optimizing gear shaping parameters to minimize surface imperfections
This methodology extends to other gear manufacturing processes like hobbing and grinding, offering a unified solution for precision gear design and manufacturing optimization. Future work will incorporate thermal effects and tool wear modeling for enhanced prediction accuracy.