
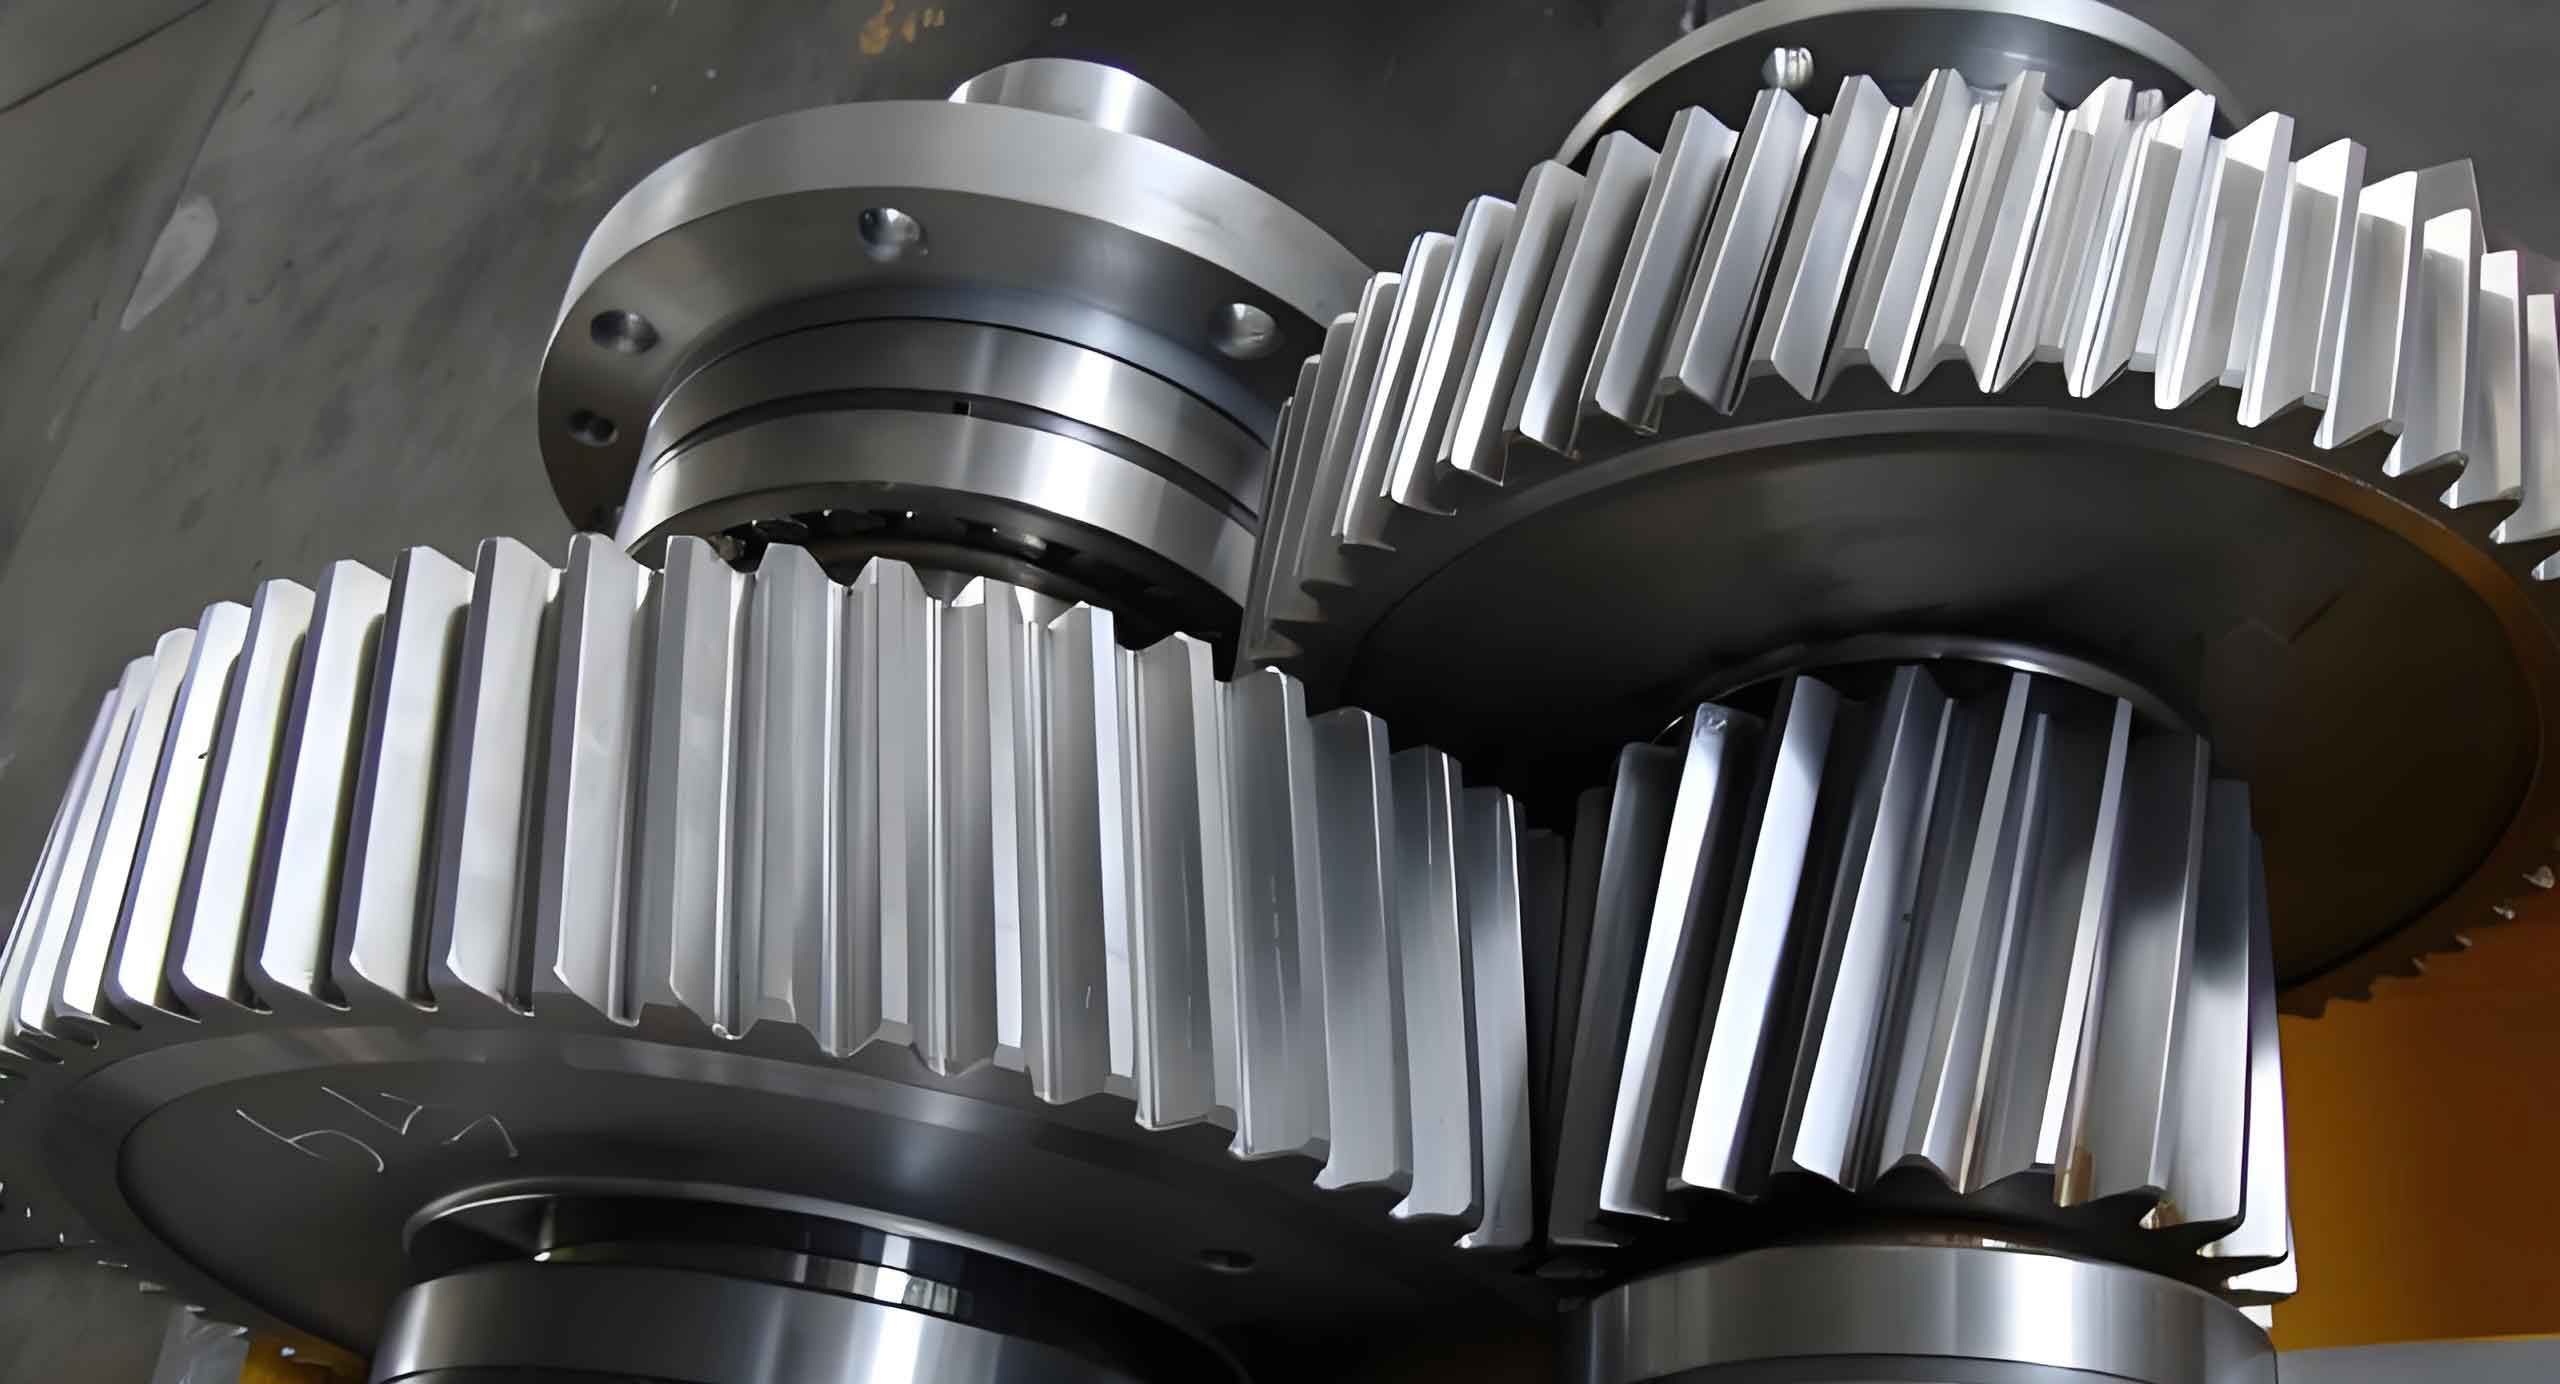
In the realm of automotive powertrain systems, the performance and durability of transmission components are paramount. Among these, the helical gear is a critical element within reduction gear units, prized for its smooth, quiet operation and high load-bearing capacity due to the gradual engagement of its angled teeth. However, achieving the necessary surface hardness and wear resistance for components like the N1908-1 helical gear necessitates rigorous heat treatment processes, primarily carburizing and quenching. While this treatment imparts a hard, wear-resistant case, it invariably introduces dimensional distortions and residual stresses, which can compromise the final precision, noise characteristics, and fatigue life of the gear. Controlling this quenching distortion is therefore a central challenge in high-precision gear manufacturing. This article delves into a comprehensive, first-person investigation utilizing advanced computer simulation to unravel the complex thermo-mechanical phenomena during the quenching of an automotive helical gear, aiming to predict distortion patterns and establish a foundation for process optimization.
The manufacturing sequence for the subject helical gear, post-forging, typically follows: Normalizing → Turning → Hobbing → Carburizing → Quenching → Bore Grinding → Tooth Grinding. The quenching stage, performed after the gear has been carburized to enrich its surface with carbon, is the most critical for inducing distortion. The process involves rapidly cooling the gear from an austenitizing temperature (e.g., 780-820°C) in a quenching medium, such as oil, to transform the austenitic surface layer into hard martensite. This rapid, non-uniform cooling is the primary source of internal stresses leading to distortion. To mitigate this, understanding the precise interplay between thermal gradients, phase transformations, and resulting stresses is essential. This is where computational simulation becomes an indispensable tool, allowing us to probe the process at a level of detail impractical through physical experimentation alone.
1. Foundations of the Quenching Simulation Model
Accurate simulation begins with an accurate digital representation of the physical object and process. The complex geometry of a helical gear, defined by an involute profile in the transverse section and a helix angle along the face width, presents the first challenge. The finite element model must faithfully capture this geometry. Given the symmetry and periodic nature of a helical gear, a sector model containing one or several teeth is often sufficient for analysis, significantly reducing computational cost without sacrificing accuracy. For this study, a three-dimensional model of a single tooth, including its root fillet and a section of the gear body and bore, was constructed. This model serves as the domain for solving the coupled thermal and mechanical governing equations.
The core physics of quenching is a transient, non-linear, coupled thermo-metallurgical-mechanical problem. The governing heat transfer equation during cooling is given by Fourier’s law with an internal heat generation term due to the latent heat of phase transformation:
$$
\rho c_p \frac{\partial T}{\partial t} = \nabla \cdot (k \nabla T) + \dot{q}_{latent}
$$
where $\rho$ is density, $c_p$ is specific heat, $T$ is temperature, $t$ is time, $k$ is thermal conductivity, and $\dot{q}_{latent}$ is the latent heat release rate from martensitic transformation. The boundary condition for heat exchange with the quenchant is critically important. For oil quenching, the heat transfer coefficient (HTC) is not constant but a complex function of surface temperature, characterizing the stages of vapor blanket (film boiling), nucleate boiling, and convective cooling. Data for a typical quenching oil (e.g., AN32) is essential. The HTC curve is characterized by a peak during the nucleate boiling stage and a lower value during convective cooling, as approximated in the table below.
| Surface Temperature Range (°C) | Heat Transfer Mode | Approx. HTC (W/m²·K) |
|---|---|---|
| > 600 | Vapor Blanket | 300 – 500 |
| ~300 – 600 | Nucleate Boiling (Peak) | 1500 – 3000 |
| < 300 | Convective Cooling | 500 – 800 |
The mechanical response is governed by the equilibrium equations, with the total strain $\epsilon_{total}$ decomposed into elastic, plastic, thermal, and transformational components:
$$
\epsilon_{total} = \epsilon_{el} + \epsilon_{pl} + \epsilon_{th} + \epsilon_{tr}
$$
The thermal strain $\epsilon_{th}$ is directly linked to the material’s coefficient of thermal expansion (CTE), $\alpha(T)$, which itself varies with temperature:
$$
\epsilon_{th} = \int_{T_{ref}}^{T} \alpha(T) \, dT
$$
The transformational strain $\epsilon_{tr}$ arises from the volumetric change associated with the austenite-to-martensite transformation. Martensite has a larger specific volume than austenite, leading to an expansion strain often modeled as a function of the martensite volume fraction, $\xi$: $\epsilon_{tr} = \beta \cdot \xi$, where $\beta$ is a dilatation parameter (~0.01-0.02).
The material properties for the gear steel (e.g., AISI 8620 or similar) are all temperature and phase-dependent. Key properties required for the simulation include:
| Material Property | Dependency | Impact on Simulation |
|---|---|---|
| Young’s Modulus (E) | Decreases with temperature | Affects stress-strain relationship. |
| Yield Strength (σ_y) | Decreases with temperature | Determines onset of plastic deformation. |
| Coeff. of Thermal Expansion (α) | Increases with temperature | Directly drives thermal strain and stress. |
| Thermal Conductivity (k) | Varies with temperature | Governs rate of heat extraction. |
| Specific Heat (c_p) | Varies with temperature/phase | Affects temperature evolution rate. |
| TTT/CCT Diagram Data | — | Used to model phase transformation kinetics. |
2. The Genesis of Distortion: Thermal and Transformation Stresses
The distortion in a quenched helical gear is the macroscopic manifestation of internal stresses that exceed the material’s yield strength at elevated temperatures. These internal stresses originate from two primary, and often competing, sources: thermal stress and transformation stress.
Thermal Stress: This is the first stress to develop. Upon immersion in the quenchant, the surface of the helical gear cools rapidly, contracting due to thermal contraction. The core, however, remains hot and expansive for a longer period. This differential contraction sets up steep thermal gradients. The cooler surface wants to contract more than the restrained hot core, putting the surface in tension and the core in compression initially. As cooling proceeds, the core eventually cools and contracts, but by then the surface may have already undergone phase transformation and become rigid. This can reverse the stress state, leading to a final condition where the hardened case is in a state of desirable compressive residual stress, and the core is in tension. The magnitude of thermal stress is intrinsically linked to the cooling rate and the coefficient of thermal expansion (CTE), as shown in the simplified relation for a constrained bar: $\sigma_{th} \propto E \cdot \alpha \cdot \Delta T$.
Transformation Stress (Organizational Stress): This stress arises specifically from the austenite-to-martensite phase transformation. Martensite formation is accompanied by a volume expansion of approximately 1-4%. In a helical gear, this transformation does not occur simultaneously throughout the part. The high-carbon case transforms first, starting at the Ms (Martensite start) temperature, which is well below the quench temperature. When the surface transforms and expands, the austenitic core restrains this expansion, placing the transforming case in compression and the core in tension. As the core later cools to its own Ms temperature and transforms, it also wants to expand, but is now restrained by the already hardened and rigid case. This complex interaction can modify the final residual stress profile significantly. The transformation-induced strain is a critical driver for the distortion of the helical gear’s precise geometry, affecting tooth profile, lead, and bore roundness.
The final distortion is a complex superposition of the deformation caused by these two stress systems acting throughout the transient thermal and metallurgical history of the part. The geometry of the helical gear, with its thin web, solid rim, and asymmetrical tooth profile, further complicates the stress distribution, making generalized predictions difficult and necessitating component-specific simulation.
3. Simulation Execution and Detailed Analysis of Helical Gear Distortion
Using the ANSYS finite element software, a coupled thermal-structural analysis was performed. The simulation proceeds in two sequential, but coupled, steps: First, a transient thermal analysis calculates the temperature history at every node in the model, incorporating the temperature-dependent HTC and the latent heat of transformation. Second, a structural analysis uses this temperature history as a thermal load to compute the resulting stresses, strains, and displacements (distortion), accounting for temperature-dependent elastic-plastic material behavior and transformation-induced strain.
The analysis focused on the critical initial 100 seconds of the quenching process, where the most severe thermal gradients and the bulk of the martensitic transformation in the case occur. Key nodes were monitored to quantify specific distortion modes relevant to helical gear functionality.
3.1 Radial Growth of Bore and Addendum Circle
Nodes on the bore and the addendum (tooth tip) circle in the mid-plane of the gear face width were tracked. Their radial displacement over time reveals the expansion or contraction of these critical diameters. The simulation showed an initial rapid contraction for both as the surface cooled. However, as the case transformed to martensite and expanded, a net positive displacement (growth) was observed for both diameters by the end of the simulated period. The difference between the two displacements, $\Delta U_y = U_{addendum} – U_{bore}$, represents the change in the radial distance from the bore to the tip, effectively indicating a “dishing” or “crowning” tendency of the gear body.
3.2 Tooth Thickness Variation at the Pitch Circle
To assess tooth distortion, nodes on the left and right flanks at the pitch circle diameter were monitored in the tangential direction. The tangential displacement difference between symmetric points on opposite flanks, $\Delta U_x$, indicates a change in chordal tooth thickness. The simulation indicated that during the initial thermal contraction phase, the tooth thickness decreased slightly. Subsequently, with martensitic transformation and expansion in the case, the tooth thickness increased beyond its initial dimension. The final simulated tooth thickness growth was on the order of a few hundredths of a millimeter.
3.3 Simulated vs. Measured Distortion Data
The table below summarizes the range of dimensional changes predicted by the simulation over the 0-100s period (primarily capturing thermal stress and initial transformation effects) and compares them with actual measurements taken on production gears after complete quenching and tempering.
| Dimension Measured | Simulated Increment (0-100s) | Measured Increment (Post-Quench) | Comments |
|---|---|---|---|
| Bore Diameter | +1.2 to +2.1 mm (scale model) | +2.2 to +4.3 mm (actual) | Simulation under-predicts; full transformation and long-term stress relaxation add growth. |
| Addendum Circle Diameter | +3.0 to +3.7 mm (scale model) | +3.0 to +4.9 mm (actual) | Good agreement in lower range; scatter in measured data reflects process variability. |
| Pitch Circle Tooth Thickness | +0.02 to +0.04 mm | +0.05 to +0.09 mm | Simulation captures trend but magnitude is lower due to simplified transformation model and omitted post-quench changes. |
The comparison shows that the simulation model correctly predicts the direction and qualitative nature of the helical gear’s distortion—namely, growth in both bore and outer diameter and an increase in tooth thickness. The quantitative discrepancy, where measured distortions are generally larger, is expected and informative. It highlights factors not fully captured in the initial 100-second simulation window: the continued cooling and transformation of the core, the full evolution of transformation stresses, and stress relief during subsequent tempering. This discrepancy does not invalidate the model but rather defines its scope and underscores the need for a full-process simulation to achieve quantitative parity.
4. Conclusions and Implications for Helical Gear Manufacturing
This detailed simulation study provides profound insights into the quenching distortion behavior of automotive helical gears. The primary conclusions are:
- Distortion Mechanism: The distortion is a direct consequence of the interplay between thermal stresses, driven by CTE and cooling rate, and transformation stresses, driven by the volumetric expansion from martensite formation. In a helical gear, these stresses interact with the complex geometry, leading to predictable patterns of bore expansion, addendum circle growth, and tooth thickening.
- Model Validation: The developed thermo-metallurgical-mechanical finite element model successfully replicates the qualitative distortion trends observed in practice. The directional agreement between simulated and measured data confirms the model’s capability to capture the essential physics of the quenching process for a helical gear.
- Predictive Utility: While the short-term simulation under-predicts the absolute magnitude of final distortion, it serves as a powerful predictive tool. It allows engineers to understand how changes in quenching parameters (oil temperature, agitation), gear geometry (web thickness, helix angle), or material properties would relatively affect the distortion pattern of the helical gear.
- Path to Optimization: The validated model forms the basis for virtual process optimization. Engineers can now simulate the effect of:
- Modified Quench Parameters: Using a hotter oil or calmer agitation to reduce cooling severity and thermal stress.
- Press Quenching: Applying mechanical constraints during cooling to forcibly control the bore and face distortion of the helical gear.
- Induction or Laser Hardening: Comparing distortion from localized hardening vs. through-hardening for the helical gear.
- Pre-bore and Pre-tooth Geometry: Intentionally machining the gear blank (pre-distortion) in the opposite direction of the predicted distortion, so that the quenching process brings it back to the nominal dimensions.
In summary, the application of computer simulation to the quenching of helical gears has transitioned the understanding of distortion from an empirical, trial-and-error domain to a science-based, predictive one. By leveraging these models, manufacturers can significantly reduce the scrap and rework associated with heat treatment, improve the dimensional accuracy and performance of helical gears, and accelerate the development cycle for new transmission systems, ultimately contributing to more reliable and efficient automotive powertrains.