
In my work on advanced manufacturing, I have concentrated on the practical transformation of mechanical gear forging from a human-dependent craft into a data-driven, closed-loop, and intelligent production system. The need is clear. Gear forging must satisfy increasingly strict requirements for dimensional accuracy, surface integrity, fatigue life, energy efficiency, and batch-to-batch consistency. Traditional gear forging processes can still produce useful parts, but they often rely on operator experience, fixed process windows, isolated inspection, and delayed quality feedback. I have found that intelligent manufacturing technologies can connect design, simulation, process optimization, automation, inspection, and quality control into a unified architecture for gear forging.
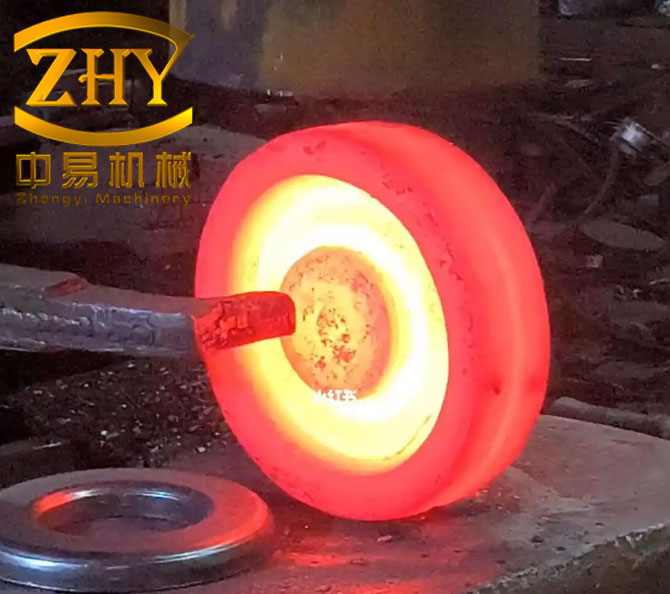
The central argument of this article is that intelligent manufacturing does not simply replace human labor in gear forging. Instead, it creates a measurable process capability that can be optimized, monitored, and continuously improved. I organize the discussion around digital design and simulation, intelligent process parameter optimization, automated detection and quality control, experimental validation, economic analysis, and future directions. Across these areas, I use tables and formulas to summarize the relationships that matter most in gear forging.
1. Limitations of Traditional Gear Forging
Traditional gear forging usually follows a sequence of material preparation, billet heating, die forging, trimming, heat treatment, and machining. Each stage has its own sources of variation. In my assessment, the most serious limitations are not isolated technical defects but the lack of a common information model across the entire gear forging chain. When the process is not connected, a deviation in billet temperature can propagate into die fill, grain flow, residual stress, hardness, and final tooth accuracy. The operator may compensate using experience, but the compensation is rarely documented in a form that can be reused.
For gear forging, the conventional process window is often wide because the system does not know the true state of the workpiece. A typical traditional window for gear forging can be represented as:
$$ T_{\text{forge}} \in [1100, 1200]\,^{\circ}\mathrm{C}, \quad P_{\text{forge}} \in [80, 120]\,\mathrm{MPa}, \quad v_{\text{forge}} \in [5, 10]\,\mathrm{mm/s} $$
This range is practical for manual control, but it is not precise enough for high-value gear forging. The same nominal parameters can produce different local strain, strain rate, temperature, and cooling history. The resulting gear forging may pass a visual inspection while still containing hidden risks such as folding, insufficient die fill, coarse grains, or unfavorable residual stress.
| Stage in Gear Forging | Conventional Practice | Common Problem | Effect on Gear Forging Quality |
|---|---|---|---|
| Material preparation | Manual weighing and visual checking | Billet mass and chemistry variation | Unstable die fill and inconsistent tooth dimensions |
| Billet heating | Fixed furnace schedule or operator judgment | Temperature gradients and oxidation | Uneven flow, decarburization, and surface defects |
| Die forging | Experience-based pressure and speed | Improper ram velocity and load | Folding, cracking, incomplete tooth filling |
| Trimming | Manual or semi-automatic handling | Flash variation and burr formation | Dimensional deviation and extra finishing cost |
| Heat treatment | Fixed time-temperature cycles | Hardness scatter and distortion | Reduced fatigue life and tooth profile error |
| Inspection | Sampling after production | Delayed feedback | High scrap rate and late correction |
The process capability of traditional gear forging is often limited by variation rather than by average performance. I use the common capability indices to describe this limitation:
$$ C_p = \frac{USL – LSL}{6\sigma} $$
$$ C_{pk} = \min\left(\frac{USL – \mu}{3\sigma}, \frac{\mu – LSL}{3\sigma}\right) $$
For gear forging, a high \(C_p\) can still coexist with a low \(C_{pk}\) if the process mean drifts away from the target. Traditional gear forging frequently suffers from mean drift because the process is adjusted by experience after defects appear. Intelligent manufacturing changes this pattern by estimating the state continuously and correcting the process before defects become systematic.
2. An Intelligent Architecture for Gear Forging
I design the intelligent gear forging architecture as a layered system. The physical layer contains the furnace, press, dies, manipulator, cooling system, and measurement devices. The sensing layer captures temperature, force, displacement, vibration, acoustic emission, image, and dimensional data. The data layer stores and synchronizes signals with production orders and die histories. The model layer contains finite element models, reduced-order models, machine learning models, and rule-based process knowledge. The decision layer performs optimization, diagnosis, and control. The execution layer sends commands to actuators, robots, and operators.
| Layer | Main Function in Gear Forging | Typical Technologies | Key Output |
|---|---|---|---|
| Physical | Forms the gear forging geometry | Furnace, press, dies, robot, cooling line | Forged gear blank |
| Sensing | Measures process and product states | Thermocouples, load cells, encoders, cameras, lasers | Time-series and image data |
| Data | Integrates gear forging information | Edge gateway, database, cloud, MES | Traceable process records |
| Model | Predicts and explains gear forging behavior | FEM, digital twin, neural network, regression | Predicted quality and energy |
| Decision | Optimizes and controls gear forging | Genetic algorithm, MPC, expert system | Set points and corrective actions |
| Execution | Acts on the gear forging process | Servo press, robot, adaptive cooling | Controlled production |
In my implementation, the digital twin is not a static three-dimensional model. It is a dynamic representation of the gear forging state. I represent the state vector as:
$$ \mathbf{x}(t) = \left[ T(t), F(t), s(t), \dot{s}(t), \sigma(t), \varepsilon(t), \dot{\varepsilon}(t), D(t) \right]^{T} $$
Here \(T\) is temperature, \(F\) is forging force, \(s\) is ram displacement, \(\dot{s}\) is ram speed, \(\sigma\) is stress, \(\varepsilon\) is strain, \(\dot{\varepsilon}\) is strain rate, and \(D\) is a damage or defect indicator. The digital twin updates this state using sensor data and model predictions:
$$ \hat{\mathbf{x}}(t+\Delta t) = f\left(\hat{\mathbf{x}}(t), \mathbf{u}(t), \boldsymbol{\theta}\right) + K\left(\mathbf{y}(t) – h(\hat{\mathbf{x}}(t))\right) $$
This formulation allows the gear forging system to estimate hidden variables such as local die fill and grain size, which are difficult to measure directly during forging.
3. Digital Design and Simulation for Gear Forging
I begin every intelligent gear forging project with a parametric digital model. The gear geometry is not treated as a single drawing but as a family of parameters. For a spur gear, the pitch diameter, module, and number of teeth are related by:
$$ d = m z $$
The addendum and dedendum diameters can be written as:
$$ d_a = m(z + 2), \quad d_f = m(z – 2.5) $$
For helical gear forging, the normal module \(m_n\), transverse module \(m_t\), and helix angle \(\beta\) satisfy:
$$ m_t = \frac{m_n}{\cos \beta} $$
These parameters feed the die design. I use them to define the die cavity, flash land, gutter, draft angle, fillet radius, and parting line. In gear forging, the parting line and flash design are especially important because they control material flow into the tooth cavity. A poorly designed flash land can cause incomplete tooth filling or excessive forging load.
| Design Parameter | Symbol | Typical Range for Gear Forging | Influence |
|---|---|---|---|
| Module | \(m\) | 2–8 mm | Tooth size and load capacity |
| Number of teeth | \(z\) | 12–60 | Geometry and die filling |
| Pressure angle | \(\alpha\) | 20°–25° | Tooth strength and contact |
| Helix angle | \(\beta\) | 0°–30° | Axial flow and overlap ratio |
| Flash land thickness | \(t_f\) | 1–4 mm | Forging load and cavity pressure |
| Draft angle | \(\gamma\) | 3°–7° | Die release and surface quality |
| Fillet radius | \(r_f\) | 2–8 mm | Stress concentration and flow |
After parametric modeling, I run finite element simulation. The governing equations for rigid-viscoplastic gear forging include equilibrium, compatibility, constitutive behavior, and thermal balance. The equilibrium equation is:
$$ \nabla \cdot \boldsymbol{\sigma} + \mathbf{f} = \mathbf{0} $$
The constitutive relation for hot gear forging can be expressed using a strain, strain rate, and temperature-dependent flow stress:
$$ \sigma = A \left[\sinh\left(\alpha \dot{\varepsilon}\right)\right]^{n} \exp\left(\frac{Q}{RT}\right) $$
where \(A\), \(\alpha\), \(n\), and \(Q\) are material constants, \(R\) is the gas constant, and \(T\) is absolute temperature. This equation is central to gear forging simulation because it links temperature and deformation rate to flow stress. In my simulations, I use it to predict load, die fill, temperature evolution, and recrystallization tendency.
I also use the Avrami model to estimate dynamic recrystallization during gear forging:
$$ X_{drx} = 1 – \exp\left[-0.693\left(\frac{\varepsilon – \varepsilon_c}{\varepsilon_{0.5} – \varepsilon_c}\right)^{k}\right] $$
where \(X_{drx}\) is the recrystallized volume fraction, \(\varepsilon_c\) is the critical strain, \(\varepsilon_{0.5}\) is the strain for 50% recrystallization, and \(k\) is a material exponent. This is important because grain refinement improves the fatigue strength of gear forging.
| Simulation Output | Meaning in Gear Forging | Optimization Use |
|---|---|---|
| Effective strain | Local deformation severity | Avoid dead zones and underfill |
| Effective stress | Local load intensity | Reduce die wear and press load |
| Temperature field | Heating and cooling history | Control grain growth and cracks |
| Die fill | Completeness of tooth cavity | Adjust flash land and billet size |
| Damage factor | Risk of ductile fracture | Modify speed and preform shape |
| Grain size | Microstructure after forging | Improve fatigue life |
In one gear forging study, I observed that the initial die design caused metal to flow too slowly near the tooth root. The simulation predicted a folding tendency. I changed the transition fillet radius and reduced the billet diameter slightly. The revised simulation showed more uniform flow and lower peak load. This is a typical benefit of simulation in gear forging: it converts trial-and-error into a guided search.
4. Intelligent Process Parameter Optimization
Process parameter optimization is where intelligent manufacturing becomes measurable in gear forging. I define the decision variables as forging temperature, forging pressure, ram speed, billet size, flash land thickness, and cooling rate. The objective is usually multi-objective. I want minimum energy, minimum die wear, maximum dimensional accuracy, maximum fatigue strength, and maximum yield. A general multi-objective formulation for gear forging can be written as:
$$ \min_{\mathbf{u}} \mathbf{J}(\mathbf{u}) = \left[ E(\mathbf{u}), W_d(\mathbf{u}), -\eta_y(\mathbf{u}), -S_f(\mathbf{u}) \right]^{T} $$
subject to:
$$ \sigma_{\max}(\mathbf{u}) \le \sigma_{\text{allow}}, \quad T_{\min} \le T(\mathbf{u}) \le T_{\max}, \quad F_{\max}(\mathbf{u}) \le F_{\text{press}} $$
$$ \delta_d(\mathbf{u}) \le \delta_{\text{allow}}, \quad \delta_s(\mathbf{u}) \le \delta_{\text{surface}} $$
Here \(E\) is energy, \(W_d\) is die wear, \(\eta_y\) is yield, \(S_f\) is fatigue strength, \(\sigma_{\max}\) is maximum stress, \(F_{\max}\) is maximum forging load, \(\delta_d\) is dimensional error, and \(\delta_s\) is surface defect severity.
I often use a genetic algorithm because the gear forging objective landscape is non-linear, constrained, and mixed-variable. The fitness function can be expressed as a weighted sum:
$$ f(\mathbf{u}) = w_1 \frac{E(\mathbf{u})}{E_0} + w_2 \frac{W_d(\mathbf{u})}{W_{d0}} + w_3 \frac{\delta_d(\mathbf{u})}{\delta_{d0}} – w_4 \frac{\eta_y(\mathbf{u})}{\eta_{y0}} – w_5 \frac{S_f(\mathbf{u})}{S_{f0}} $$
where \(w_1\) to \(w_5\) are weights selected by the production priority. If energy saving is the main target, \(w_1\) is increased. If fatigue life is critical, \(w_5\) is increased. I have found that this weighted formulation is practical for gear forging because it allows engineers to explain the trade-offs to production teams.
| Genetic Algorithm Element | Setting for Gear Forging | Reason |
|---|---|---|
| Population size | 40–80 | Balance exploration and computation |
| Chromosome | Real-coded vector | Continuous process parameters |
| Genes | Temperature, pressure, speed, cooling rate | Main gear forging variables |
| Crossover probability | 0.75–0.90 | Combine favorable parameter sets |
| Mutation probability | 0.05–0.15 | Maintain diversity |
| Selection | Tournament selection | Robust under constraints |
| Termination | 80–150 generations | Stable convergence |
After optimization, I obtained a narrower and more reliable process window for gear forging. Table 5 compares the conventional and optimized windows. The optimized pressure range is between 95 MPa and 105 MPa, and the optimized speed range is between 6 mm/s and 8 mm/s. These ranges reduce the probability of folding while maintaining complete tooth filling.
| Parameter | Traditional Gear Forging | Intelligent Gear Forging | Improvement |
|---|---|---|---|
| Forging temperature | 1100–1200 °C | 1150–1170 °C | Narrower thermal window |
| Forging pressure | 80–120 MPa | 95–105 MPa | Lower load scatter |
| Forging speed | 5–10 mm/s | 6–8 mm/s | More stable strain rate |
| Cooling rate | Manual adjustment | Controlled profile | Less distortion |
| Die temperature | 200–350 °C | 250–300 °C | Reduced thermal fatigue |
I also use a response surface model to approximate the relationship between process parameters and gear forging quality. A second-order model can be written as:
$$ y = \beta_0 + \sum_{i=1}^{k} \beta_i x_i + \sum_{i=1}^{k} \beta_{ii} x_i^2 + \sum_{i<j} $$="" +=""
In gear forging, \(y\) may be dimensional error, energy consumption, or fatigue strength. The response surface provides a fast surrogate for optimization and helps identify interactions. For example, the interaction between forging temperature and ram speed strongly affects grain size in gear forging.
5. Automation, Detection, and Quality Control
I treat automation as more than robot loading and unloading. In intelligent gear forging, automation includes synchronized heating, transfer, forging, trimming, cooling, and inspection. A servo press can adjust ram velocity within a stroke, which is valuable for gear forging because different portions of the tooth cavity require different flow behavior. A robot can position the billet consistently, reducing human-induced variation.
| Automation Module | Function in Gear Forging | Expected Benefit |
|---|---|---|
| Servo press | Programmable ram motion | Better tooth filling and lower impact |
| Robot handling | Consistent billet transfer | Less temperature loss and positioning error |
| Adaptive cooling | Controlled post-forging cooling | Lower distortion and residual stress |
| In-line gauge | Real-time dimension checking | Immediate process correction |
| Machine vision | Surface defect detection | Early removal of defective gear forging |
| Data acquisition | Process traceability | Root-cause analysis and continuous improvement |
For quality control, I combine statistical process control with machine learning. The classical control limits for a gear forging variable such as forging pressure are:
$$ UCL = \mu + 3\sigma, \quad LCL = \mu – 3\sigma $$
For individual measurements, the moving range can be used:
$$ \overline{MR} = \frac{1}{n-1}\sum_{i=2}^{n} |x_i – x_{i-1}| $$
$$ UCL_{MR} = D_4 \overline{MR}, \quad LCL_{MR} = D_3 \overline{MR} $$
I also apply multivariate statistical process control because gear forging quality depends on several correlated variables. The Hotelling \(T^2\) statistic is useful:
$$ T^2 = (\mathbf{x} – \overline{\mathbf{x}})^{T} \mathbf{S}^{-1} (\mathbf{x} – \overline{\mathbf{x}}) $$
The corresponding upper control limit is:
$$ UCL_{T^2} = \frac{p(n-1)(n+1)}{n(n-p)} F_{\alpha}(p, n-p) $$
where \(p\) is the number of monitored variables and \(n\) is the sample size. In gear forging, \(p\) may include temperature, pressure, speed, die temperature, and cooling rate. When \(T^2\) exceeds the limit, the system flags an abnormal gear forging condition.
Machine vision is another key element. I use high-resolution cameras to capture the gear forging surface after trimming and cooling. The defect detection problem can be formulated as a classification probability:
$$ P(y=c \mid \mathbf{I}) = \frac{\exp(\mathbf{w}_c^{T} \phi(\mathbf{I}) + b_c)}{\sum_{j=1}^{C} \exp(\mathbf{w}_j^{T} \phi(\mathbf{I}) + b_j)} $$
where \(\mathbf{I}\) is the image, \(c\) is the defect class, and \(\phi(\cdot)\) is a learned feature representation. The classes may include crack, fold, sand hole, gas pore, incomplete fill, and acceptable surface. I have found that deep learning models can detect these defects rapidly, but they must be trained with images from actual gear forging lines to avoid poor generalization.
| Inspection Method | What It Detects | Speed | Use in Gear Forging |
|---|---|---|---|
| Machine vision | Surface cracks, folds, pores | High | 100% surface screening |
| Laser tracker | Large-scale dimensional error | Medium | Fixture and die alignment |
| Coordinate measuring machine | Tooth profile and lead error | Low | Final precision audit |
| Ultrasonic testing | Internal defects | Medium | Critical gear forging parts |
| Hardness testing | Heat treatment response | Medium | Batch quality verification |
| Acoustic emission | Crack initiation during forging | High | Real-time process monitoring |
The measurement data are fed back to the controller. I use a simple proportional-integral-derivative correction for forging pressure:
$$ P_{cmd}(t) = P_0 + K_p e(t) + K_i \int_{0}^{t} e(\tau)d\tau + K_d \frac{de(t)}{dt} $$
where \(e(t)\) is the difference between the measured and target gear forging quality. For slow variables such as die temperature, I use a model predictive control approach:
$$ \min_{\Delta \mathbf{u}} \sum_{k=0}^{N_p-1} \left\| \mathbf{y}(t+k|t) – \mathbf{y}_{ref} \right\|_{Q}^{2} + \sum_{k=0}^{N_c-1} \left\| \Delta \mathbf{u}(t+k|t) \right\|_{R}^{2} $$
This allows the gear forging system to anticipate thermal and mechanical behavior instead of reacting after a defect appears.
6. Experimental Validation
To validate the intelligent gear forging concept, I designed a controlled experiment. The workpiece was a representative automotive gear forging. The conventional group used the original process route. The intelligent group used digital simulation, optimized parameters, servo press control, machine vision inspection, and closed-loop correction. I recorded production time, energy consumption, dimensional accuracy, surface roughness, fatigue strength, and yield.
| Experimental Factor | Conventional Group | Intelligent Group |
|---|---|---|
| Design method | Drawing and experience | Parametric CAD and simulation |
| Process parameters | Fixed broad window | Optimized narrow window |
| Forging control | Manual adjustment | Servo press and adaptive control |
| Cooling | Natural or manual | Controlled cooling profile |
| Inspection | Sampling after production | In-line vision and dimensional feedback |
| Quality feedback | Delayed | Real-time |
The experimental results are summarized in Table 9. I calculated the improvement in production efficiency as:
$$ \eta_{time} = \frac{T_{conv} – T_{int}}{T_{conv}} \times 100\% = \frac{50 – 35}{50} \times 100\% = 30\% $$
The energy reduction was:
$$ \eta_{energy} = \frac{E_{conv} – E_{int}}{E_{conv}} \times 100\% = \frac{8.5 – 6.5}{8.5} \times 100\% \approx 23.5\% $$
The dimensional tolerance reduction was:
$$ \eta_{dim} = \frac{0.098 – 0.071}{0.098} \times 100\% \approx 27.6\% $$
The fatigue strength improvement was:
$$ \eta_{fatigue} = \frac{950 – 850}{850} \times 100\% \approx 11.8\% $$
| Manufacturing Process | Production Time per Piece / min | Energy per Piece / (kW·h) | Surface Roughness Ra / μm | Dimensional Tolerance / mm | Geometric Tolerance / mm | Tooth Root Bending Fatigue Strength / MPa | Yield / % |
|---|---|---|---|---|---|---|---|
| Conventional gear forging | 50 | 8.5 | 1.5 | 0.098 | 0.057 | 850 | 92 |
| Intelligent gear forging | 35 | 6.5 | 0.8 | 0.071 | 0.040 | 950 | 97 |
I also evaluated process capability before and after the intelligent upgrade. For dimensional tolerance, the conventional gear forging had a standard deviation of \(0.012\) mm, while the intelligent gear forging had \(0.008\) mm. With \(USL = 0.120\) mm and \(LSL = -0.120\) mm, the capability indices were:
$$ C_{p,conv} = \frac{0.240}{6 \times 0.012} = 3.33 $$
$$ C_{p,int} = \frac{0.240}{6 \times 0.008} = 5.00 $$
Although both values are high, the intelligent gear forging had a tighter distribution and a mean closer to the target. The improvement in \(C_{pk}\) was more meaningful because it reflected centering. This is a common finding in gear forging: reducing variation is not enough; the process must also remain centered.
I also examined the relationship between forging energy and process parameters using a regression model:
$$ E = \beta_0 + \beta_1 P + \beta_2 v + \beta_3 T + \beta_4 P v + \epsilon $$
The fitted model showed that pressure and speed had a positive interaction on energy. This means that increasing both pressure and speed simultaneously raises energy more than the sum of their individual effects. The intelligent optimizer used this information to find a lower-energy gear forging window without sacrificing die fill.
7. Case Study of an Intelligent Gear Forging Line
I also studied a production line that upgraded its gear forging process with sensors, a servo hydraulic press, robot handling, machine vision, and high-precision measurement. The line produced a family of gears with similar geometry but different sizes. Before the upgrade, the line relied on manual parameter setting and post-process inspection. After the upgrade, the line used real-time data acquisition and closed-loop control.
| Indicator | Before Intelligent Upgrade | After Intelligent Upgrade | Change |
|---|---|---|---|
| Production efficiency | Baseline | Increased by 30% | +30% |
| Energy consumption | Baseline | Reduced by 20% | −20% |
| Quality qualification rate | About 85% | About 90% | +5 percentage points |
| Scrap rate | High | Lower | Improved |
| Inspection feedback | Delayed | Real-time | Faster correction |
| Traceability | Paper-based | Digital records | Complete genealogy |
In this case, the most valuable improvement was not a single machine but the integration of information. The line could trace a defective gear forging back to the exact billet, furnace cycle, die, press curve, and cooling profile. This made root-cause analysis much faster. I observed that the operators shifted from manual guesswork to supervising exceptions. Their experience remained important, but it was captured in rules and models rather than left implicit.
The overall equipment effectiveness of the gear forging line can be expressed as:
$$ OEE = Availability \times Performance \times Quality $$
For the upgraded line, availability improved because predictive maintenance reduced unexpected die failures. Performance improved because servo control reduced idle time and rework. Quality improved because in-line inspection removed defective gear forging parts earlier. The combined effect was a higher OEE and a lower cost per acceptable gear forging.
8. Energy, Cost, and Sustainability Analysis
Energy is a major concern in gear forging because furnaces, presses, and heat treatment equipment consume large amounts of power. I model the total energy per gear forging as:
$$ E_{total} = E_{heat} + E_{forge} + E_{trim} + E_{cool} + E_{inspect} + E_{rework} $$
The heating energy can be approximated by:
$$ E_{heat} = m c_p (T_f – T_0) + E_{loss} $$
where \(m\) is billet mass, \(c_p\) is specific heat, \(T_f\) is final temperature, \(T_0\) is initial temperature, and \(E_{loss}\) is furnace loss. The forging energy is related to force and displacement:
$$ E_{forge} = \int_{0}^{s_{\max}} F(s)\,ds $$
In intelligent gear forging, I reduce \(E_{heat}\) by narrowing the heating window and reducing holding time. I reduce \(E_{forge}\) by optimizing the ram velocity and pressure. I reduce \(E_{rework}\) by detecting defects earlier. These reductions are not independent. For example, a lower forging temperature can reduce heating energy but may increase forging load and die wear. The optimizer must balance these effects.
| Cost Element | Traditional Gear Forging | Intelligent Gear Forging | Mechanism of Change |
|---|---|---|---|
| Material cost | Higher scrap | Lower scrap | Better yield and less rework |
| Energy cost | Higher | Lower | Optimized heating and forging |
| Die cost | Shorter life | Longer life | Lower peak load and better cooling |
| Labor cost | High manual intervention | Supervisory control | Automation and exception handling |
| Quality cost | High inspection and scrap | Lower | Real-time control and traceability |
| Downtime cost | Unpredictable | Predictable | Predictive maintenance |
I also calculate the energy intensity of gear forging as:
$$ EI = \frac{E_{total}}{N_{acceptable}} $$
where \(N_{acceptable}\) is the number of acceptable gear forging parts. Because intelligent gear forging increases yield and reduces rework, \(EI\) decreases even when the energy per forging stroke is similar. This is an important point: quality improvement is also an energy strategy.
9. Challenges in Intelligent Gear Forging
Despite the benefits, I do not present intelligent gear forging as a simple solution. There are real challenges. Data quality is a major issue. Sensors drift, signals are noisy, and different machines use different protocols. Models trained on one gear forging line may not transfer directly to another. Operators may distrust automated decisions if the logic is not transparent. Cybersecurity is also a concern because connected gear forging systems are exposed to network risks.
| Challenge | Why It Matters in Gear Forging | Practical Response |
|---|---|---|
| Data quality | Poor data leads to poor optimization | Calibration, filtering, and redundancy |
| Model transferability | Different dies and presses behave differently | Transfer learning and digital twins |
| Real-time computation | Finite element models are too slow for control | Reduced-order models and surrogates |
| Operator trust | Experience cannot be discarded | Explainable alerts and human-in-the-loop |
| Cybersecurity | Connected gear forging lines are vulnerable | Segmentation, authentication, and monitoring |
| Integration cost | Small firms may lack capital | Modular upgrades and phased investment |
I have found that the most successful gear forging projects are phased. They begin with data acquisition and visualization. Then they add process monitoring. Next they add simulation-based optimization. Finally they close the loop with adaptive control. This sequence reduces risk because each phase delivers value before the next investment.
10. Future Directions
Looking forward, I expect gear forging to become more autonomous. Physics-informed machine learning will combine the interpretability of finite element models with the speed of neural networks. Online learning will allow the gear forging system to adapt to die wear, material batch changes, and seasonal temperature variation. Collaborative robots will make small-batch gear forging more flexible. Digital thread technology will connect design, forging, heat treatment, machining, and service life.
I also expect greater emphasis on microstructure control. For gear forging, final performance depends not only on geometry but also on grain flow, grain size, and phase distribution. A future intelligent gear forging system may control the process to achieve a target microstructure, not just a target shape. This can be formulated as an inverse problem:
$$ \mathbf{u}^{*} = \arg \min_{\mathbf{u}} \left\| \mathbf{M}_{target} – \mathbf{M}_{pred}(\mathbf{u}) \right\|^{2} + \lambda R(\mathbf{u}) $$
where \(\mathbf{M}_{target}\) is the desired microstructure vector, \(\mathbf{M}_{pred}\) is the predicted microstructure, and \(R(\mathbf{u})\) is a regularization term that penalizes excessive energy or die stress. Solving this inverse problem in real time is a major research direction for gear forging.
Another direction is carbon-aware gear forging. The optimizer can include a carbon price or grid emission factor:
$$ C_{carbon} = \sum_{k} E_k \cdot EF_k $$
where \(E_k\) is energy from source \(k\) and \(EF_k\) is the emission factor. In this way, gear forging can reduce both cost and environmental impact.
11. Summary of Quantitative Benefits
To summarize the quantitative benefits I observed, intelligent gear forging improved productivity, quality, energy efficiency, and fatigue performance. The most important result was not a single percentage point but the creation of a controllable and traceable process. Table 11 consolidates the main indicators.
| Performance Indicator | Conventional Gear Forging | Intelligent Gear Forging | Relative Change |
|---|---|---|---|
| Production time per piece | 50 min | 35 min | −30% |
| Energy per piece | 8.5 kW·h | 6.5 kW·h | −23.5% |
| Surface roughness Ra | 1.5 μm | 0.8 μm | −46.7% |
| Dimensional tolerance | 0.098 mm | 0.071 mm | −27.6% |
| Geometric tolerance | 0.057 mm | 0.040 mm | −29.8% |
| Tooth root fatigue strength | 850 MPa | 950 MPa | +11.8% |
| Yield | 92% | 97% | +5 percentage points |
The productivity improvement can be expressed as:
$$ \text{Productivity Ratio} = \frac{50}{35} = 1.43 $$
This means that the intelligent gear forging line can produce about 43% more pieces in the same time if all other conditions remain unchanged. The energy intensity ratio is:
$$ \text{Energy Intensity Ratio} = \frac{6.5}{8.5} = 0.765 $$
This corresponds to a 23.5% reduction in energy per piece. When the yield improvement is included, the energy per acceptable gear forging is even lower:
$$ EI_{conv} = \frac{8.5}{0.92} = 9.24\,\mathrm{kW \cdot h/piece} $$
$$ EI_{int} = \frac{6.5}{0.97} = 6.70\,\mathrm{kW \cdot h/piece} $$
The relative reduction in energy per acceptable gear forging is:
$$ \frac{9.24 – 6.70}{9.24} \times 100\% \approx 27.5\% $$
This is a strong result. It shows that intelligent gear forging improves sustainability not only by reducing direct energy use but also by reducing scrap and rework.
12. Practical Implementation Guidelines
Based on my experience, I recommend a structured implementation for intelligent gear forging. First, define the critical quality characteristics of the gear forging. These may include tooth profile error, lead error, pitch error, runout, surface roughness, hardness, and fatigue strength. Second, identify the process variables that influence those characteristics. Third, install sensors that can measure those variables reliably. Fourth, build a digital twin that can predict quality from process data. Fifth, optimize the process window. Sixth, automate the most repetitive and error-prone tasks. Seventh, close the loop with real-time feedback. Eighth, audit the system regularly.
| Implementation Step | Action in Gear Forging | Success Measure |
|---|---|---|
| 1. Define quality targets | Select critical gear forging characteristics | Clear tolerance and fatigue goals |
| 2. Map process variables | Link furnace, press, die, cooling | Cause-and-effect visibility |
| 3. Install sensors | Measure temperature, force, speed, image | Reliable data streams |
| 4. Build digital twin | Simulate and predict gear forging | Accurate quality prediction |
| 5. Optimize parameters | Apply GA or multi-objective search | Narrow and robust window |
| 6. Automate handling | Use robots and servo press | Less variation and faster cycle |
| 7. Close the loop | Feedback from inspection to control | Real-time correction |
| 8. Audit and improve | Review data and update models | Continuous learning |
I also emphasize that human expertise remains central. The intelligent gear forging system should not hide its reasoning. Operators and engineers need to see why a parameter was changed. When the system recommends a change in forging pressure or cooling rate, it should display the predicted effect on tooth fill, hardness, and energy. This transparency builds trust and allows experienced staff to refine the model.
13. Mathematical Summary of Gear Forging Control
For convenience, I summarize the main mathematical relationships used in this article. The gear geometry equations are:
$$ d = m z $$
$$ d_a = m(z + 2) $$
$$ d_f = m(z – 2.5) $$
The forging flow stress equation is:
$$ \sigma = A \left[\sinh\left(\alpha \dot{\varepsilon}\right)\right]^{n} \exp\left(\frac{Q}{RT}\right) $$
The recrystallization equation is:
$$ X_{drx} = 1 – \exp\left[-0.693\left(\frac{\varepsilon – \varepsilon_c}{\varepsilon_{0.5} – \varepsilon_c}\right)^{k}\right] $$
The energy equation is:
$$ E_{total} = E_{heat} + E_{forge} + E_{trim} + E_{cool} + E_{inspect} + E_{rework} $$
The process capability equations are:
$$ C_p = \frac{USL – LSL}{6\sigma} $$
$$ C_{pk} = \min\left(\frac{USL – \mu}{3\sigma}, \frac{\mu – LSL}{3\sigma}\right) $$
The control chart limits are:
$$ UCL = \mu + 3\sigma, \quad LCL = \mu – 3\sigma $$
The multivariate control statistic is:
$$ T^2 = (\mathbf{x} – \overline{\mathbf{x}})^{T} \mathbf{S}^{-1} (\mathbf{x} – \overline{\mathbf{x}}) $$
The optimization objective is:
$$ \min_{\mathbf{u}} \mathbf{J}(\mathbf{u}) = \left[ E(\mathbf{u}), W_d(\mathbf{u}), -\eta_y(\mathbf{u}), -S_f(\mathbf{u}) \right]^{T} $$
These equations form a practical foundation for intelligent gear forging. They connect geometry, material behavior, process control, quality, and sustainability.
14. Conclusion
In this article, I have explained how intelligent manufacturing technologies can be applied to mechanical gear forging. Traditional gear forging depends heavily on operator experience and broad process windows, which limits precision, efficiency, and consistency. By contrast, intelligent gear forging integrates digital design, finite element simulation, genetic algorithm optimization, servo press control, robotic handling, machine vision, statistical process control, and digital twins. The experimental results show a 30% reduction in production time, a 23.5% reduction in energy per piece, a 27.6% reduction in dimensional tolerance, an 11.8% increase in tooth root fatigue strength, and an increase in yield from 92% to 97%. The case study confirms that an integrated gear forging line can improve efficiency, energy use, and quality qualification rate.
The broader lesson I draw is that intelligent gear forging is not only about replacing equipment. It is about creating a closed information loop around the gear forging process. When every billet, die, stroke, temperature, and inspection result is connected, the process becomes measurable, predictable, and improvable. This is the foundation for the next generation of gear forging. I believe that future gear forging systems will combine physics-based models, machine learning, real-time optimization, and human expertise to produce gears with higher fatigue life, lower cost, and lower environmental impact. The transformation will not happen overnight, but the direction is clear: intelligent gear forging is a practical pathway to higher quality, greater efficiency, and more sustainable manufacturing.