
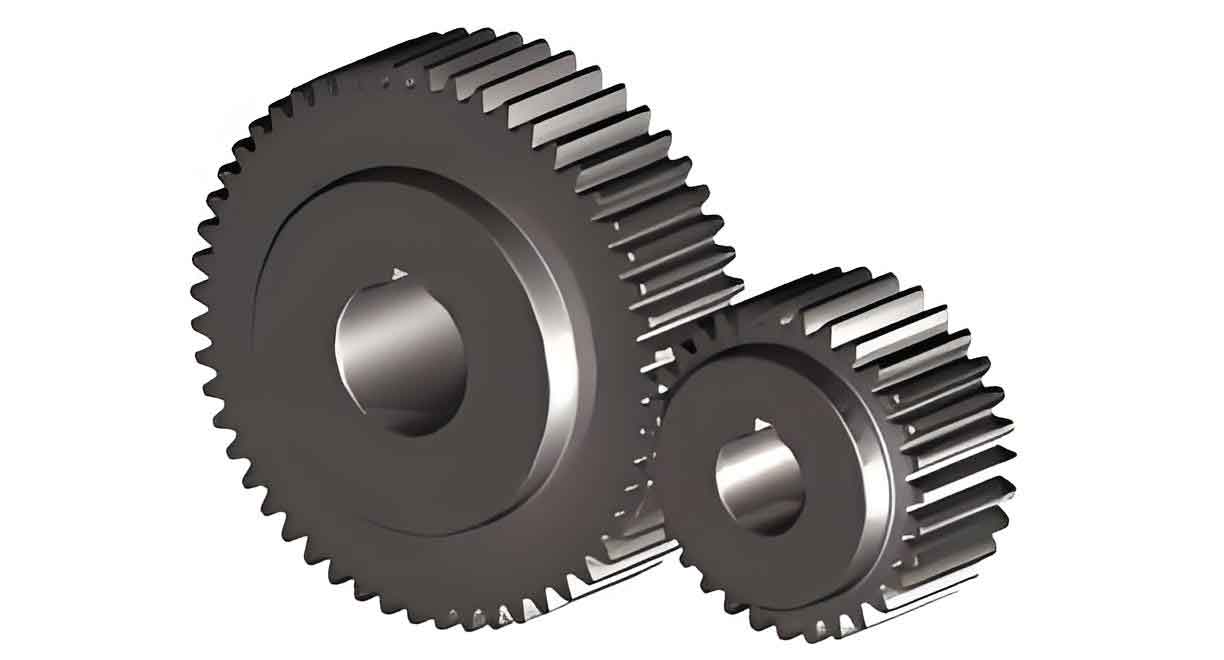
Gears are fundamental transmission components, categorized by their diameter. Among them, mega gears, typically defined as those with a diameter exceeding 3000 mm, are indispensable in heavy industries such as power generation, shipbuilding, and aerospace. The accurate measurement of their geometric errors is crucial for ensuring transmission performance and operational longevity. However, metrology for such large-scale spur gears presents significant challenges. Traditional high-precision instruments like large gear measuring centers or coordinate measuring machines (CMMs) are constrained by their physical measurement volume and prohibitive cost. For instance, even the largest available systems struggle to measure spur gears with diameters beyond 6000 mm in a single setup. Consequently, developing flexible, in-situ measurement techniques for mega spur gears has become a critical research focus.
Laser trackers, renowned for their large-volume measurement capability (often over 50 meters) and portability, offer a promising solution for in-situ mega gear inspection. This article introduces a novel, coordinate-system-free methodology for measuring tooth pitch deviation in mega spur gears using a laser tracker. The method bypasses the complex and error-prone process of establishing a precise workpiece coordinate system for the gear, which is a major source of inaccuracy in conventional large-gear measurement workflows. Instead, it directly measures the gear tooth spaces, enabling the evaluation of both single pitch deviation and total cumulative pitch deviation with enhanced practicality and potential accuracy.
1. Principle of Pitch Deviation Measurement with a Laser Tracker
Pitch deviation is a key parameter reflecting the uniformity of tooth spacing on a gear. For mega spur gears, the traditional measurement chain involves: 1) establishing a high-fidelity workpiece coordinate system aligned with the gear’s axis, 2) planning measurement paths based on this coordinate system, and 3) collecting and evaluating data. When using a laser tracker, this typically requires measuring the gear’s inner bore to fit its axis and measuring a reference face. However, the limited length of the bore, occlusion issues, and the laser tracker’s inherent distance-dependent uncertainty often result in a poorly defined workpiece coordinate system. The errors introduced in this initial alignment step can exceed the tolerance limits for pitch measurement in high-precision mega spur gears.
The proposed method circumvents this fundamental limitation. It exploits the geometric property that for a perfect spur gear, the line of contact between a measurement probe and the flank of a tooth within a single transverse plane is straight. Moreover, the relative distance and orientation between these lines on adjacent teeth are intrinsic to the gear and independent of any external coordinate system. Therefore, by directly measuring these “pitch lines” on the tooth flanks, the pitch deviation can be evaluated without the need for an absolute gear coordinate system.
The operational procedure is as follows:
- The laser tracker is positioned to the side of the mega spur gear, with its beam aimed roughly at the mid-face width of the gear teeth to optimize angular measurement symmetry.
- A spherically mounted retroreflector (SMR) or a specialized probing accessory is used as the tactile probe. The probe is manually or automatically guided to contact both flanks of a tooth space (the gap between two teeth) simultaneously.
- While maintaining dual-flank contact, the probe is moved along the tooth space, and the laser tracker records a sequence of 3D coordinate points. A straight line, termed the reference pitch line Li, is fitted to this point cloud representing the first measured tooth space.
- The probe is then moved to the adjacent tooth space. Again, under dual-flank contact, a second set of points is collected and fitted to a line, Li+1.
- For a mega gear with a very large diameter (e.g., > 6000 mm), the local tooth flank can be approximated as a plane. The distance from points on Li+1 to the reference line Li approximates the chordal pitch, which is virtually identical to the arc length pitch. The deviation of these distances from the theoretical pitch value constitutes the single pitch error.
Two specific metrics are defined:
- Maximum Single Pitch Deviation (fpt_max): The maximum absolute difference between the measured point-to-line distances and the theoretical pitch.
- Average Single Pitch Deviation (fpt_avg): The arithmetic mean of the absolute differences between the measured point-to-line distances and the theoretical pitch.
To measure the Total Cumulative Pitch Deviation (Fp), the laser tracker station is relocated (a process known as “station transfer” or “leapfrogging”) around the gear. Measurements of successive tooth spaces are linked through a common tooth space measured in both the old and new tracker positions, allowing the construction of a cumulative error profile across all teeth.
2. Mathematical Models for Pitch Deviation Evaluation
Let the theoretical transverse circular pitch be denoted as $p_t$. For a gear with module $m_n$, pressure angle $\alpha_n$, and helix angle $\beta$ (0° for spur gears), the transverse pitch is:
$$ p_t = \frac{\pi m_n}{\cos \beta} $$
For a spur gear, $\beta=0$, so $p_t = \pi m_n$.
2.1 Model for Direct, Coordinate-System-Free Measurement
After measuring tooth space $i$, a set of $n$ points $P_{i,k} (k=1,…,n)$ is obtained. A least-squares line $L_i$ is fitted. In 3D space, a line can be represented parametrically by a point $\mathbf{A}_i$ on the line and a direction vector $\mathbf{d}_i$:
$$ L_i: \mathbf{r} = \mathbf{A}_i + t \mathbf{d}_i, \quad t \in \mathbb{R} $$
where $\mathbf{d}_i$ is a unit vector ($||\mathbf{d}_i||=1$).
Subsequently, for the adjacent tooth space $i+1$, a set of $m$ points $Q_{i+1,l} (l=1,…,m)$ is measured. The signed perpendicular distance $d_{l}$ from a point $Q_{i+1,l}$ to the reference line $L_i$ is given by the formula:
$$ d_{l} = \frac{|| (\mathbf{Q}_{i+1,l} – \mathbf{A}_i) \times \mathbf{d}_i ||}{|| \mathbf{d}_i ||} = || (\mathbf{Q}_{i+1,l} – \mathbf{A}_i) \times \mathbf{d}_i || $$
Since $\mathbf{d}_i$ is a unit vector, the denominator is 1. The sign can be determined relative to a chosen normal direction, but for deviation calculation, the absolute value is often used.
The single pitch error for point $l$ is:
$$ \Delta p_{t,\ l} = d_{l} – p_t $$
The maximum single pitch deviation for this tooth pair is:
$$ f_{pt\_max}^{(i)} = \max_{l} | \Delta p_{t,\ l} | $$
The average single pitch deviation is:
$$ f_{pt\_avg}^{(i)} = \frac{1}{m} \sum_{l=1}^{m} | \Delta p_{t,\ l} | $$
2.2 Traditional Model with Workpiece Coordinate System (WCS)
This model highlights the complexity and error sources the new method avoids. Establishing the WCS involves:
- Axis Determination: Fit a cylinder to points measured on the inner bore. The axis direction vector $\mathbf{Z}_w=(l_l, m_l, n_l)$ and a point $\mathbf{O}_a=(x_0, y_0, z_0)$ on it are obtained.
- Reference Plane: Fit a plane $l_p x + m_p y + n_p z + d = 0$ to points on a gear face.
- Origin & Orientation: Find the intersection $\mathbf{O}_w$ of the axis with a plane through a measured tooth flank point $\mathbf{P}_f$ and perpendicular to $\mathbf{Z}_w$. The X-axis direction is roughly from $\mathbf{O}_w$ to $\mathbf{P}_f$, refined via cross-products: $\mathbf{Y}_w = \mathbf{Z}_w \times (\mathbf{P}_f – \mathbf{O}_w)$, $\mathbf{X}_w = \mathbf{Y}_w \times \mathbf{Z}_w$.
The transformation from the laser tracker coordinate system (LCS) to the gear WCS is an error-prone process involving multiple fitting operations. Any point $\mathbf{P}_{LCS}$ measured on a tooth flank is transformed to $\mathbf{P}_{WCS}$ before pitch is calculated based on its angular position, magnifying initial measurement noise and systematic errors.
3. Measurement Uncertainty Analysis via Monte Carlo Simulation
To quantify and compare the performance of the two measurement models, a Monte Carlo simulation is conducted. This method statistically evaluates measurement uncertainty by simulating thousands of measurement cycles with random noise applied according to the instrument’s error model.
3.1 Simulation Setup
A nominal (perfect) mega spur gear with the following parameters is defined:
| Parameter | Value |
|---|---|
| Module ($m_n$) | 45 mm |
| Number of Teeth ($z$) | 160 |
| Pressure Angle ($\alpha_n$) | 20° |
| Face Width | 500 mm |
| Pitch Diameter | 7200 mm |
The laser tracker is modeled with a typical uncertainty specification: $U = 15\ \mu m + 6\ \mu m/m$, where the distance $L$ is in meters. The error is assumed to follow a uniform distribution over its interval for simulation purposes. The tracker’s initial position is set at coordinates (5000, 0, 0) mm in its own frame for the WCS-based simulation, and at (1000, 0, 250) mm for the direct measurement simulation.
3.2 Results for Workpiece Coordinate System-Based Model
The simulation for WCS establishment involved measuring 100 points on a 7000 mm diameter end face and 100 points on the inner bore (10 sections, 10 points each over a 180° arc). The uncertainty in locating the coordinate system origin $\mathbf{O}_w$ after 1000 simulation runs was significant:
| Confidence Interval | Origin Offset Uncertainty |
|---|---|
| U95 (95%) | 101.5 µm |
| U99 (99%) | 126.3 µm |
This uncertainty stems solely from the coordinate system establishment process. When combined with the subsequent point measurement uncertainty for pitch evaluation, the total system error would be substantially larger. For an 8th-grade mega spur gear with a pitch diameter of 7200 mm, the tolerance for single pitch deviation $f_{pt}$ is approximately 80 µm. The WCS uncertainty alone exceeds this, confirming that the traditional approach is unsuitable for high-precision pitch measurement on such large spur gears.
3.3 Results for Direct, Coordinate-System-Free Measurement Model
For the direct method, the simulation involved measuring 200 points per tooth space under dual-flank contact conditions. The results for single pitch deviation are shown below:
| Evaluation Metric | U95 Uncertainty | U99 Uncertainty |
|---|---|---|
| Maximum Single Pitch Dev. ($f_{pt\_max}$) | 23.8 µm | 28.4 µm |
| Average Single Pitch Dev. ($f_{pt\_avg}$) | 3.0 µm | 4.8 µm |
The results demonstrate a clear advantage for the direct method. The $f_{pt\_avg}$ metric shows significantly lower uncertainty because it averages out random errors across the many measured points on the pitch line. According to the common metrology rule of thumb that measurement uncertainty should be less than one-third of the workpiece tolerance, this method is capable of measuring single pitch deviation for 8th-grade mega spur gears (tolerance ~80 µm).
3.4 Results for Total Cumulative Pitch Deviation ($F_p$)
Simulating the full $F_p$ measurement with station transfers (20 teeth measured per station) yielded the following system uncertainties:
| Evaluation Metric | U95 Uncertainty | U99 Uncertainty |
|---|---|---|
| Max. Cumulative Dev. ($F_{p\_max}$) | 179.0 µm | 208.7 µm |
| Avg. Cumulative Dev. ($F_{p\_avg}$) | 10.0 µm | 11.8 µm |
The $F_{p\_max}$ uncertainty accumulates with each station transfer and point measurement. For a 10th-grade gear of this size, the $F_p$ tolerance is roughly 718 µm. The simulated U95 uncertainty of 179 µm is below one-third of this tolerance (≈239 µm), indicating the method’s feasibility for measuring total cumulative pitch deviation on 10th-grade mega spur gears. The $F_{p\_avg}$ metric again shows remarkably low uncertainty, suggesting it is a more robust evaluation parameter for this method.
4. Conclusion and Discussion
This article has presented a novel, pragmatic methodology for measuring pitch deviations in mega spur gears using a laser tracker. The core innovation lies in abandoning the conventional—and for mega gears, highly inaccurate—step of constructing an absolute workpiece coordinate system. Instead, the method focuses on the intrinsic geometric relationship between adjacent tooth flanks, measuring them directly as spatial lines. The pitch error is then derived from the relative distances between these lines, approximated via the point-to-line distance formula, which is valid given the large radius of curvature of mega spur gears.
The mathematical models clarify the simplicity of the direct approach compared to the multi-stage, error-aggregating traditional model. Comprehensive Monte Carlo simulations provide strong evidence for the method’s capability. The results indicate that the direct measurement technique, particularly when using the average deviation metrics ($f_{pt\_avg}$ and $F_{p\_avg}$), can achieve measurement uncertainties that satisfy the requirements for evaluating 8th-grade single pitch deviation and 10th-grade total cumulative pitch deviation on spur gears exceeding 6000 mm in diameter.
The method offers several practical advantages: it simplifies the measurement procedure on the shop floor, reduces setup time, and minimizes error sources related to alignment. It transforms the laser tracker from a general-purpose large-volume metrology tool into a specialized, effective solution for a critical problem in mega gear inspection. Future work should focus on experimental validation on physical mega spur gears, development of automated or semi-automated probing strategies to ensure consistent dual-flank contact, and extension of the principle to other gear error types such as profile and helix deviations. This approach marks a significant step towards practical, high-precision, in-situ metrology for the giant spur gears that drive modern heavy industry.