
I treat the helical gear as a critical power-transmission element whose load capacity, surface durability, and fatigue life depend strongly on the carburizing quenching process. In my work, I combine parametric geometry generation, thermophysical property calculation, multi-physics finite element simulation, and process-parameter analysis. The central aim is to understand how carbon potential, diffusion time, and quenching oil temperature influence carbon distribution, phase transformation, stress evolution, strain rate, and hardness in a helical gear.
For a helical gear, the tooth surface is not a simple extruded profile. The involute helicoid, the root transition curve, and the helix angle all affect the local thermal and mechanical response. Therefore, I first establish a parameterized model of the helical gear. Then I calculate the material properties of a high-performance carburizing steel. After that, I build a two-dimensional single-tooth cross-section model for carburizing quenching. Finally, I compare multiple process cases and summarize how each parameter affects the helical gear performance.
Parametric Modeling of the Helical Gear
I begin with the manufacturing principles of a helical gear because the tooth profile generated by hobbing and shaping determines the geometric fidelity of the simulation. In hobbing, the cutter and the helical gear blank perform a coupled rotation that resembles the meshing of a worm and a gear. The cutter axis is inclined with respect to the gear axis, and the feed motion is synchronized with the rotation. In shaping, a rack-type cutter or a pinion-type cutter removes material along the tooth width while the blank rotates. Both methods can be interpreted through the envelope principle: the tooth surface of the helical gear is the envelope of a family of cutter surfaces.
For the involute part of the helical gear tooth, I use the standard involute relation. Let \(r_b\) be the base radius and \(\alpha_k\) the pressure angle at a point \(K\). The involute profile in polar form is
$$
r_k=\frac{r_b}{\cos\alpha_k},
$$
$$
\theta_k=\tan\alpha_k-\alpha_k.
$$
In a Cartesian coordinate system, the same involute can be written as
$$
x=r_b\left(\cos\theta+\theta\sin\theta\right),
$$
$$
y=r_b\left(\sin\theta-\theta\cos\theta\right),
$$
$$
z=0.
$$
For the root transition curve, I do not replace the fillet with a single circular arc. Instead, I derive the curve from the rack cutter tip. Let \(r_p\) be the cutter tip radius, \(a\) the distance from the cutter centerline to the center of the tip radius, and \(l\) the distance from the tip center to the tooth-space centerline. The transition curve can be expressed as
$$
x=r_p\sin\phi-\frac{a}{\sin\alpha’}\cos\left(\phi-\alpha’\right),
$$
$$
y=r_p\cos\phi-\frac{a}{\sin\alpha’}\sin\left(\phi-\alpha’\right).
$$
The angle relation is
$$
\phi=\frac{1}{\alpha’}\left(a\cot\alpha+l\right).
$$
For the helical gear tooth surface, the end-section profile is rotated and translated along the helix. If the end profile is \(x_0(u),y_0(u)\), then the helical surface is
$$
\mathbf{r}(u,\theta)=
\begin{bmatrix}
x_0(u)\cos\theta-y_0(u)\sin\theta\\
x_0(u)\sin\theta+y_0(u)\cos\theta\\
p\theta
\end{bmatrix},
$$
where \(p\) is the helix parameter and \(\theta\) is the rotation angle. The helix parameter is related to the helix angle \(\beta\) by
$$
p=\frac{r}{\tan\beta}.
$$
I use these equations to create a parameterized helical gear in a three-dimensional modeling environment. Table 1 lists the main modeling parameters and their expressions. The values can be changed without rebuilding the entire logic, which makes the helical gear model reusable for different sizes and ratios.
| Parameter | Symbol | Expression or meaning |
|---|---|---|
| Number of teeth | \(z\) | User-defined |
| Normal module | \(m_n\) | User-defined |
| Pressure angle | \(\alpha\) | User-defined |
| Helix angle | \(\beta\) | User-defined |
| Addendum coefficient | \(h_a^*\) | Usually 1.0 |
| Clearance coefficient | \(c^*\) | Usually 0.25 |
| Transverse module | \(m_t\) | \(m_t=m_n/\cos\beta\) |
| Addendum | \(h_a\) | \(h_a=h_a^*m_n\) |
| Dedendum | \(h_f\) | \(h_f=(h_a^*+c^*)m_n\) |
| Pitch diameter | \(d\) | \(d=m_t z\) |
| Base diameter | \(d_b\) | \(d_b=d\cos\alpha\) |
| Tip diameter | \(d_a\) | \(d_a=d+2h_a\) |
| Root diameter | \(d_f\) | \(d_f=d-2h_f\) |
| Helix parameter | \(p\) | \(p=r/\tan\beta\) |
| Involute offset | \(\Delta\theta\) | \(\Delta\theta=\frac{\pi m_t}{4r}-\tan\left(\arccos\frac{r_b}{r}\right)+\arccos\left(\frac{r_b}{r}\right)\) |
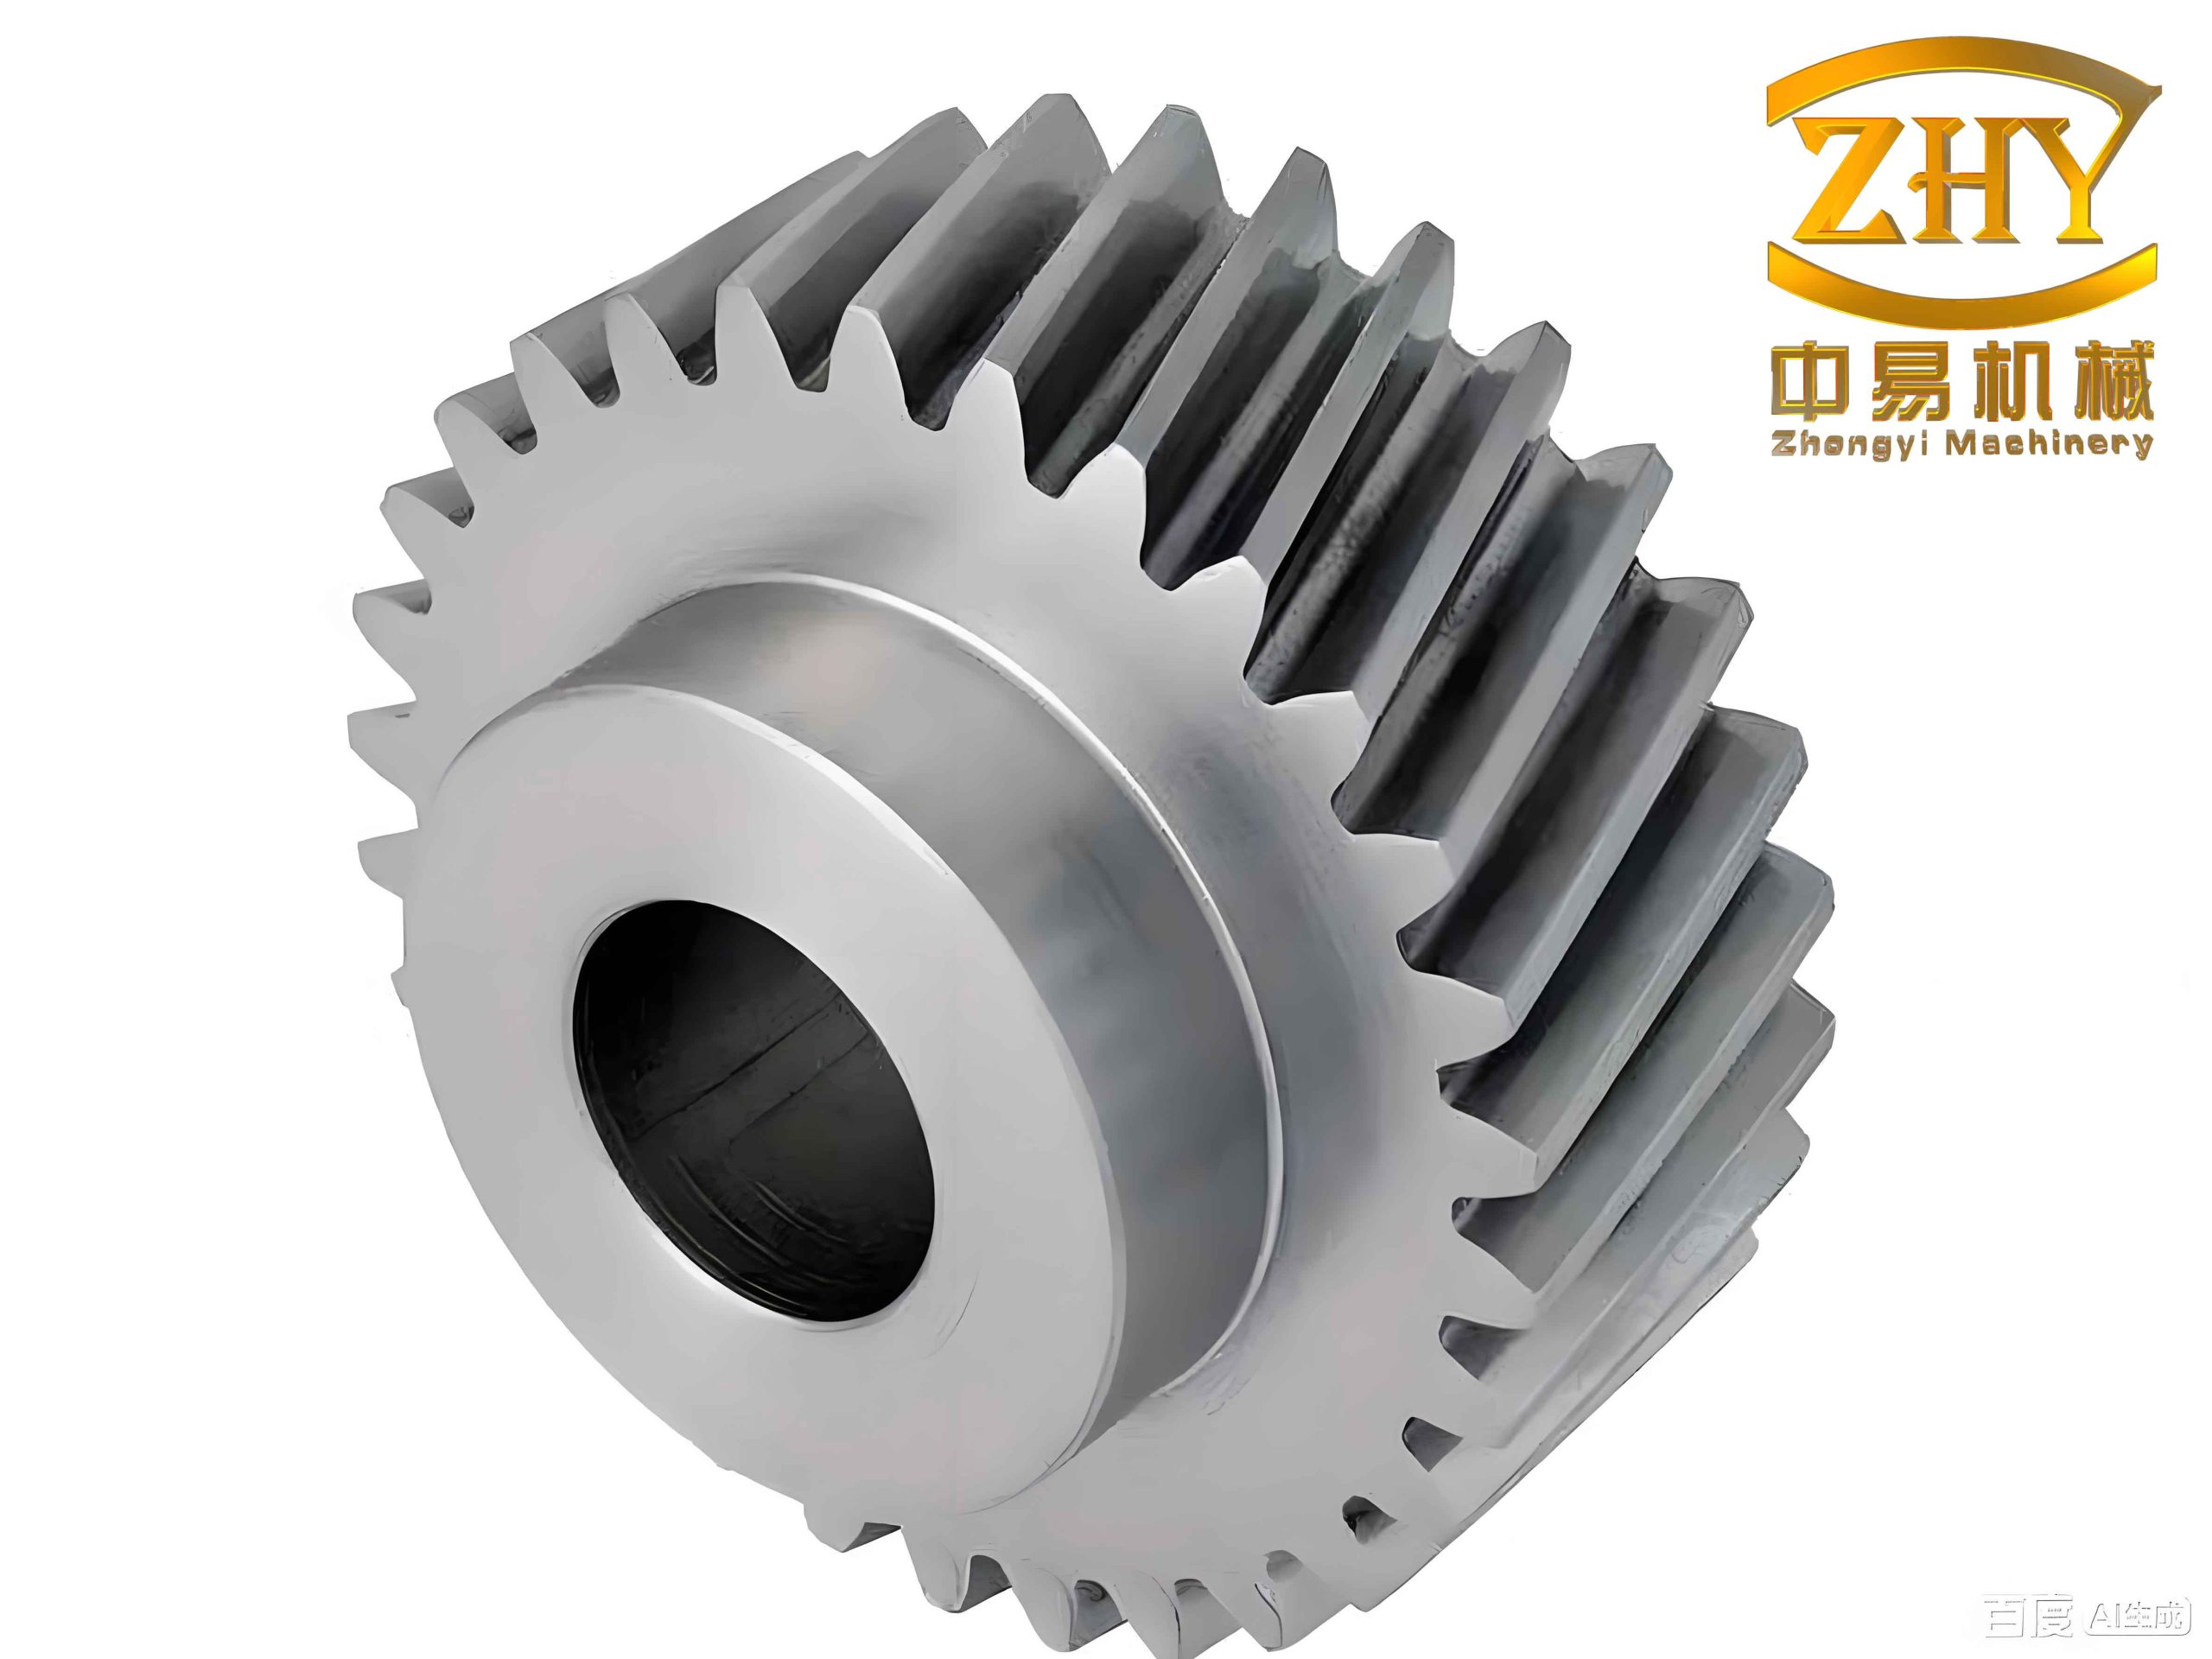
The parametric model allows me to control the helical gear geometry precisely before I transfer the cross-section to the heat-treatment simulation. I simplify one tooth into a two-dimensional section because the axial variation of the helical gear can be represented by the helix, while the local carburizing quenching response is dominated by the transverse section. This simplification preserves the important tooth flank, root, and core regions and greatly reduces the computational cost.
Carburizing Quenching Principles and Phase Transformation
In carburizing, I place the helical gear in a carbon-rich atmosphere at a temperature within the austenite range. Carbon atoms diffuse from the surface into the core. After sufficient diffusion, the surface carbon content is much higher than the core carbon content. The helical gear then undergoes quenching, during which austenite transforms into martensite if the cooling rate exceeds the critical cooling rate. The resulting helical gear has a hard, wear-resistant surface and a tougher core.
I describe the carbon diffusion process with Fick’s second law. In three dimensions,
$$
\frac{\partial C}{\partial t}=
D\left(
\frac{\partial^2 C}{\partial x^2}+
\frac{\partial^2 C}{\partial y^2}+
\frac{\partial^2 C}{\partial z^2}
\right).
$$
For one-dimensional diffusion into a semi-infinite body with a constant surface carbon potential \(C_p\), the solution can be written in terms of the complementary error function:
$$
C(x,t)=C_0+
\left(C_p-C_0\right)
\left[
\operatorname{erfc}\left(\frac{x}{2\sqrt{Dt}}\right)
–
\exp\left(\frac{\beta x+\beta^2 t}{D}\right)
\operatorname{erfc}\left(\frac{x}{2\sqrt{Dt}}+\beta\sqrt{\frac{t}{D}}\right)
\right].
$$
Here \(C_0\) is the initial carbon content, \(D\) is the diffusion coefficient, and \(\beta\) is the interface transfer coefficient. The temperature dependence of diffusion follows an Arrhenius form:
$$
D=D_0\exp\left(-\frac{Q_D}{RT}\right),
$$
$$
\beta=\beta_0\exp\left(-\frac{Q_\beta}{RT}\right).
$$
When the helical gear is heated and cooled, heat conduction and phase transformation occur together. I use the transient heat conduction equation:
$$
\rho c_p\frac{\partial T}{\partial t}=
\lambda\left(
\frac{\partial^2 T}{\partial r^2}+
\frac{1}{r}\frac{\partial T}{\partial r}+
\frac{\partial^2 T}{\partial x^2}
\right)+Q,
$$
where \(\lambda\) is thermal conductivity, \(\rho\) is density, \(c_p\) is specific heat, and \(Q\) includes latent heat and transformation heat. The convective boundary condition is
$$
-\lambda\frac{\partial T}{\partial n}=h\left(T_s-T_\infty\right),
$$
where \(h\) is the heat transfer coefficient, \(T_s\) is the surface temperature, and \(T_\infty\) is the medium temperature.
For phase transformation, I use kinetic relations to describe the austenite-to-martensite change. A general Avrami-type expression for transformation fraction is
$$
f=1-\exp\left[-k(T)t^n\right],
$$
where \(k(T)\) depends on temperature and \(n\) is the Avrami exponent. For martensite, the transformation is often treated as temperature-dependent rather than time-dependent. I use
$$
\zeta_M=1-\exp\left[
\psi_1 T+
\psi_2\left(C-C_0\right)+
\psi_{31}\sigma_m+
\psi_{32}\bar{\sigma}+
\phi_4
\right],
$$
where \(\zeta_M\) is the martensite fraction, \(T\) is temperature, \(C\) is local carbon content, \(\sigma_m\) is mean stress, \(\bar{\sigma}\) is equivalent stress, and the \(\psi\) terms are material constants. Table 2 lists representative critical transformation temperatures for the carburizing steel.
| Transformation | Ferrite | Pearlite | Bainite | Martensite |
|---|---|---|---|---|
| Start temperature, °C | 763.2 | 687.3 | 550.1 | 382.2 |
The chemical composition of the steel controls hardenability, Ms temperature, and martensite hardness. I use a low-carbon alloy steel with the composition summarized in Table 3. The carbon range is low enough to maintain core toughness, while the alloying elements provide sufficient hardenability for the helical gear.
| Element | C | Ni | Mn | Mo | Si | P | Cr | S |
|---|---|---|---|---|---|---|---|---|
| Content, wt.% | 0.08–0.13 | 3.00–3.35 | 0.45–0.65 | 0.08–0.15 | 0.20–0.35 | ≤0.025 | 1.00–1.40 | ≤0.025 |
I calculate the thermophysical properties of the steel as functions of temperature. The properties include density, Young’s modulus, Poisson’s ratio, specific heat, thermal conductivity, and thermal expansion coefficient. Table 4 gives representative values used in my simulation. These properties are not constant because the helical gear experiences a wide temperature range and multiple phase changes.
| Property | Representative value or trend |
|---|---|
| Density, kg/m³ | Decreases slightly with temperature |
| Young’s modulus, GPa | Decreases from about 210 to about 150 over the heating range |
| Poisson’s ratio | Increases gradually with temperature |
| Specific heat, J/(kg·K) | Increases with temperature and shows transformation peaks |
| Thermal conductivity, W/(m·K) | Decreases with temperature |
| Thermal expansion coefficient, 1/K | Increases with temperature |
I also compute the isothermal transformation diagram and the continuous cooling transformation behavior. These curves are essential because they tell me whether the helical gear will form martensite, bainite, pearlite, or retained austenite during quenching. The martensite start temperature decreases as carbon content increases. Therefore, the carburized surface layer of the helical gear may retain more austenite than the core after quenching.
The flow stress–strain behavior is equally important. I calculate true stress–strain curves at different temperatures and strain rates. In general, the flow stress decreases as temperature increases, and it increases as strain rate increases. Table 5 summarizes the qualitative trends I use in the finite element model.
| Variable | Effect on flow stress | Reason |
|---|---|---|
| Temperature increase | Flow stress decreases | Thermal softening and increased dislocation mobility |
| Strain rate increase | Flow stress increases | Less time for recovery and dislocation rearrangement |
| Strain increase | Flow stress increases then stabilizes | Work hardening followed by dynamic recovery |
| Carbon content increase | Strength and hardness increase | Solid solution strengthening and martensite hardening |
Multi-Physics Finite Element Model for the Helical Gear
I build the carburizing quenching model in a coupled multi-physics environment. The model includes the temperature field, the phase field, the stress–strain field, and the hardness field. Figure relationships among these fields are strongly coupled. Temperature controls diffusion and phase transformation. Phase transformation changes volume, latent heat, and hardness. Stress affects transformation plasticity and can influence diffusion. Hardness is a consequence of carbon content and phase fractions.
For the helical gear, I use a two-dimensional single-tooth cross-section. This approach is justified because the tooth repeats around the circumference, and the axial change is moderate for the thermal history. I import the cross-section, repair the boundary into composite edges, and create a solid domain. I then define the material properties, initial carbon content, carbon potential, and heat transfer coefficients.
The initial condition for carbon is
$$
C(x,y,0)=C_0.
$$
The carbon flux boundary at the exposed tooth surface is
$$
-D\nabla C\cdot \mathbf{n}=\beta\left(C_p-C_s\right).
$$
The thermal boundary is
$$
-\lambda\nabla T\cdot \mathbf{n}=h\left(T_s-T_\infty\right).
$$
The symmetry boundaries are zero-flux boundaries for both carbon and heat:
$$
\nabla C\cdot \mathbf{n}=0,
$$
$$
\nabla T\cdot \mathbf{n}=0.
$$
Table 6 lists the baseline process parameters I use for the helical gear simulation.
| Parameter | Baseline value |
|---|---|
| Initial carbon content, % | 0.20 |
| Atmosphere carbon potential, % | 0.75 |
| Carburizing temperature, °C | 900 |
| Carburizing time, h | 8 |
| Quenching oil temperature, °C | 80 |
| Quenching time, min | 15 |
| Considered phases | Austenite and martensite |
I use free quadrilateral mesh elements. The average element quality is about 0.67, and the total number of elements is about 7882. I refine the mesh near the tooth surface because the carbon gradient, thermal gradient, and stress gradient are steepest there. The mesh near the symmetry line can be coarser because the gradients are smaller.
The stress–strain response is calculated from the incremental strain decomposition:
$$
d\varepsilon_{ij}=
d\varepsilon_{ij}^{e}+
d\varepsilon_{ij}^{p}+
d\varepsilon_{ij}^{th}+
d\varepsilon_{ij}^{tr}+
d\varepsilon_{ij}^{tp}.
$$
The elastic strain is
$$
d\varepsilon_{ij}^{e}=
\frac{1+\nu}{E}d\sigma_{ij}-
\frac{\nu}{E}d\sigma_{kk}\delta_{ij}.
$$
The thermal strain is
$$
d\varepsilon_{ij}^{th}=
\sum_k m_k\alpha_k dT\,\delta_{ij}.
$$
The transformation strain is
$$
d\varepsilon_{ij}^{tr}=
\sum_k \beta_k^T dV_k\,\delta_{ij}.
$$
The transformation plastic strain is
$$
d\varepsilon_{ij}^{tp}=
3K_{ij}\left(1-V\right)dV\,\sigma_{ij}.
$$
The hardness is calculated from the mixture rule:
$$
H_e=\sum_i V_{fi}H_i.
$$
For martensite, I use an empirical hardness relation:
$$
HV_M=
127+949C+27Si+11Mn+8Ni+16Cr+21\log V.
$$
For retained austenite, the hardness contribution is reduced. I use
$$
HRC_{RA}=
\frac{1-0.2V_{RA}}{1+V_{RA}}.
$$
These equations allow me to predict the hardness gradient from the surface to the core of the helical gear.
Baseline Simulation Results for the Helical Gear
After the baseline simulation, I observe a clear carbon gradient in the helical gear. The surface carbon content reaches about 0.74%, while the core remains close to 0.21%. The carbon atoms diffuse from the surface toward the center, and the gradient is relatively smooth. This is consistent with the diffusion behavior expected during gas carburizing. Table 7 summarizes the baseline carbon distribution.
| Region | Carbon content, % | Observation |
|---|---|---|
| Surface | About 0.74 | Highest carbon concentration |
| Transition layer | 0.35–0.60 | Smooth decrease toward core |
| Core | About 0.21 | Close to initial carbon content |
The phase distribution shows that martensite is the dominant phase after quenching. The average martensite fraction is about 98.1%, and the average austenite fraction is about 1.95%. However, the very thin surface layer can contain more retained austenite because the carbon content is high and the martensite start temperature is low. In the transition layer, martensite becomes even more dominant. In the core, the phase is almost entirely martensite. Table 8 summarizes the phase fractions.
| Region | Austenite fraction, % | Martensite fraction, % |
|---|---|---|
| Surface layer | About 31.9 in a very thin layer | About 68.1 in the same thin layer |
| Overall average | 1.95 | 98.1 |
| Core | Near zero | Near 100 |
The stress field is complex. During quenching, the surface cools faster than the core. The surface tries to contract first, but the core restrains it. Later, the core transforms to martensite and expands, while the already hardened surface resists the expansion. As a result, the surface tends to be in compression, and the core tends to be in tension. I observe that the core stress is larger in magnitude than the surface stress. The strain rate is highest near the outer contour and decreases toward the inner contour.
The hardness gradient follows the carbon gradient and the martensite fraction. The surface hardness is much higher than the core hardness. The hardness decreases gradually from the surface to the core. The shape of the hardness curve is similar to the carbon concentration curve. Table 9 gives a qualitative summary of the hardness gradient.
| Depth from surface | Hardness trend | Main cause |
|---|---|---|
| 0–0.2 mm | Very high | High carbon and martensite |
| 0.2–0.6 mm | High and gradually decreasing | Decreasing carbon and martensite |
| 0.6–1.0 mm | Moderate | Transition toward core composition |
| Core | Lower, tough | Low carbon and fully martensitic or bainitic core |
Influence of Carbon Concentration on Helical Gear Performance
I now examine how the atmosphere carbon concentration affects the helical gear. I keep all other parameters fixed and change the carbon concentration from 0.70% to 1.00% in steps of 0.10%. Table 10 lists the four cases.
| Case | 1 | 2 | 3 | 4 |
|---|---|---|---|---|
| Carbon concentration, % | 0.70 | 0.80 | 0.90 | 1.00 |
As the atmosphere carbon concentration increases, the surface carbon content of the helical gear increases. The core carbon content changes only slightly and remains close to the initial value. The carbon profile becomes steeper near the surface, and the carburized depth increases slightly. Table 11 summarizes the observed trend.
| Carbon concentration | Surface carbon | Core carbon | Carburized depth |
|---|---|---|---|
| 0.70% | Lower | About 0.20% | Shallowest |
| 0.80% | Moderate | About 0.20% | Slightly deeper |
| 0.90% | Higher | About 0.20% | Deeper |
| 1.00% | Highest | About 0.20% | Deepest |
The martensite distribution is also affected. At higher carbon concentration, the surface carbon content increases, which lowers the martensite start temperature. Therefore, more retained austenite can remain in the surface layer after quenching. The core martensite fraction is less sensitive to the atmosphere carbon concentration. Table 12 summarizes the phase trend.
| Carbon concentration | Surface martensite | Surface retained austenite | Core martensite |
|---|---|---|---|
| 0.70% | Higher | Lower | Nearly unchanged |
| 0.80% | Moderate | Moderate | Nearly unchanged |
| 0.90% | Lower | Higher | Nearly unchanged |
| 1.00% | Lowest | Highest | Nearly unchanged |
The hardness gradient changes accordingly. At the surface, higher carbon concentration gives slightly higher hardness because the carbon content is higher. However, the effect is partly offset by the increase in retained austenite. Beyond about 0.5 mm, the hardness differences among cases become smaller. At the core, the hardness is almost independent of the atmosphere carbon concentration. Table 13 summarizes the hardness response.
| Carbon concentration | Surface hardness | Transition hardness | Core hardness |
|---|---|---|---|
| 0.70% | Lowest | Lowest | Nearly same |
| 0.80% | Slightly higher | Slightly higher | Nearly same |
| 0.90% | Higher | Higher | Nearly same |
| 1.00% | Highest | Highest | Nearly same |
I conclude that the atmosphere carbon concentration is a strong control variable for the surface carbon content and surface hardness of the helical gear. It has a weaker effect on the core. For a helical gear that requires high surface hardness and good wear resistance, a higher carbon concentration may be beneficial, but excessive carbon concentration can increase retained austenite and may reduce the effective hardness gain. Therefore, the carbon concentration should be selected together with the quenching conditions.
Influence of Carburizing Time on Helical Gear Performance
I next investigate the diffusion-stage carburizing time. I change the carburizing time from 9 h to 12 h in steps of 1 h while keeping the atmosphere carbon concentration and quenching oil temperature constant. Table 14 lists the cases.
| Case | 1 | 2 | 3 | 4 |
|---|---|---|---|---|
| Carburizing time, h | 9 | 10 | 11 | 12 |
When the diffusion stage has already reached the required duration, further increasing the carburizing time has only a small effect on the surface carbon content. The surface carbon content is mainly controlled by the atmosphere carbon potential. However, the overall carbon content increases slightly, and the carburized depth increases. The carbon gradient becomes somewhat smoother and extends deeper into the helical gear. Table 15 summarizes the trend.
| Carburizing time | Surface carbon | Overall carbon | Carburized depth |
|---|---|---|---|
| 9 h | Nearly same | Lower | Shallowest |
| 10 h | Nearly same | Slightly higher | Slightly deeper |
| 11 h | Nearly same | Higher | Deeper |
| 12 h | Nearly same | Highest | Deepest |
The martensite distribution shows a similar trend. The core phase fraction is almost unchanged. The surface phase fraction changes only slightly because the surface carbon content is already near the atmosphere carbon potential. The main difference is in the transition region, where a longer carburizing time produces a slightly deeper hardened layer. Table 16 summarizes the phase behavior.
| Carburizing time | Surface martensite | Transition martensite | Core martensite |
|---|---|---|---|
| 9 h | Nearly same | Lower | Nearly same |
| 10 h | Nearly same | Slightly higher | Nearly same |
| 11 h | Nearly same | Higher | Nearly same |
| 12 h | Nearly same | Highest | Nearly same |
The hardness gradient reflects the carbon and martensite changes. Because the surface carbon content does not change much, the surface hardness is almost the same for all cases. The deeper carburizing time increases the hardness at intermediate depths. The core hardness remains essentially unchanged. Table 17 summarizes the hardness trend.
| Carburizing time | Surface hardness | Transition hardness | Core hardness |
|---|---|---|---|
| 9 h | Nearly same | Lower | Nearly same |
| 10 h | Nearly same | Slightly higher | Nearly same |
| 11 h | Nearly same | Higher | Nearly same |
| 12 h | Nearly same | Highest | Nearly same |
I find that carburizing time is mainly a depth-control variable for the helical gear. Once the surface carbon content has reached the target, additional time does not strongly change the surface. It increases the depth of the hardened layer. This is important for a helical gear because a deeper case can improve load capacity, but excessive time increases cost and may coarsen the microstructure.
Influence of Quenching Oil Temperature on Helical Gear Performance
Finally, I study the quenching oil temperature. I change it from 70 °C to 100 °C in steps of 10 °C while keeping the carburizing parameters constant. Table 18 lists the cases.
| Case | 1 | 2 | 3 | 4 |
|---|---|---|---|---|
| Quenching oil temperature, °C | 70 | 80 | 90 | 100 |
When the quenching oil temperature is lower, the temperature difference between the helical gear and the oil is larger. The cooling rate is higher. Therefore, more austenite transforms to martensite, and the retained austenite fraction decreases. When the oil temperature is higher, the cooling rate is lower, and more austenite is retained. Table 19 summarizes the phase response.
| Oil temperature | Cooling rate | Martensite fraction | Retained austenite |
|---|---|---|---|
| 70 °C | Highest | Highest | Lowest |
| 80 °C | High | High | Moderate |
| 90 °C | Moderate | Moderate | Higher |
| 100 °C | Lowest | Lowest | Highest |
The stress field also changes. A lower oil temperature produces a larger thermal gradient and a larger volume change from martensite transformation. Therefore, the stress magnitude is higher. A higher oil temperature reduces the thermal gradient and the transformation rate, so the stress magnitude is lower. Table 20 summarizes the stress trend.
| Oil temperature | Thermal gradient | Stress magnitude | Distortion tendency |
|---|---|---|---|
| 70 °C | Highest | Highest | Highest |
| 80 °C | High | High | High |
| 90 °C | Moderate | Moderate | Moderate |
| 100 °C | Lowest | Lowest | Lowest |
The hardness gradient is less sensitive to oil temperature than to carbon concentration. Because the carburizing step controls the carbon profile, the surface hardness is similar among cases. However, the lower oil temperature gives a slightly higher surface hardness due to more complete martensite transformation. The difference decreases toward the transition layer and becomes negligible in the core. Table 21 summarizes the hardness trend.
| Oil temperature | Surface hardness | Transition hardness | Core hardness |
|---|---|---|---|
| 70 °C | Highest | Nearly same | Nearly same |
| 80 °C | Slightly lower | Nearly same | Nearly same |
| 90 °C | Lower | Nearly same | Nearly same |
| 100 °C | Lowest | Nearly same | Nearly same |
I conclude that quenching oil temperature is an important control variable for phase fractions, stress, and distortion of the helical gear. A lower oil temperature increases martensite and hardness but also increases stress and distortion risk. A higher oil temperature reduces stress but may leave more retained austenite. Therefore, the oil temperature should be chosen according to the required balance between hardness, toughness, and dimensional stability.
Comparative Assessment of Process Parameters
To compare the three parameters, I summarize their influence on the helical gear in Table 22. The comparison is qualitative but useful for process design. Carbon concentration has the strongest influence on surface carbon and surface hardness. Carburizing time has the strongest influence on case depth. Quenching oil temperature has the strongest influence on phase fractions, stress, and distortion.
| Process parameter | Surface carbon | Case depth | Martensite fraction | Stress | Hardness | Overall influence |
|---|---|---|---|---|---|---|
| Atmosphere carbon concentration | Strong | Moderate | Moderate | Moderate | Strong | High |
| Diffusion-stage carburizing time | Weak | Strong | Weak to moderate | Weak | Moderate | Moderate |
| Quenching oil temperature | Weak | Weak | Strong | Strong | Moderate | High |
I also note that these parameters interact. For example, a high carbon concentration plus a low oil temperature can produce very high surface hardness but also high stress and distortion. A long carburizing time plus a high carbon concentration can produce a deep case with high carbon, but may also increase retained austenite and cost. Therefore, the optimal process for a helical gear is not simply the maximum of each parameter. It is a balanced combination that satisfies surface hardness, core toughness, case depth, and distortion requirements.
Numerical Implementation Details
For reproducibility, I list the main numerical settings in Table 23. The model uses a transient solver. The time step is controlled automatically and is reduced during rapid quenching. The carbon diffusion and heat transfer equations are solved in a fully coupled manner with the phase transformation and stress equations. The convergence criterion is based on the residual of the coupled system.
| Item | Setting |
|---|---|
| Model dimension | 2D single-tooth cross-section of helical gear |
| Mesh type | Free quadrilateral |
| Average element quality | 0.67 |
| Number of elements | About 7882 |
| Time integration | Implicit transient |
| Coupling | Temperature, carbon, phase, stress, hardness |
| Hardness model | Volume-fraction mixture rule |
| Phase transformation | Austenite to martensite |
The carbon diffusion coefficient and interface transfer coefficient are temperature dependent. I use Arrhenius equations with prefactors and activation energies. The thermal properties are interpolated from the calculated property curves. The flow stress is interpolated from the true stress–strain data as a function of temperature and strain rate.
I also apply symmetry conditions on the centerline of the single tooth. The symmetry plane is adiabatic and zero-flux for carbon. The outer tooth surface is exposed to the carburizing atmosphere and the quenching oil. The root region is included because it is a critical fatigue location in a helical gear. The tooth tip is also included because it experiences the highest carbon flux and the steepest thermal gradient.
Interpretation and Practical Implications
The simulation results show that the carburizing quenching process creates a graded structure in the helical gear. The surface has high carbon, high hardness, and compressive residual stress. The core has lower carbon, higher toughness, and tensile residual stress. This graded structure is desirable because it improves wear resistance and bending fatigue strength. However, the residual stress and distortion must be controlled.
For a helical gear used in a reducer or transmission, the root fillet is often the critical region for bending fatigue. I observe that the root region experiences a complex stress history. During quenching, the root surface cools rapidly and tends to be in compression, while the core is in tension. After quenching, the residual stress distribution depends on the carbon profile and the phase fractions. A deeper case can increase the compressive stress at the root, which may improve fatigue life. However, excessive case depth can reduce core toughness.
The tooth flank is the critical region for contact fatigue. The surface hardness and carbon content are important for pitting resistance. I find that higher carbon concentration increases surface hardness, but also increases retained austenite. Retained austenite can transform to martensite under contact loading, which may cause dimensional changes or cracking. Therefore, the carbon concentration should not be too high. The quenching oil temperature also affects the amount of retained austenite. A lower oil temperature reduces retained austenite but increases stress.
I also consider the strain rate distribution. The strain rate is highest near the outer contour and decreases toward the inner contour. This is because the surface cools first and undergoes rapid thermal contraction and phase transformation. The core cools later and experiences a smaller strain rate. This gradient in strain rate contributes to the residual stress field.
Model Limitations and Possible Improvements
My current model has several limitations. First, I use a two-dimensional single-tooth cross-section. This simplification ignores the three-dimensional heat conduction along the tooth width and the helix angle. For a helical gear with a large helix angle, the axial temperature gradient may be significant. A three-dimensional model would capture this effect better. Second, I consider only austenite and martensite in the phase transformation. In reality, bainite, pearlite, and carbides may form depending on the cooling path. Third, I do not include the effect of external stress on diffusion and phase transformation. In practice, residual stress from prior manufacturing steps may affect the process. Fourth, I use calculated thermophysical properties rather than experimentally measured properties. Experimental validation would improve confidence.
To improve the model, I would add a three-dimensional helical gear model with a refined tooth surface mesh. I would include a full continuous cooling transformation diagram and a more complete phase transformation model. I would couple the stress effect on diffusion and transformation kinetics. I would also perform experiments to measure carbon profiles, hardness gradients, and residual stresses, and then calibrate the model against those measurements.
Summary of Findings
I summarize my main findings as follows. The carbon concentration of the atmosphere strongly controls the surface carbon content and surface hardness of the helical gear. Increasing the carbon concentration increases surface carbon and hardness, but also increases retained austenite. The carburizing time mainly controls the case depth. Once the surface carbon has reached the target, additional time deepens the case without greatly changing the surface carbon. The quenching oil temperature strongly controls the martensite fraction, stress, and distortion. A lower oil temperature increases martensite and hardness but also increases stress. A higher oil temperature reduces stress but leaves more retained austenite.
The coupled numerical model provides a useful tool for understanding the carburizing quenching of a helical gear. It allows me to compare process parameters without performing a large number of physical experiments. The results can guide the selection of carbon concentration, carburizing time, and quenching oil temperature in industrial production. The model can also be extended to other gear geometries and other carburizing steels.
In my view, the most important practical conclusion is that process parameters should be optimized together. The best surface hardness is not achieved by simply increasing carbon concentration or decreasing oil temperature. A balanced process must consider carbon profile, phase fractions, residual stress, distortion, and cost. For a helical gear, the goal is a deep enough case with high surface hardness, sufficient core toughness, and acceptable distortion. My simulations show that this balance can be explored efficiently with a multi-physics finite element model.
Overall, I have established a complete workflow for the numerical simulation and parameter analysis of carburizing quenching for a helical gear. I started from parametric tooth geometry, calculated the thermophysical properties of the steel, built a coupled finite element model, and analyzed the effects of carbon concentration, carburizing time, and quenching oil temperature. The workflow can be used to support process design and to reduce the trial-and-error cost of heat treatment for helical gears.