
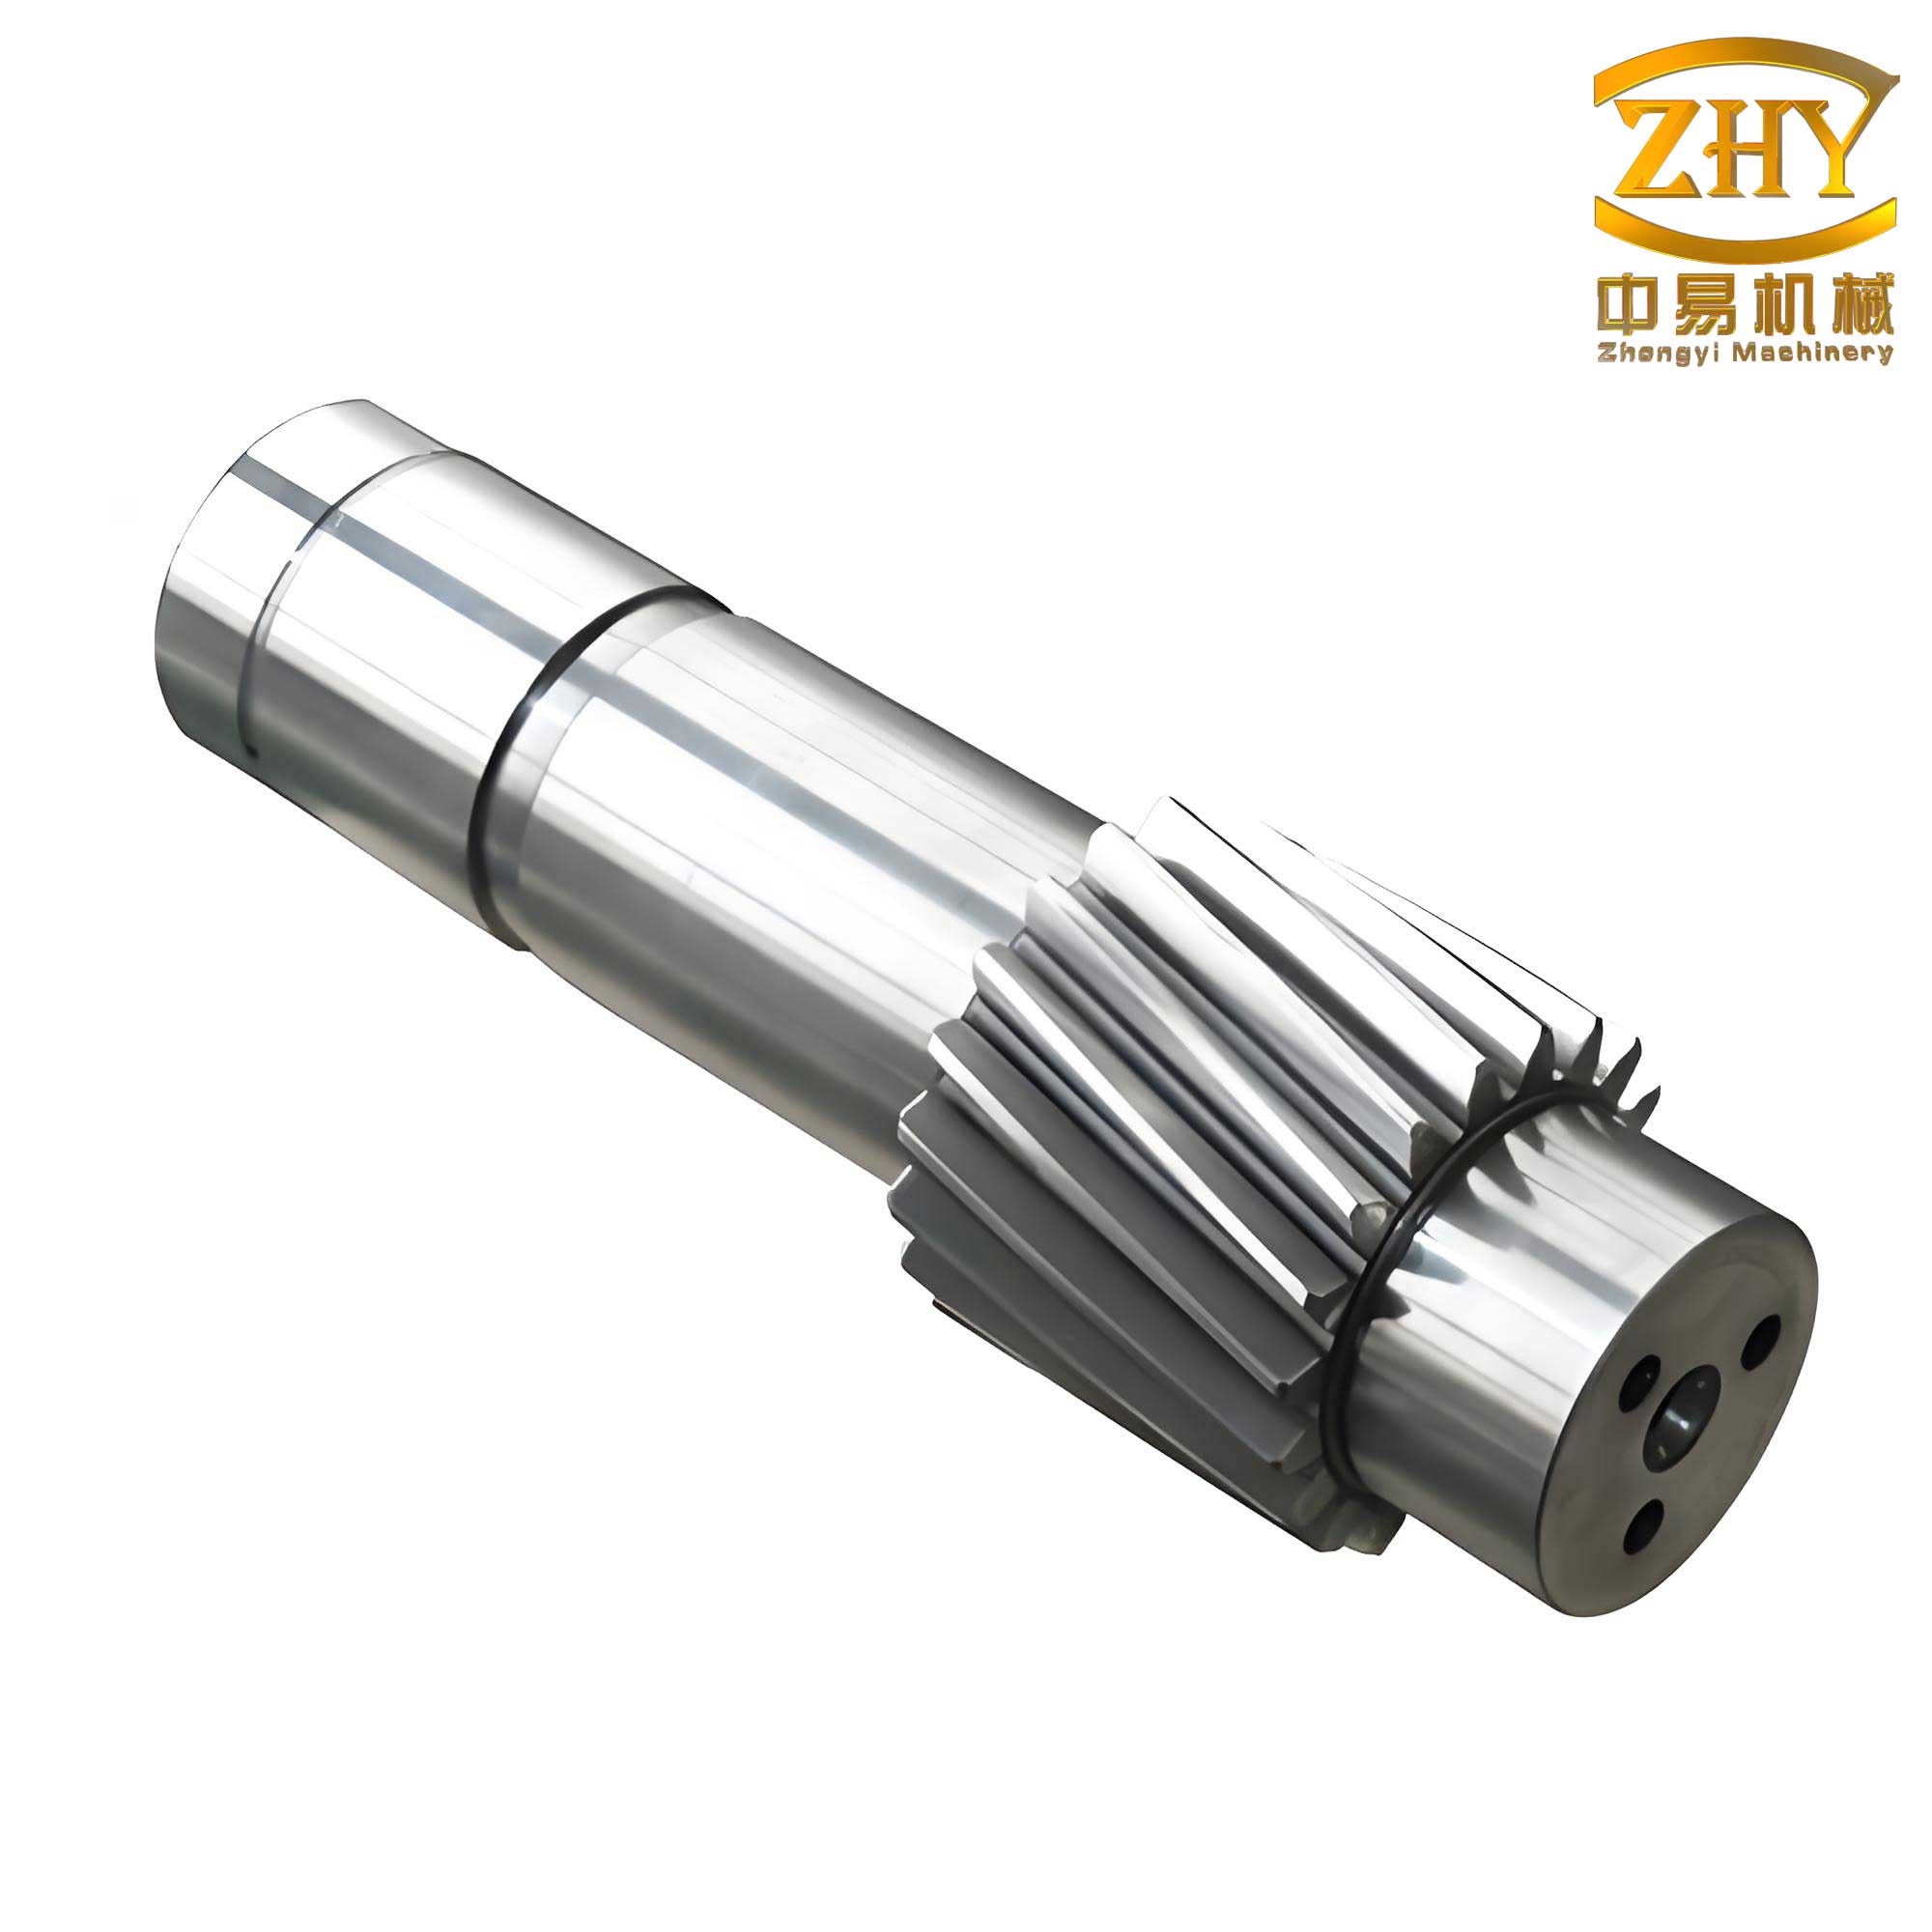
The pursuit of automotive lightweighting is a critical strategy for enhancing fuel efficiency and reducing environmental impact. Among various components, the transition from solid to hollow gear shafts presents a significant opportunity for weight reduction while maintaining or even improving torsional strength. Rotary forging, an incremental forging process, is particularly suited for manufacturing near-net-shape hollow profiles like gear shafts due to its high precision, material efficiency, and flexibility. This article details a comprehensive methodology for optimizing the rotary forging process of hollow gear shafts through integrated finite element simulation, Design of Experiments (DoE), and physical validation.
1. Material and Methodology
The base material selected for the hollow gear shaft preform is 27MnCr5 steel, a low-alloy steel commonly used for high-strength automotive components. Its chemical composition is critical for achieving the desired mechanical properties post-forging.
1.1 Finite Element Modeling and Orthogonal Array Design
The process optimization was conducted using the commercial finite element software Forge. A thermo-mechanically coupled model was developed to simulate the rotary forging process. The constitutive behavior of the 27MnCr5 steel at high temperatures and strain rates is often described by a Hansel-Spittel type equation, which captures the flow stress dependence on strain, strain rate, and temperature:
$$ \sigma_f = A e^{m_1 T} \varepsilon^{m_2} \dot{\varepsilon}^{m_3} e^{\frac{m_4}{\varepsilon}} (1 + \varepsilon)^{m_5 T} e^{m_7 \varepsilon} \dot{\varepsilon}^{m_8} T^{m_9} $$
Where $\sigma_f$ is the flow stress, $\varepsilon$ is the strain, $\dot{\varepsilon}$ is the strain rate, $T$ is the temperature, and $A$, $m_1$…$m_9$ are material constants.
To systematically investigate the influence of key process parameters and identify the optimal combination, an Orthogonal Array (OA) Design was employed. Five factors were identified as having significant influence on forming quality, particularly on defects like folds and spiral surface marks. The factors and their levels are presented in Table 1.
| Level | A: Billet Temp. (°C) | B: Axial Feed (mm) | C: Billet Speed (rpm) | D: Hammer Stroke (mm) | E: Hammer Speed (mm/s) |
|---|---|---|---|---|---|
| 1 | 750 | 0.05 | 50 | 2.0 | 7.5 |
| 2 | 780 | 0.10 | 60 | 2.5 | 10.0 |
| 3 | 800 | 0.30 | 70 | 3.0 | 12.0 |
| 4 | 830 | 0.50 | 76 | 3.5 | 15.0 |
A standard $L_{16}(4^5)$ orthogonal array was selected, resulting in 16 simulation runs. The output responses were quantified using two indices: the number of folding defects (n) and the severity of spiral marks (h), both graded on a scale from 0 to 2.
2. Analysis of Simulation Results and Process Optimization
The results from the 16 FE simulations based on the orthogonal array are summarized in Table 2. To analyze these results, the average response ($k_i$) for each factor at each level and the range ($R$) for each factor were calculated. The range indicates the factor’s influence magnitude; a larger $R$ signifies a greater impact on the response.
| Run No. | A | B | C | D | E | n (Folds) | h (Spiral Marks) |
|---|---|---|---|---|---|---|---|
| 1 | 1 | 1 | 1 | 1 | 1 | 0 | 0 |
| 2 | 1 | 2 | 2 | 2 | 2 | 1 | 1 |
| 3 | 1 | 3 | 3 | 3 | 3 | 2 | 1 |
| 4 | 1 | 4 | 4 | 4 | 4 | 2 | 2 |
| 5 | 2 | 1 | 2 | 3 | 4 | 2 | 0 |
| 6 | 2 | 2 | 1 | 4 | 3 | 2 | 1 |
| 7 | 2 | 3 | 4 | 1 | 2 | 0 | 1 |
| 8 | 2 | 4 | 3 | 2 | 1 | 1 | 2 |
| 9 | 3 | 1 | 3 | 4 | 2 | 2 | 2 |
| 10 | 3 | 2 | 4 | 3 | 1 | 1 | 1 |
| 11 | 3 | 3 | 1 | 2 | 4 | 2 | 1 |
| 12 | 3 | 4 | 2 | 1 | 3 | 2 | 2 |
| 13 | 4 | 1 | 4 | 2 | 3 | 0 | 0 |
| 14 | 4 | 2 | 3 | 1 | 4 | 0 | 0 |
| 15 | 4 | 3 | 2 | 4 | 1 | 2 | 1 |
| 16 | 4 | 4 | 1 | 3 | 2 | 2 | 2 |
The calculated average responses and ranges for both quality indices are consolidated in Table 3. This table is fundamental for determining the primary and secondary order of influencing factors and for selecting the optimal level for each factor.
| Metric | Factor | ||||
|---|---|---|---|---|---|
| A | B | C | D | E | |
| $k_1$ (n) | 1.25 | 1.00 | 1.50 | 0.50 | 1.00 |
| $k_2$ (n) | 1.25 | 1.00 | 1.75 | 1.00 | 1.25 |
| $k_3$ (n) | 1.75 | 1.50 | 1.25 | 1.75 | 1.50 |
| $k_4$ (n) | 1.00 | 1.75 | 0.75 | 2.00 | 1.50 |
| Range R (n) | 0.75 | 0.75 | 1.00 | 1.50 | 0.50 |
| Primary Order (n) | D > C > A = B > E | ||||
| $k_1$ (h) | 1.00 | 0.50 | 1.00 | 0.75 | 1.00 |
| $k_2$ (h) | 1.00 | 0.75 | 1.00 | 1.00 | 1.50 |
| $k_3$ (h) | 1.50 | 1.00 | 1.25 | 1.00 | 1.00 |
| $k_4$ (h) | 0.75 | 2.00 | 1.00 | 1.50 | 0.75 |
| Range R (h) | 0.75 | 1.50 | 0.25 | 0.75 | 0.75 |
| Primary Order (h) | B > A = D = E > C | ||||
Analysis of the data leads to the following conclusions for optimizing the hollow gear shaft process:
- Factor A (Billet Temperature): For both indices, level A4 (830°C) yields the best results (lowest average $k_4$ values).
- Factor B (Axial Feed): Level B1 (0.05 mm) is optimal as it minimizes spiral marks (h), while also providing good performance against folding.
- Factor C (Billet Speed): Level C4 (76 rpm) is chosen as it minimizes folds (n) and performs satisfactorily for spiral marks.
- Factor D (Hammer Stroke): Level D1 (2.0 mm) is clearly optimal, producing the fewest folds and relatively low spiral marks.
- Factor E (Hammer Speed): Level E1 (7.5 mm/s) is selected as it provides a good compromise, minimizing folds and keeping spiral marks low.
Therefore, the optimal process parameter combination derived from the orthogonal experiment analysis is: A4B1C4D1E1, corresponding to a billet temperature of 830°C, an axial feed of 0.05 mm, a billet rotation speed of 76 rpm, a hammer radial stroke of 2.0 mm, and a hammer radial speed of 7.5 mm/s. This parameter set was used to produce trial hollow gear shafts on a GFM precision forging machine for physical validation.
3. Physical Validation: Microstructure and Microhardness
To validate the simulation-based optimization, physical trial gear shafts were produced using the optimal parameters. Microstructural analysis and microhardness testing were conducted on cross-sections taken from critical regions, such as stepped sections and sizing zones, to assess the quality imparted by the rotary forging process.
3.1 Microstructural Evolution
Examination via Scanning Electron Microscopy (SEM) revealed significant grain refinement and the development of a fibrous microstructure, which is highly desirable for improving the mechanical properties of gear shafts. The deformation is not uniform through the cross-section:
- Subsurface Region: Immediately below the surface, a zone of slightly coarser grains was sometimes observed. This can be attributed to the complex state of stress at the tool-workpiece interface, where high frictional forces and chilling effects may retard complete recrystallization or lead to grain growth in the warm forging regime.
- Central Bulk Region: The majority of the material exhibited a pronounced fibrous structure. The original equiaxed grains were elongated in the direction of metal flow (primarily axial). The degree of grain refinement increased with the total applied strain. In regions corresponding to larger diameter reductions (e.g., the second step of the shaft), the fibrous structure was more pronounced and the grain boundaries were more elongated compared to regions with less reduction (e.g., the first step). The relationship between grain size ($d$) and strain ($\varepsilon$) can often be described by an exponential decay function: $$ d = d_0 \cdot e^{-k \varepsilon} $$ where $d_0$ is the initial grain size and $k$ is a material constant.
- Material Consolidation: In areas where metal flow was restricted or converging, such as near internal mandrel steps, the rotary forging process effectively consolidated the material, eliminating porosity and creating a very dense, fine-grained microstructure crucial for the fatigue life of gear shafts.
3.2 Microhardness Distribution
Microhardness (HV) mapping across the cross-section of the forged hollow gear shaft provides a direct correlate to the strain distribution and microstructural changes. Hardness profiles were measured from the inner diameter (ID) near the mandrel to the outer diameter (OD).
The general trend observed can be summarized by the following points, which highlight the inhomogeneous deformation characteristic of the process:
- Gradient from ID to OD: A distinct hardness gradient was present. The highest hardness values were typically recorded near the inner surface. This is attributed to two main factors: (1) The highest shear strains and metal flow velocities often occur in the material layers in direct contact with or adjacent to the rotating mandrel. (2) The cooling effect from the mandrel, which may have internal cooling channels, rapidly quenches the inner layer, suppressing recovery and recrystallization, thereby preserving a work-hardened state.
- Effect of Sizing (Calibration): Regions of the shaft that underwent a final sizing or calibration stroke showed a more uniform and generally higher microhardness compared to the adjacent forged steps. This final deformation further homogenizes and compacts the microstructure, leading to increased strength. The increase in yield strength ($\Delta \sigma_y$) due to work hardening can be related to the dislocation density ($\rho$) through the Taylor equation: $$ \Delta \sigma_y = \alpha G b \sqrt{\rho} $$ where $\alpha$ is a constant, $G$ is the shear modulus, and $b$ is the Burger’s vector.
- Comparison of Step Regions: The surface hardness on the second step (which underwent a greater total radial reduction than the first step) was measurably higher than that on the first step. This directly correlates with the greater effective strain imposed on the second step, leading to more significant strain hardening and grain refinement, which is a key advantage in designing high-performance gear shafts with locally tailored properties.
4. Conclusion
The integrated approach of finite element simulation, structured Design of Experiments (Orthogonal Array), and physical validation proved highly effective for optimizing the rotary forging process of hollow gear shafts. The following key conclusions were drawn:
- The optimal process parameters for minimizing defects (folds and spiral marks) in the rotary forging of 27MnCr5 steel hollow gear shafts were identified as: a billet temperature of 830°C, an axial feed of 0.05 mm, a billet speed of 76 rpm, a hammer stroke of 2.0 mm, and a hammer speed of 7.5 mm/s.
- Rotary forging successfully produces a refined fibrous microstructure in the gear shaft, enhancing its density and mechanical properties. The grain refinement follows an exponential relationship with the imposed strain, with the most pronounced effects in high-reduction zones and the material bulk.
- Microhardness distributions serve as an effective proxy for mapping strain heterogeneity. The process naturally creates a hardness gradient from the ID to the OD, with the highest values at the ID due to high shear strains and quenching. Final sizing operations increase hardness uniformity. The surface hardness correlates directly with the local deformation level, confirming that areas of greater reduction (like subsequent steps on the gear shaft) achieve higher strength.
This methodology provides a robust framework for the development and optimization of advanced forging processes for critical lightweight components such as hollow gear shafts, ensuring superior product quality and performance.