
As a researcher deeply involved in precision gear manufacturing, I have always been fascinated by the finishing process of gear honing. Specifically, the internal gear power honing process presents a compelling alternative to traditional methods like worm gear grinding, offering advantages such as higher contact ratios and, critically, the elimination of burn marks on the gear tooth surface. The quality, efficiency, and cost of the honing process are intrinsically linked to one fundamental physical parameter: the gear honing force. This force, particularly its radial component, dictates the depth of material removal and directly influences the final surface integrity of the workpiece. Therefore, the ability to accurately predict this force is paramount for process optimization.
Traditional models for predicting machining forces, such as the exponential empirical formula, have served well in conventional cutting operations. However, the complex kinematics and multi-parameter interactions in internal gear honing demand more sophisticated approaches. In our work, we explore and compare two distinct methodologies for predicting the radial honing force: a data-driven Backpropagation (BP) Neural Network model and a classical exponential model. This article details our experimental investigation, the development of these predictive models, and a comparative analysis of their performance and practicality.
Mechanics and Analysis of Internal Gear Power Honing
The internal gear power honing process is essentially based on the meshing principle of a pair of crossed helical gears. A honing wheel, which is a threaded internal gear dressed with abrasive grains, meshes with the external helical workpiece gear. Their axes are set at a specific crossing angle. During the process, both the honing wheel and the workpiece are independently driven by servomotors but maintain a strict electronic gear ratio to ensure synchronized motion. This combination of rolling and sliding motions allows the abrasive grains to cut and finish the tooth flank surface. The resulting honing force vector can be decomposed into three primary components relative to the workpiece: the radial force ($$F_r$$), the circumferential force ($$F_s$$), and the axial force ($$F_a$$).
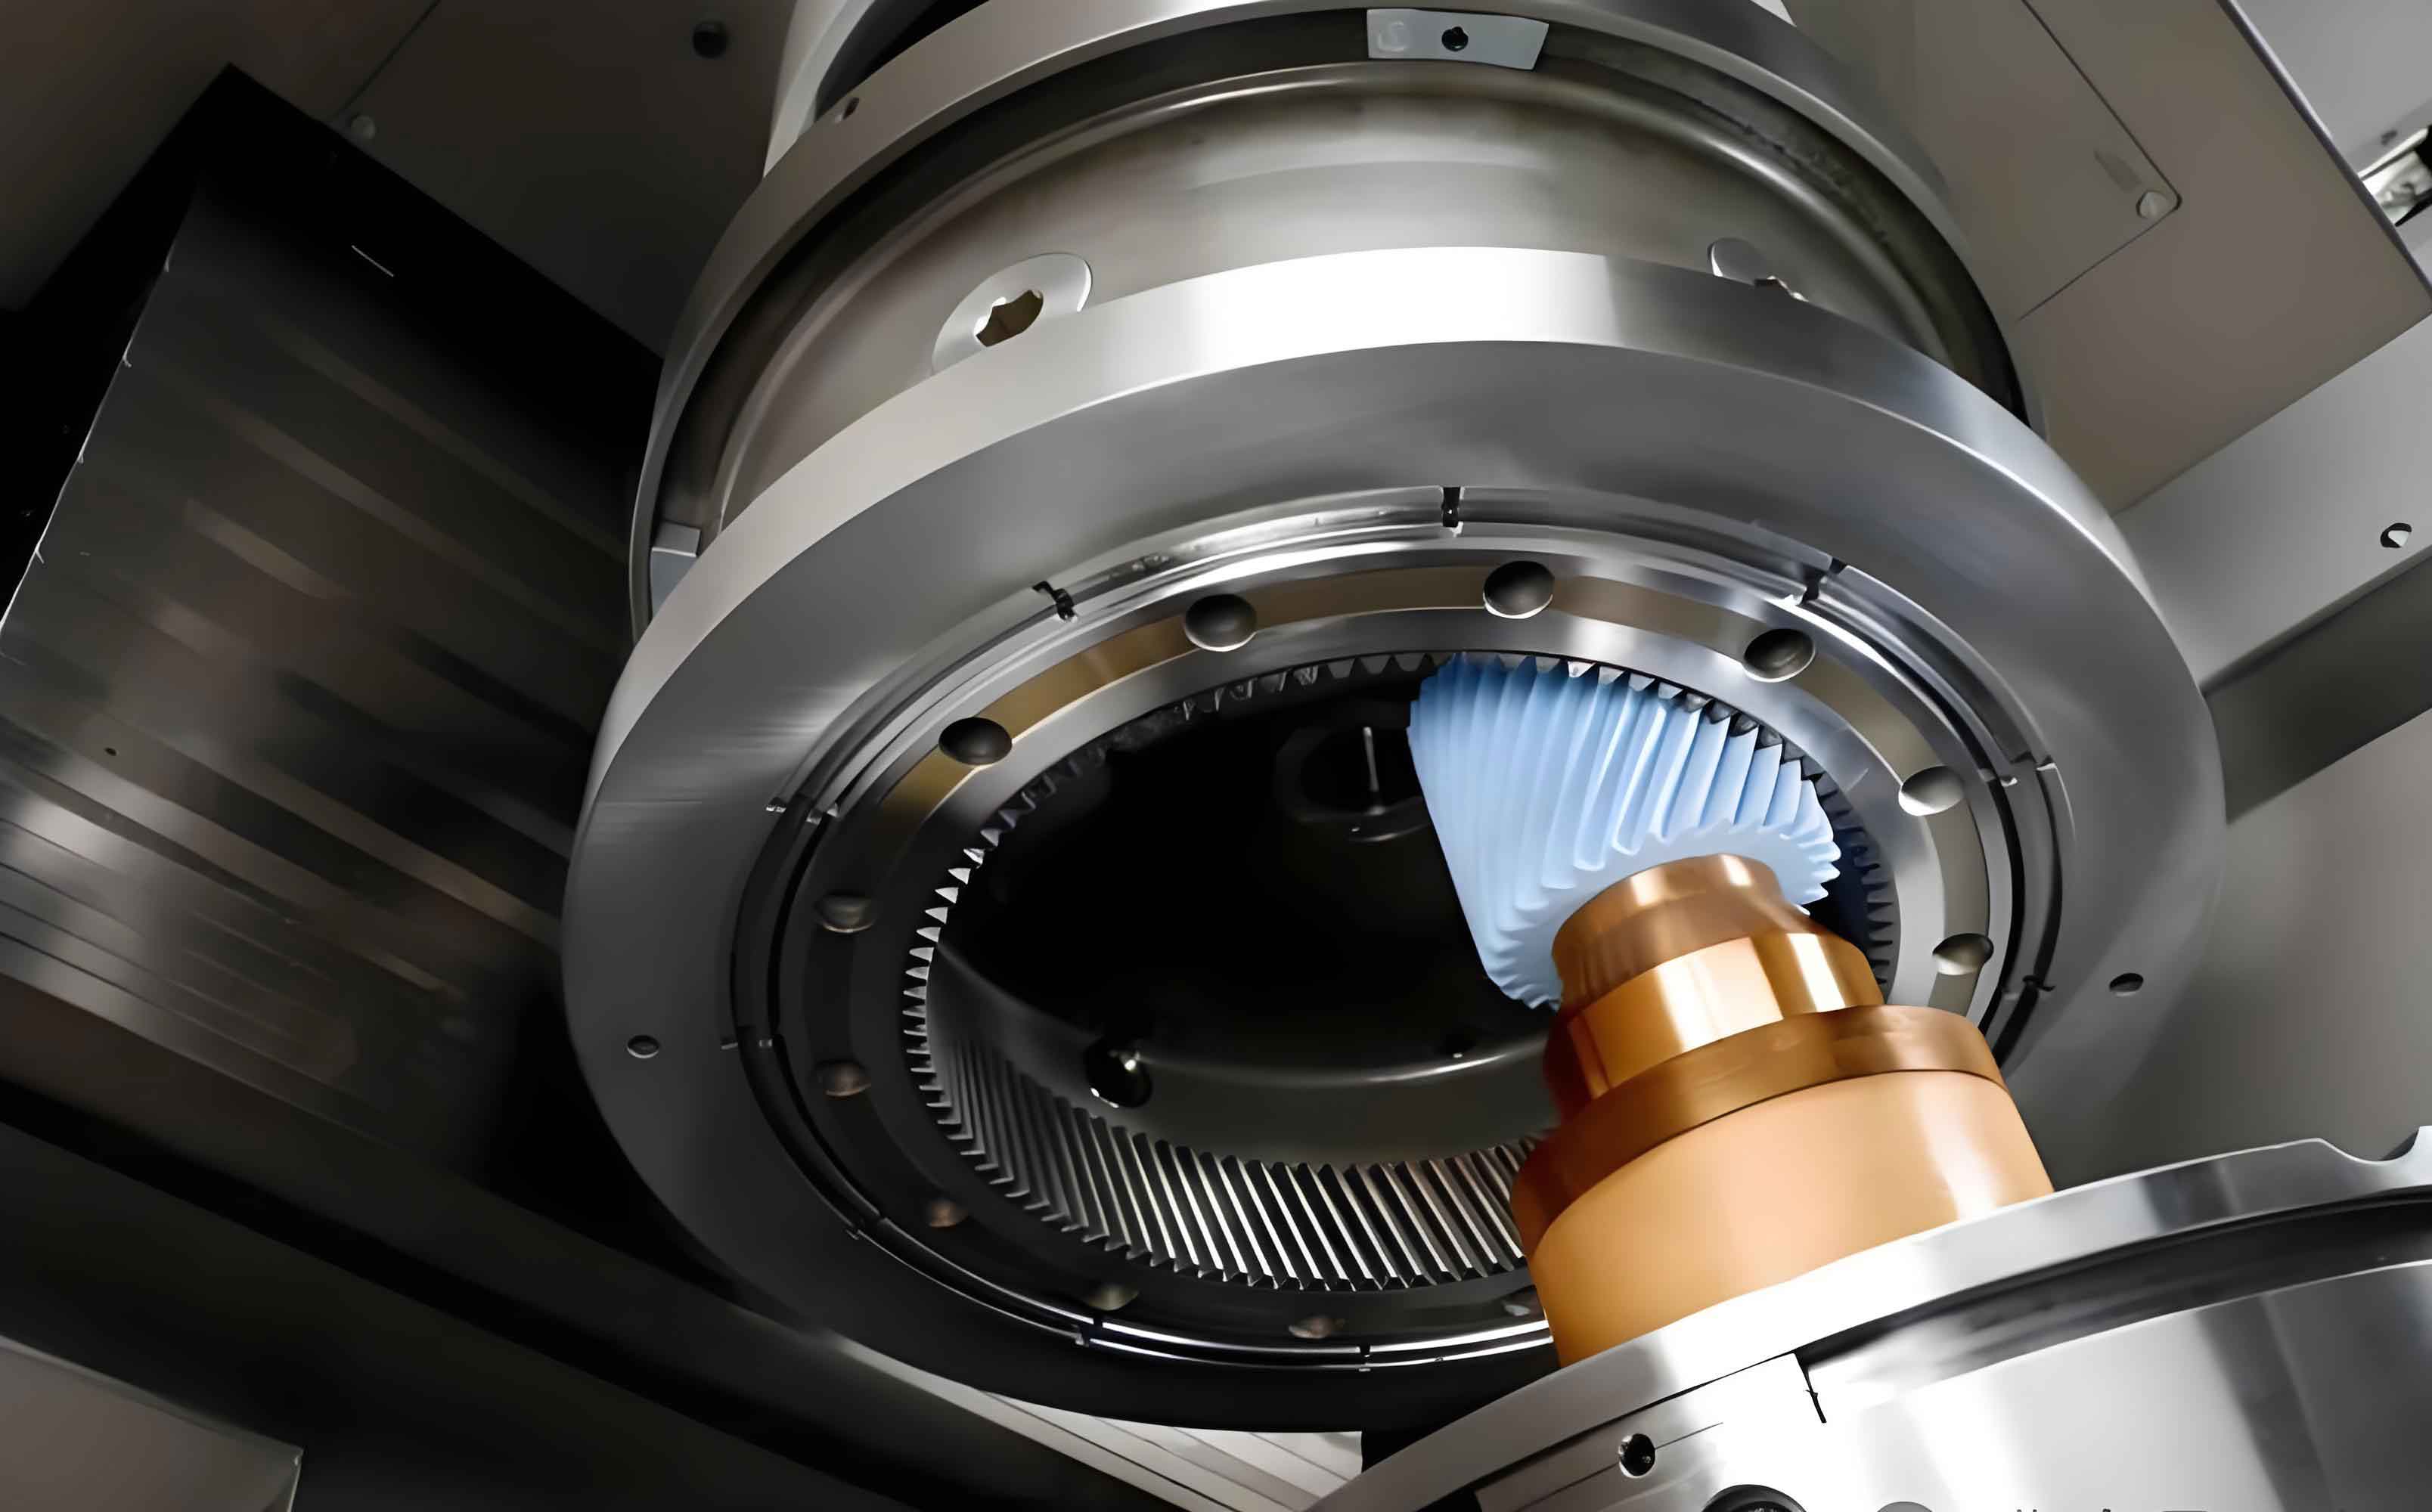
The relationship between these components is governed by the gear geometry:
$$
F_s = \frac{F_r \cos\beta}{\tan\alpha_n}, \quad F_a = \frac{F_r \sin\beta}{\tan\alpha_n}
$$
where $$ \beta $$ is the helix angle of the workpiece gear and $$ \alpha_n $$ is the normal pressure angle at the pitch circle. As evident from these equations, $$F_s$$ and $$F_a$$ are geometrically determined once $$F_r$$ is known. The radial force $$F_r$$ is the primary indicator of the cutting depth and is the most significant factor affecting the overall machining load. Therefore, our predictive modeling focuses on accurately estimating the radial honing force $$F_r$$.
Conceptually, gear honing is a low-speed grinding process. Thus, its mechanics can be analogized using the classic “grinding three elements”: cutting speed, depth of cut, and feed rate. In the context of internal power honing, these correspond to specific machine axes:
1. Cutting Speed: Primarily governed by the workpiece spindle speed (denoted as $$C_2$$, in rpm).
2. Depth of Cut: Controlled by the radial infeed per stroke of the honing wheel (denoted as $$f_x$$, in μm/stroke).
3. Feed Rate: Corresponds to the axial traverse speed of the honing wheel along the gear face width (denoted as $$f_z$$, in mm/min).
Consequently, we selected these three parameters—$$C_2$$, $$f_x$$, and $$f_z$$—as the design factors (inputs) for our experimental study, with the measured radial force $$F_r$$ as the output.
Experimental Setup and Design for Gear Honing Force Measurement
To collect high-quality data for model training and validation, we conducted honing tests on a state-of-the-art CNC internal gear honing machine. The workpiece material was 20CrMnTiH alloy steel, and the honing wheel was a vitrified bond wheel with microcrystalline alumina abrasive. The machine’s spindle was equipped with an integrated piezoelectric dynamometer (Kistler), allowing for direct and precise measurement of the radial honing force during machining.
Based on the machine’s operational manual, we defined the following ranges for our design factors:
- Workpiece Spindle Speed ($$C_2$$): 800 to 1800 rpm
- Radial Infeed ($$f_x$$): 2 to 8 μm/stroke
- Axial Feed Speed ($$f_z$$): 60 to 200 mm/min
We adopted a hybrid design of experiments. First, a standard $$L_{25}(5^3)$$ orthogonal array was used to efficiently explore the design space boundaries. This provided 25 test runs. However, orthogonal designs often leave the interior of the parameter space sparsely sampled. To ensure our models would be accurate across the entire range, we supplemented the orthogonal array with a central composite-inspired single-factor study. We added tests by varying one factor at a time around a central point ($$C_2=1300$$ rpm, $$f_x=5$$ μm/stroke, $$f_z=130$$ mm/min), while holding the others constant. After eliminating duplicate points, a total of 35 distinct experimental runs were performed. The first 30 runs were allocated for model training, and the final 5 runs were reserved for independent validation of the predictive models. A subset of the experimental design points and the full set of measured forces are summarized in the table below.
| Run No. | $$C_2$$ (rpm) | $$f_x$$ (μm/stroke) | $$f_z$$ (mm/min) | Measured $$F_r$$ (N) |
|---|---|---|---|---|
| 1 | 800 | 2.0 | 60 | 81 |
| 2 | 800 | 3.5 | 95 | 119 |
| 3 | 800 | 5.0 | 130 | 158 |
| 4 | 800 | 6.5 | 165 | 199 |
| 5 | 800 | 8.0 | 200 | 242 |
| 6 | 1050 | 2.0 | 95 | 84 |
| 7 | 1050 | 3.5 | 130 | 119 |
| 8 | 1050 | 5.0 | 165 | 156 |
| 9 | 1050 | 6.5 | 200 | 195 |
| 10 | 1050 | 8.0 | 60 | 163 |
| 11 | 1300 | 2.0 | 130 | 90 |
| 12 | 1300 | 3.5 | 165 | 123 |
| 13 | 1300 | 5.0 | 200 | 158 |
| 14 | 1300 | 6.5 | 60 | 119 |
| 15 | 1300 | 8.0 | 95 | 155 |
| 16 | 1550 | 2.0 | 165 | 99 |
| 17 | 1550 | 3.5 | 200 | 131 |
| 18 | 1550 | 5.0 | 60 | 83 |
| 19 | 1550 | 6.5 | 95 | 116 |
| 20 | 1550 | 8.0 | 130 | 151 |
| 21 | 1800 | 2.0 | 200 | 112 |
| 22 | 1800 | 3.5 | 60 | 81 |
| 23 | 1800 | 5.0 | 95 | 86 |
| 24 | 1800 | 6.5 | 130 | 117 |
| 25 | 1800 | 8.0 | 165 | 149 |
| 26 | 1300 | 5.0 | 130 | 132 |
| 27 | 1300 | 8.0 | 130 | 173 |
| 28 | 1300 | 5.0 | 60 | 101 |
| 29 | 1800 | 5.0 | 130 | 105 |
| 30 | 1550 | 5.0 | 130 | 118 |
| 31 | 1300 | 5.0 | 165 | 145 |
| 32 | 1300 | 5.0 | 95 | 117 |
| 33 | 1300 | 3.5 | 130 | 111 |
| 34 | 1300 | 6.5 | 130 | 152 |
| 35 | 1050 | 5.0 | 130 | 145 |
Development of a BP Neural Network Model for Gear Honing Force Prediction
The Backpropagation Neural Network is a powerful tool for modeling complex, non-linear relationships where an explicit physical formula is difficult to derive. For our gear honing force prediction task, we constructed a three-layer feedforward network. The input layer has three neurons corresponding to our process parameters: $$C_2$$, $$f_x$$, and $$f_z$$. The output layer has a single neuron producing the predicted radial force $$F_r$$. Determining the optimal number of neurons in the single hidden layer is often empirical; we found that a configuration with 10 hidden neurons provided a good balance between model complexity and generalization ability.
Before training, it is crucial to normalize the input and output data to a common scale, typically [0, 1], to prevent certain parameters from dominating the learning process due to their larger numerical range. We applied the min-max normalization function:
$$
y = \frac{(y_{max} – y_{min})(x – x_{min})}{x_{max} – x_{min}} + y_{min}
$$
where we set $$y_{min}=0$$ and $$y_{max}=1$$. The network was trained using the Levenberg-Marquardt backpropagation algorithm on the first 30 experimental samples. The training goal was set to a mean squared error of 0.001, with a maximum of 2000 epochs. The training process converged successfully, indicating that the network had learned the underlying patterns in the gear honing data.
To quantitatively assess the reliability of the trained BP network, we use the coefficient of determination, $$R^2$$, and its square root, $$R$$. The value $$R$$ provides a measure of correlation between the predicted and actual values. An $$R$$ value close to 1 indicates high prediction accuracy. Our trained model achieved excellent fit statistics: $$R = 0.9804$$ for the training samples, and $$R = 0.9848$$ for a separate set of test samples within the training data. The overall performance was $$R = 0.9815$$, confirming the model’s strong predictive capability for the gear honing force.
Development of an Exponential Empirical Model
For comparison, we also developed a traditional exponential model, which is widely used in cutting and grinding force prediction. The general form of such a model for gear honing force is:
$$
F_r = k \cdot C_2^{\,m} \cdot f_x^{\,n} \cdot f_z^{\,p} + F_0
$$
Here, $$k$$ is a constant encompassing the effects of workpiece material, honing wheel characteristics, and machine tool stiffness. The exponents $$m$$, $$n$$, and $$p$$ represent the sensitivity of the honing force to changes in spindle speed, radial infeed, and axial feed speed, respectively. The constant $$F_0$$ is introduced to account for any baseline force offset. To perform linear regression, we take the logarithm of both sides (for $$F_r > F_0$$):
$$
\lg(F_r – F_0) = \lg k + m \lg C_2 + n \lg f_x + p \lg f_z
$$
We set $$F_0 = 80$$ N, slightly below the minimum measured force in our training set, to satisfy the condition. Performing multiple linear regression on the log-transformed data from the first 30 experiments yielded the following empirical model for internal gear honing:
$$
F_r = 102.93 \cdot C_2^{-1.195} \cdot f_x^{3.018} \cdot f_z^{0.120} + 80
$$
The magnitudes of the exponents reveal the relative influence of each parameter on the radial honing force in this gear honing process. The exponent for radial infeed ($$n=3.018$$) is the largest, indicating that it is the most dominant factor. The axial feed speed has a small positive influence ($$p=0.120$$), while the spindle speed has a negative exponent ($$m=-1.195$$), suggesting that increasing the speed slightly reduces the force, likely due to thermal or dynamic effects.
Comparative Analysis and Discussion of Prediction Models
The ultimate test of any predictive model is its performance on unseen data. We used the final five experimental runs (Run #31 to #35 from Table 1) as a validation set. The process parameters for these runs were input into both the trained BP Neural Network model and the exponential formula. The predicted forces were then compared against the actual measured values to calculate the relative prediction error. The results of this critical comparison are presented in the table below.
| Validation Run | Process Parameters | Measured $$F_r$$ (N) | BP Neural Network Prediction (N) | Exponential Model Prediction (N) | Relative Error: BP Network (%) | Relative Error: Exponential Model (%) |
|---|---|---|---|---|---|---|
| 31 | $$C_2=1300, f_x=5.0, f_z=165$$ | 145 | 138.34 | 117.53 | 4.59 | 18.94 |
| 32 | $$C_2=1300, f_x=5.0, f_z=95$$ | 117 | 116.27 | 115.13 | 0.62 | 1.60 |
| 33 | $$C_2=1300, f_x=3.5, f_z=130$$ | 111 | 107.51 | 92.43 | 3.14 | 16.73 |
| 34 | $$C_2=1300, f_x=6.5, f_z=130$$ | 152 | 146.66 | 160.52 | 3.52 | 5.60 |
| 35 | $$C_2=1050, f_x=5.0, f_z=130$$ | 145 | 147.34 | 127.08 | 1.61 | 12.35 |
The results are striking. The BP Neural Network model demonstrates superior prediction accuracy. Its relative errors for the five validation cases are all below 5%, with most under 4%. This level of accuracy is highly satisfactory for practical applications in process planning and optimization for gear honing. In contrast, the exponential model shows significantly larger and more variable errors, ranging from 1.60% to a substantial 18.94%. This inconsistency makes the exponential model less reliable for precise force prediction across the tested parameter space.
The primary reason for the BP network’s superiority lies in its ability to capture complex, non-linear interactions between the input parameters without being constrained by a pre-defined mathematical form like the exponential relationship. The network learns these interactions directly from the data. The exponential model, while grounded in traditional machining theory, may oversimplify the intricate physics of the abrasive gear honing process, which involves continuous changes in contact geometry, chip formation mechanisms, and abrasive grain conditions.
However, a balanced discussion must acknowledge operational practicality. The exponential model, once derived, offers unparalleled simplicity. A process engineer can simply insert values for $$C_2$$, $$f_x$$, and $$f_z$$ into the formula and obtain an immediate force estimate without any software or computational overhead. Implementing a BP network requires a software environment to load the trained network and execute the feedforward calculation, which is a more involved step.
Conclusion
In this investigation into predicting radial honing forces in internal gear honing, we have successfully implemented and compared two distinct modeling approaches. Our experimental methodology, combining an orthogonal array with a central single-factor study, provided a robust dataset that effectively covered the design space.
The data-driven BP Neural Network model proved to be exceptionally accurate, with prediction errors consistently below 5% on validation data. Its ability to model non-linear parameter interactions makes it an excellent choice for high-precision applications where accurate force prediction is critical for ensuring gear quality, optimizing tool life, or preventing machine overload in the gear honing process.
The classical exponential model, while less accurate and showing higher error variance, retains significant value due to its operational simplicity and the physical insight offered by its exponents. It can serve as a useful first-order approximation or a quick-check tool in environments where deploying a neural network is not feasible.
Therefore, the choice between these models for gear honing force prediction depends on the specific requirements of the task at hand. If the priority is maximum prediction accuracy for process optimization and control, the BP Neural Network is the recommended tool. If the need is for a simple, readily calculable estimate to guide initial parameter selection, the exponential model provides a practical solution. Both models contribute valuable perspectives to the ongoing effort to understand, predict, and optimize the complex internal gear honing process.