
Wind energy, as a clean and renewable source, has seen extensive global adoption and holds a dominant position among new energy technologies. The gearbox is a critical component within a wind turbine, necessitating characteristics such as long service life and high reliability. However, in practical wind farm operations, gearbox failures account for a significant portion of turbine downtime. Among the various failure modes, fatigue pitting is one of the most common failure mechanisms for enclosed gear transmissions. The initiation and propagation of pits lead to increased stress concentrations around the defects, potentially catalyzing crack formation and further pitting, thereby degrading the overall reliability of the gear transmission system.
While considerable research has been conducted on the principles and progression of gear pitting, studies focusing on the quantitative impact of pitting on gear reliability are relatively scarce. This work aims to address this gap by investigating the influence of pitting on the reliability of high-speed, heavy-duty helical gears, specifically those used in the third stage of a multi-megawatt wind turbine gearbox. The approach integrates a field-measured load spectrum, finite element analysis considering material plasticity, statistical fitting of stress spectra, and structural reliability methods to evaluate how pitting defect size and quantity affect operational reliability.
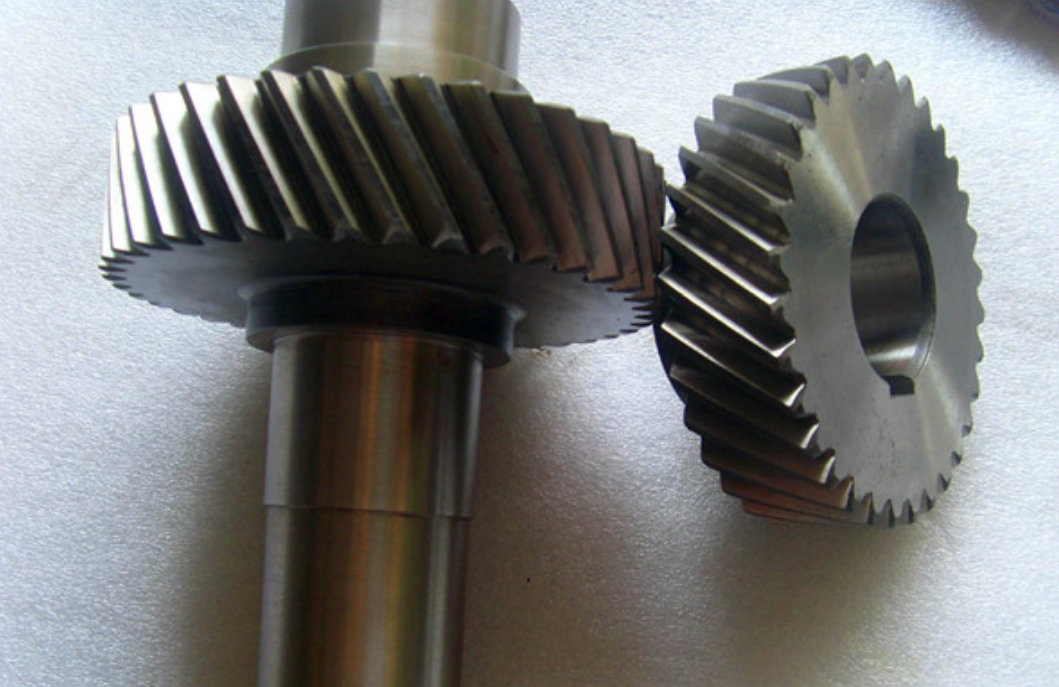
The subject of this study is the third-stage parallel shaft helical gear pair from a 2.5 MW wind turbine gearbox. This stage typically follows two planetary stages and is responsible for the final speed increase. Historical failure data often indicates this stage as a reliability-critical component due to the high transmitted power and rotational speed. The geometric parameters for the mating helical gears are summarized in Table 1.
| Parameter | Pinion | Gear |
|---|---|---|
| Number of Teeth, z | 27 | 131 |
| Module, mn (mm) | 7.95 | |
| Pressure Angle, αn (°) | 25 | |
| Face Width, b (mm) | 230 | |
| Helix Angle, β (°) | 12.5 | |
| Profile Shift Coefficient, x | 0.3040 | 0.6376 |
Accurate material properties are paramount for reliable stress and life prediction. Tensile tests were performed on specimens manufactured from the gear material, 18CrNiMo7-6 steel. The tests yielded the statistical parameters for the ultimate tensile strength, along with other key mechanical properties necessary for elastoplastic analysis, as listed in Table 2.
| Property | Value |
|---|---|
| Density, ρ (kg/m³) | 7800 |
| Elastic Modulus, E (MPa) | 2.09 × 10⁵ |
| Poisson’s Ratio, ν | 0.25 |
| Mean Ultimate Tensile Strength, μS (MPa) | 1.062 × 10³ |
| Standard Deviation of Ultimate Strength, σS (MPa) | 21.91 |
| Tangent Modulus, Et (MPa) | 3.69 × 10³ |
| Yield Stress (0.2% offset), σ0.2 (MPa) | 9.00 × 10² |
A three-dimensional finite element model of the helical gear pair was developed using hexahedral elements, resulting in a mesh with over 150,000 elements. To simulate pitting defects, hemispherical pits of various diameters were modeled on the tooth flank of the pinion, which typically experiences higher stress levels. The loading condition applied to the model was derived from long-term wind field monitoring data. The measured torque-time history was processed using the rainflow counting method to obtain a “torque-revolution” spectrum. This load spectrum exhibited a bimodal distribution, and its probability density function (PDF) was fitted using a Gaussian Mixture Model (GMM). The PDF of the input torque, T, is given by:
$$ p(T) = 0.7054 \cdot \frac{1}{4.5622\sqrt{2\pi}} e^{-\frac{(T – 7.6735)^2}{2 \times 4.5622^2}} + 0.2946 \cdot \frac{1}{1.4411\sqrt{2\pi}} e^{-\frac{(T – 21.0002)^2}{2 \times 1.4411^2}} $$
Boundary conditions were applied with an angular velocity prescribed to the driving gear (the larger helical gear) and the resistive torque spectrum applied to the driven pinion. Elastoplastic finite element analysis was conducted for multiple torque levels within the spectrum to capture the stress response, particularly the stress concentration around the pitting defects. The analysis confirmed that the maximum von Mises stress consistently occurred at the periphery of the pits on the pinion tooth. The presence of a pit caused a dramatic increase in local stress compared to a pristine gear surface. Table 3 shows the trend of increasing maximum stress with increasing pit diameter for a range of applied torques.
| Pit Diameter (mm) | 4,703 Nm | 8,885 Nm | 12,369 Nm | 16,899 Nm | 25,261 Nm |
|---|---|---|---|---|---|
| 0 (No Pit) | 210 | 455 | 695 | 882 | 970 |
| 0.35 | 917 | 974 | 987 | 1004 | 1047 |
| 0.40 | 928 | 992 | 998 | 1007 | 1050 |
| 0.50 | 935 | 1000 | 1008 | 1012 | 1052 |
| 0.85 | 943 | 977 | 990 | 1009 | 1046 |
| 1.00 | 948 | 997 | 1011 | 1016 | 1056 |
The finite element results provided discrete stress values for specific torque levels. To perform a probabilistic reliability analysis, a continuous representation of the stress state under the stochastic load spectrum is required. Therefore, the relationship between applied torque and the resulting maximum stress (from FEA) was used to generate a stress spectrum. This stress spectrum was then fitted using a Gaussian Mixture Model (GMM). The Expectation-Maximization (EM) algorithm was employed to find the optimal parameters for the bimodal distribution that best represents the stress PDF for each pitting scenario. The general form of the fitted stress PDF, p(σ), is:
$$ p(\sigma) = \pi_1 \cdot \mathcal{N}(\sigma | \mu_1, \sigma_1^2) + \pi_2 \cdot \mathcal{N}(\sigma | \mu_2, \sigma_2^2) $$
$$ \text{where } \pi_1 + \pi_2 = 1 $$
Here, πk are the mixture weights, μk are the means, and σk are the standard deviations of the two Gaussian components. The fitted parameters for the stress PDF under varying pit diameters are listed in Table 4, and for varying numbers of pits (with a fixed diameter of 0.5 mm) in Table 5.
| Parameter | No Pit | 0.35 mm | 0.40 mm | 0.50 mm | 0.85 mm | 1.00 mm |
|---|---|---|---|---|---|---|
| π1 | 0.68886 | 0.27580 | 0.46188 | 0.47349 | 0.52709 | 0.49563 |
| μ1 (MPa) | 379.68 | 819.62 | 887.51 | 897.81 | 892.38 | 905.50 |
| σ1 (MPa) | 242.19 | 128.46 | 117.90 | 111.79 | 100.05 | 107.29 |
| π2 | 0.31114 | 0.72420 | 0.53812 | 0.52651 | 0.47291 | 0.50437 |
| μ2 (MPa) | 923.28 | 988.03 | 1009.49 | 1016.46 | 1007.67 | 1020.12 |
| σ2 (MPa) | 17.27 | 32.24 | 14.94 | 11.53 | 15.99 | 12.44 |
| Parameter | 0 Pits | 1 Pit | 2 Pits | 3 Pits | 5 Pits | 6 Pits | 7 Pits |
|---|---|---|---|---|---|---|---|
| π1 | 0.68886 | 0.47349 | 0.47601 | 0.20292 | 0.21594 | 0.21614 | 0.21601 |
| μ1 (MPa) | 379.68 | 897.81 | 909.86 | 910.01 | 912.75 | 916.51 | 931.45 |
| σ1 (MPa) | 242.19 | 111.79 | 107.38 | 373.08 | 248.01 | 248.63 | 248.27 |
| π2 | 0.31114 | 0.52651 | 0.52399 | 0.79708 | 0.78406 | 0.78386 | 0.78399 |
| μ2 (MPa) | 923.28 | 1016.46 | 1022.13 | 1026.37 | 1027.35 | 1033.10 | 1043.08 |
| σ2 (MPa) | 17.27 | 11.53 | 11.77 | 24.11 | 16.97 | 17.45 | 16.63 |
The reliability analysis is framed as a stress-strength interference problem. The “stress” is the operational von Mises stress induced by the stochastic load, characterized by the GMM PDFs above. The “strength” is the material’s ultimate tensile strength, modeled as a random variable with mean μS and standard deviation σS from Table 2. The limit state function, g(X), defining failure is:
$$ g(\mathbf{X}) = R – S $$
where R is the material strength and S is the operational stress. Failure occurs when g(X) ≤ 0. The reliability index, β, which is the shortest distance from the origin to the limit state surface in the space of reduced variables, and the corresponding probability of reliability, R = Φ(β), were calculated using the Advanced First-Order Second-Moment (AFOSM) method, also known as the Hasofer-Lind method. This method is iterative and finds the most probable point of failure on the limit state surface, providing accurate reliability estimates even for non-linear limit states and non-normal distributions (through appropriate transformations). The core iterative equations involve calculating the sensitivity factors αi and updating the design point xi*:
$$ \alpha_i = \frac{ \frac{\partial g}{\partial X_i} \bigg|_{\mathbf{x}^*} \cdot \sigma_{X_i} }{ \sqrt{ \sum_{i=1}^{n} \left( \frac{\partial g}{\partial X_i} \bigg|_{\mathbf{x}^*} \cdot \sigma_{X_i} \right)^2 } } $$
$$ \beta = \frac{ g(\mathbf{x}^*) + \sum_{i=1}^{n} \frac{\partial g}{\partial X_i} \bigg|_{\mathbf{x}^*} (\mu_{X_i} – x_i^*) }{ \sqrt{ \sum_{i=1}^{n} \left( \frac{\partial g}{\partial X_i} \bigg|_{\mathbf{x}^*} \cdot \sigma_{X_i} \right)^2 } } $$
$$ x_i^* = \mu_{X_i} + \beta \sigma_{X_i} \alpha_i $$
For the case where S follows a GMM, the equivalent normal distribution parameters at the design point are used in each iteration. The calculated reliability values for helical gears with different pitting conditions are presented in Table 6 and Table 7.
| Pit Diameter (mm) | Reliability, R |
|---|---|
| 0.00 | 0.9853 |
| 0.35 | 0.9224 |
| 0.40 | 0.8992 |
| 0.50 | 0.8736 |
| 0.85 | 0.8693 |
| 1.00 | 0.8655 |
| Number of Pits | Reliability, R |
|---|---|
| 0 | 0.9853 |
| 1 | 0.8736 |
| 2 | 0.8639 |
| 3 | 0.6722 |
| 5 | 0.6356 |
| 6 | 0.6132 |
| 7 | 0.5927 |
The results clearly demonstrate the detrimental effect of pitting on the reliability of helical gears. For a single pit, reliability decreases monotonically as the pit diameter increases. The decline is particularly sharp when the pit diameter grows from 0 mm to approximately 0.4 mm. Beyond 0.5 mm, the rate of reliability decrease diminishes, suggesting that the stress concentration factor may be approaching a plateau for the given gear geometry and load.
The impact of multiple pits is even more severe. The presence of just one or two pits causes a significant initial drop in reliability. However, when the number of pits exceeds two, a drastic reduction in reliability is observed. This is attributed to stress field interactions between adjacent pits. When multiple pits are in close proximity, their individual stress concentration zones overlap and amplify, leading to a substantially higher effective stress in the region, which dramatically increases the probability of failure. This underscores that the number of pitting defects is a critical parameter, potentially more sensitive than the size of individual pits beyond a certain threshold, for assessing the health and remaining useful life of helical gears.
In conclusion, this study establishes a integrated framework for assessing the reliability of wind turbine helical gears in the presence of fatigue pitting. The methodology combines realistic stochastic loading, detailed elastoplastic stress analysis of pitted gears, statistical characterization of the resulting stress field, and advanced structural reliability methods. The key findings are: (1) Pitting causes severe stress concentrations, with local stress levels becoming multiple times higher than in pristine helical gears. (2) Both the size and the number of pitting defects significantly degrade gear reliability. (3) The increase in the number of pits leads to a particularly pronounced decrease in reliability due to stress interaction effects. Therefore, for the condition-based maintenance of wind turbine gearboxes, monitoring both the size and the density of pitting defects on critical helical gears is essential. Once defect size and quantity surpass certain thresholds, proactive maintenance actions should be considered to prevent catastrophic failure and ensure system reliability.