1. The influence of grid quantity distribution on the simulation accuracy of maximum tooth contact stress of helical gears under high and low rotational speeds
Figure 1 shows the comprehensive variation of the maximum tooth surface contact stress of a helical gear simulated at high and low speeds with respect to tooth width and the number of mesh in the involute direction.
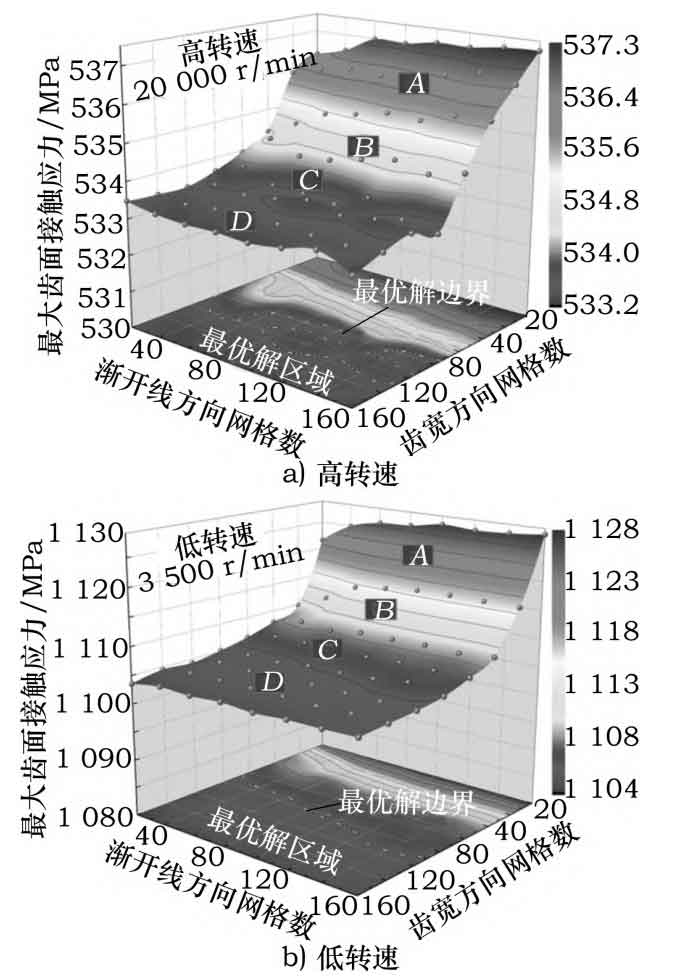
From Figure 1, it can be seen that at high and low speeds, the change in the number of grids along the involute direction has a relatively small impact on the simulation results of the maximum tooth contact stress of the helical gear, while the change in the number of grids along the tooth width direction of the helical gear has a greater impact on the simulation results of the maximum tooth contact stress. The reason may be that the helical gear undergoes elastic deformation due to the load on the shaft, bearings, and the helical gear body during high and low speed operation, As a result, the deformation along the width direction of the helical gear is relatively large, while the deformation along the involute or tooth profile direction is relatively small. The simulation results of the maximum tooth surface contact stress of helical gears show a trend of first decreasing and then stabilizing with the increase of the number of mesh in the tooth width direction. According to the theory of contact stress on the helical gear tooth surface, the reason may be that as the number of mesh on the helical gear tooth surface increases, the curvature radius at the peak position of the contact stress on the helical gear tooth surface increases, thereby reducing the maximum contact stress on the helical gear tooth surface.
From Figure 1a), it can be seen that at a speed of 20000r/min, the difference between the maximum and minimum contact stresses of the helical gear tooth surface is approximately 4.1 MPa within the range of 20-160 mesh numbers in the tooth width direction of the helical gear; When the number of grids along the width direction of the helical gear is in region A (<70), the difference between the maximum and minimum contact stresses on the helical gear tooth surface is about 2.1 MPa, which has the greatest impact on the accurate calculation of the maximum contact stress on the helical gear tooth surface; When the number of grids along the width direction of the helical gear is in regions B (about 70-85) and C (about 85-120), the difference between the maximum and minimum contact stresses of the helical gear is about 0.8MPa. Compared with the simulation results of the maximum contact stresses of the helical gear in region A, the error of the simulation results is reduced by 61.9%; When the number of grids along the width direction of the helical gear is in region D (about>120), the difference between the maximum and minimum values of the maximum tooth contact stress of the helical gear is about 0.4 MPa. Compared with region A, the error of the simulation result of the maximum tooth contact stress of the helical gear decreases by 81.0%. Moreover, as the number of grids in the width direction of the helical gear further increases, the error of the simulation result of the maximum tooth contact stress of the helical gear remains stable.
From Figure 1b), it can be seen that at a speed of 3500r/min, the difference between the maximum and minimum contact stresses on the helical gear tooth surface is approximately 24.0MPa within the range of 20-160 mesh numbers in the direction of the helical gear tooth width. When the mesh number along the helical gear tooth width direction is in region A (<40), The difference between the maximum and minimum contact stresses on the tooth surface of helical gears is approximately 10.0MPa; When the number of grids along the tooth width direction of the helical gear is in regions B (40-55) and C (about 55-110), the difference between the maximum and minimum contact stresses of the helical gear is about 5.0 MPa, which is a 50.0% decrease in error compared to the simulation results of the maximum contact stresses in region A; When the number of grids along the width direction of the helical gear is in region D (about>110), the difference between the maximum and minimum contact stresses of the helical gear is about 2.0 MPa. Compared with the simulation results of the maximum contact stresses in region A, the error decreases by 80.0%. Moreover, as the number of grids in the width direction of the helical gear further increases, the error of the maximum contact stresses of the helical gear remains stable, At this point, the number of grids has reached a saturation state, and the further increase in the number of grids along the tooth width direction of the helical gear has minimal impact on the calculation accuracy.
At high and low speeds, the simulated maximum tooth contact stress of helical gears shows a similar trend in the number of grids along the tooth width direction. The optimal number of grids is about 120 and 110, and the worst number of grids is about 70 and 40, respectively. Compared to high speed, the number of optimal and worst grids at low speed is smaller than the corresponding number of grids at high speed, indicating that low speed has a relatively low requirement for the number of grids to achieve optimal simulation accuracy. Moreover, from the difference between the maximum and minimum contact stresses on the helical gear tooth surface, the simulation error of the maximum contact stress on the helical gear tooth surface at low speed is 24.0MPa, At high speeds, the corresponding error is only 4.1 MPa, indicating that the change in the number of mesh on the helical gear tooth surface has little effect on the simulation accuracy of the maximum tooth contact stress under high speed conditions.
2. The influence of grid quantity distribution on the simulation accuracy of peak to peak transmission errors under high and low rotational speeds
The simulation values of peak to peak transmission errors under high and low speeds vary comprehensively along the tooth width and the number of grids in the involute direction, as shown in Figure 2. From Figure 2, it can be seen that at high and low speeds, the increase in the number of grids along the involute direction has a relatively small impact on the simulation accuracy of peak to peak transmission errors. The variation of the simulation value of peak to peak transmission errors along the helical gear tooth width direction grid number is completely opposite to the trend of the maximum contact stress simulation value of the helical gear tooth surface with the change of the number of grids in the tooth width direction; The simulation value of peak to peak transmission error shows a trend of first increasing and then stabilizing with the increase of the number of mesh in the tooth width direction. The reason may be that the peak point of contact stress on the helical gear tooth surface decreases with the increase of the number of mesh on the tooth surface, thereby increasing the gap between the tooth surfaces of the helical gear pair, leading to an increase in the simulation value of peak to peak transmission error.
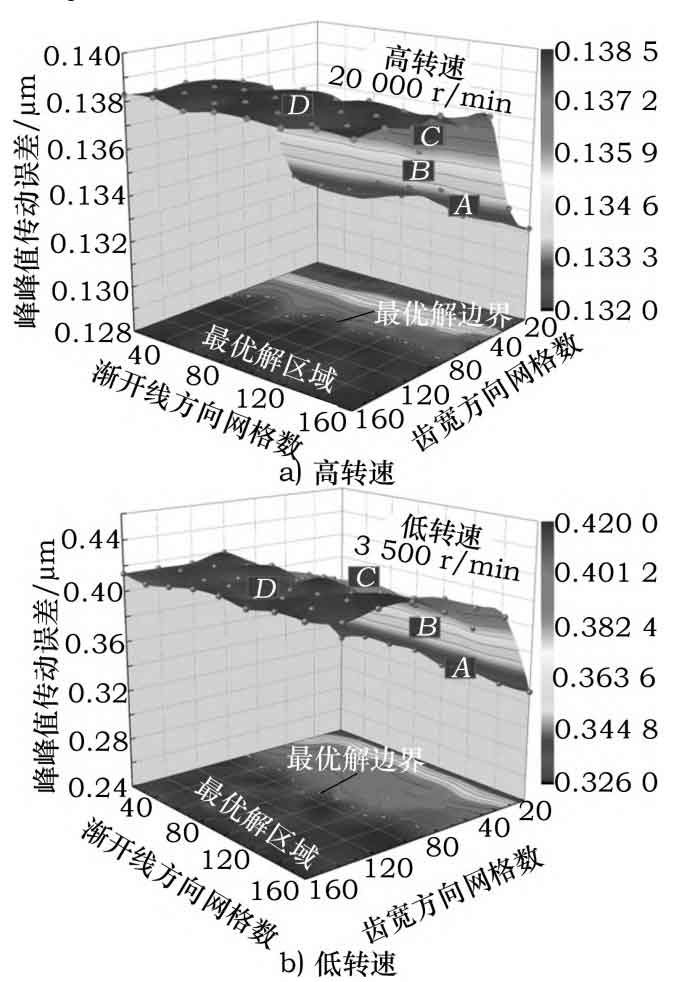
From Figure 2a), it can be seen that at a speed of 20000r/min, the maximum and minimum peak to peak transmission errors are simulated to be 0.1385 and 0.1320, respectively, within the range of 20-160 grids in the direction of helical gear tooth width μ m. The difference is approximately 0.0065 μ M; When the number of grids along the helical gear tooth width direction is in region A (<40), the impact on the simulation results of peak to peak transmission error is the greatest, and the difference between the maximum and minimum values of the simulation results is about 0.0020 μ m. As the number of grids further increases, the fluctuation value of peak to peak transmission error decreases; When the number of grids along the helical gear tooth width direction is in regions B (about 40-55) and C (about 55-100), the difference between the maximum and minimum values of the peak to peak transmission error simulation results is about 0.0019 μ m. Compared to the peak to peak transmission error simulation results of the number of grids in region A, the error is reduced by 5.0%; When the number of grids along the helical gear tooth width direction is in region D (about>100), the simulation value of peak to peak transmission error fluctuates the smallest, only 0.0007 μ m. And as the number of mesh in the width direction of the helical gear further increases, there will be no significant fluctuations.
From Figure 2b), it can be seen that at a speed of 3500r/min, the maximum and minimum peak to peak transmission errors are 0.4200 and 0.3260, respectively, within the range of 20-160 mesh numbers in the direction of helical gear tooth width μ m. The difference is approximately 0.0940 μ M; When the number of grids along the helical gear tooth width direction is in regions A (<40), B (about 40-50), and C (about 50-100), the difference between the maximum and minimum values of the simulation results is about 0.0282 μ M; When the number of grids along the helical gear tooth width direction is in region D (about>100), the fluctuation of peak to peak transmission error value is the smallest, only 0.0094 μ m. And with the further increase of the number of mesh in the width direction of the helical gear teeth, there is no significant fluctuation, indicating that the peak to peak transmission error value changes to a steady state.
At high and low speeds, the trend of peak to peak transmission error is similar to that of the number of grids in the direction of helical gear tooth width. However, compared with high speeds, the maximum peak to peak transmission error and maximum error values are higher at low speeds, indicating that the distribution of mesh numbers on the helical gear tooth surface has little effect on peak to peak transmission error at high speeds. The distribution of the optimal and worst grid numbers is similar for both high and low speeds, with the optimal grid numbers being about 100 and the worst grid numbers being about 40. This indicates that high and low speeds require a similar number of grids to achieve optimal simulation accuracy.
3. The influence of grid quantity distribution on the simulation accuracy of tooth contact spot distribution under high and low rotational speeds
The shape, size, and position of contact spots on the tooth surface of helical gears have a direct impact on their load-bearing capacity, service life, and vibration noise. The requirement for the contact spot of helical gears is one of the important indicators of the meshing quality of helical gears. Figure 3 shows the size of normal tooth contact spots and their distribution on the tooth surface in GB/T13924-1992 “Accuracy Inspection Specification for Involute Helical Gears”. Figure 3 shows the working length of the helical gear mesh and the working height of the helical gear mesh.
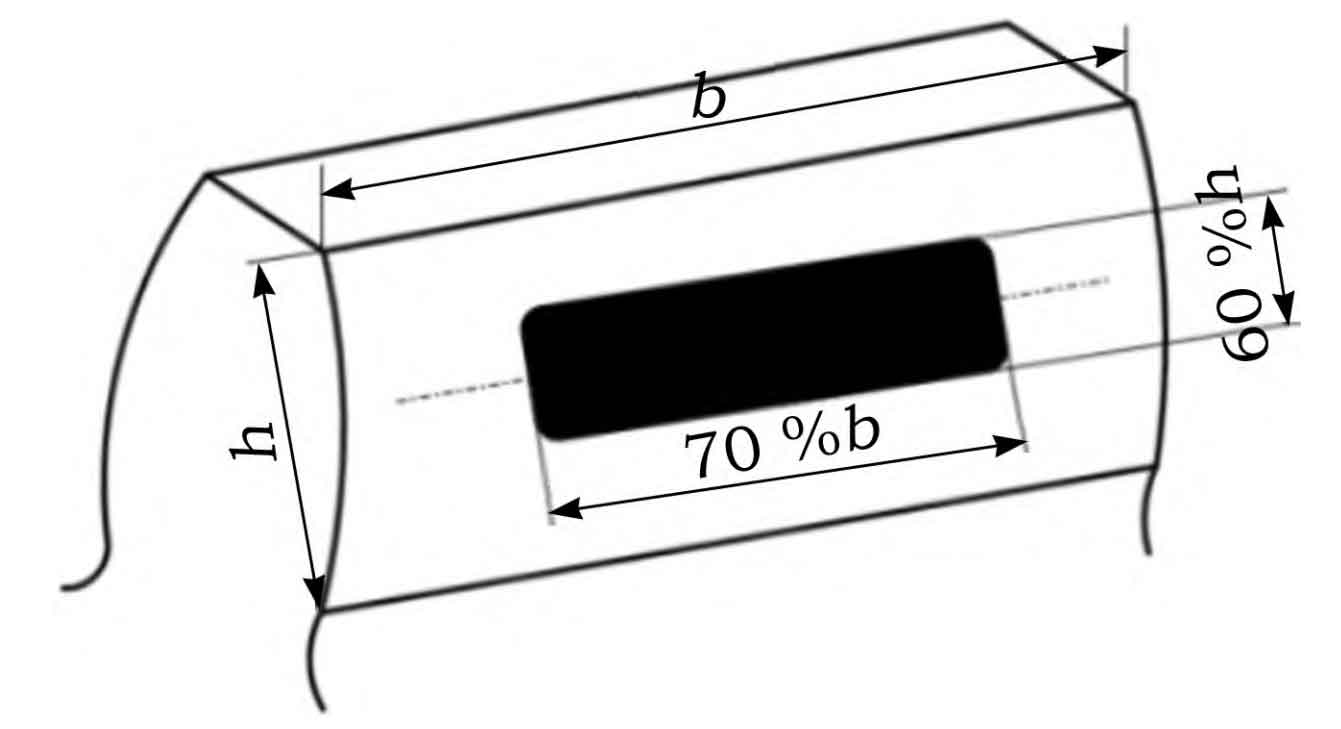
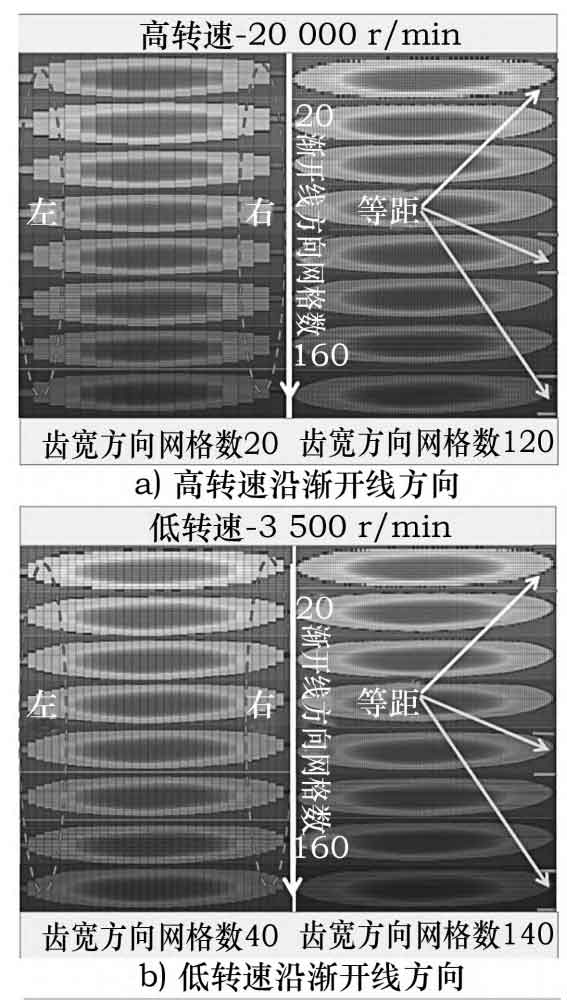
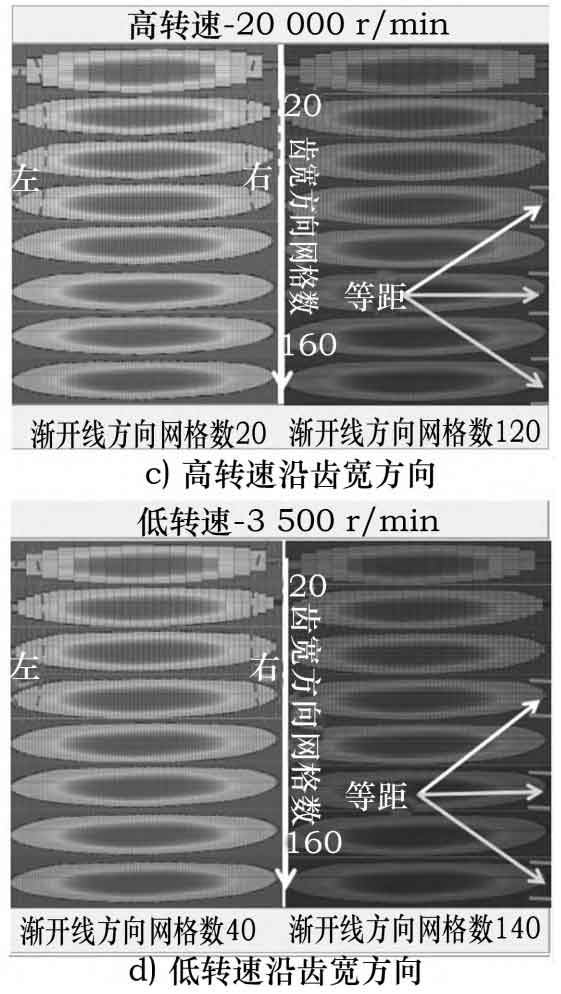
Figure 4 shows the simulation results of the distribution of contact spots on the tooth surface of helical gears under high and low rotational speeds, which vary comprehensively along the tooth width and the number of meshes in the involute direction.
From Figures 4a) and 4b), it can be seen that at high and low speeds, as the number of mesh in the involute direction increases, the contact spot on the helical gear tooth surface remains basically unchanged, and the size of the contact spot on the helical gear tooth surface is consistent.
From Figures 4c) and 4d), it can be seen that at high and low speeds, as the number of grids in the width direction of the helical gear increases, the contact spot on the helical gear tooth surface shows a trend of first increasing and then stabilizing. When the number of grids along the width direction of the helical gear tooth exceeds 80, as the number of grids in the width direction of the helical gear tooth further increases, the size of the contact spot on the helical gear tooth surface remains basically consistent and presents a stable state.

