
It is necessary to conduct bending fatigue tests to study the bending fatigue life of cylindrical gears. The current bending fatigue testing methods for cylindrical gears are mainly divided into operating cylindrical gears bending fatigue testing methods and non operating cylindrical gears bending fatigue testing methods. The bending fatigue test of running cylindrical gears is carried out by installing the cylindrical gears on the testing machine, and the cylindrical gears are operated according to the actual working speed and load. The non operating cylindrical gears bending fatigue test can determine the bending fatigue life of cylindrical gears under static conditions. This method simulates the meshing of cylindrical gear pairs by applying a load on the teeth. Compared with the operating style method, this method has the advantages of low test consumption, low cost, short required time, simple operation, and high utilization rate.
1. Crack propagation test for cylindrical gears
The equipment is PLG-200 high-frequency bending fatigue testing machine. The parameters of cylindrical gears are shown in Table 1.
| Number of teeth | Normal phase modulus | Tooth width | Material |
| 22 | 5 | 10 | 18CrNiMo7-6 |
Taking subway cylindrical gears as the research object, it has similarities with cylindrical gears. The literature determined the fatigue limit of the cylindrical gears specimen at the fatigue life N=107 level using the lifting method, which is 500.40 MPa. The fatigue of cylindrical gears mostly belongs to high cycle fatigue. At the same time, considering the performance of the testing equipment, research is conducted on the fatigue life range N ≤ 107 of cylindrical gears specimens.
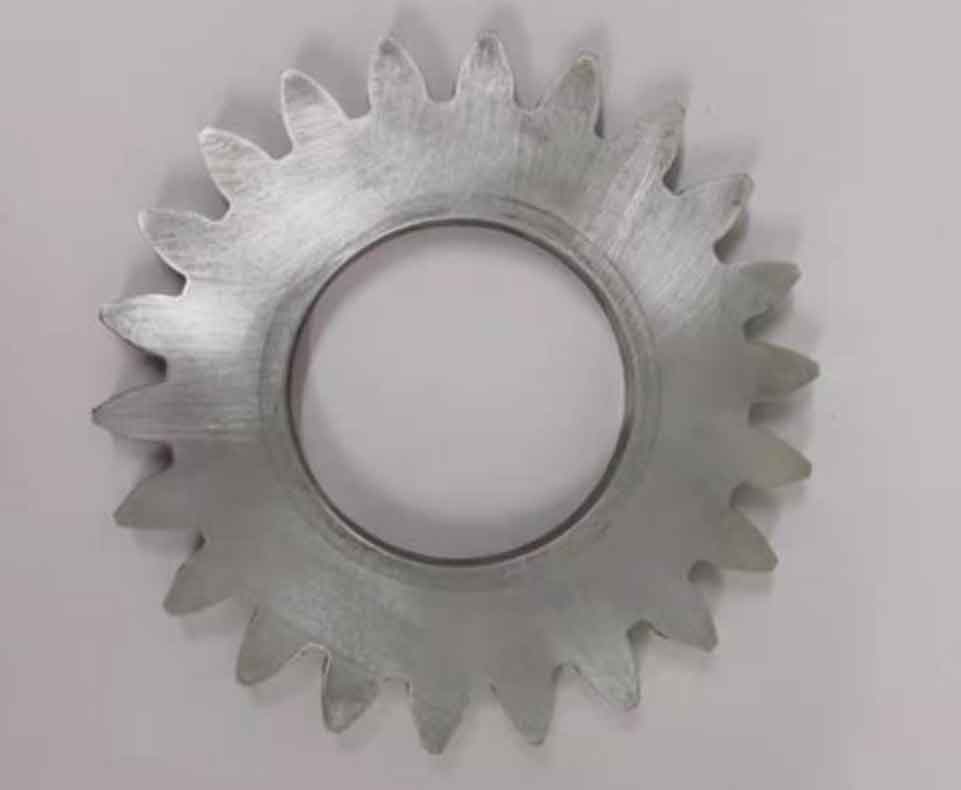
Before the experiment begins, polish the surface of the cylindrical gears specimen. The polished cylindrical gears specimen is shown in Figure 1.
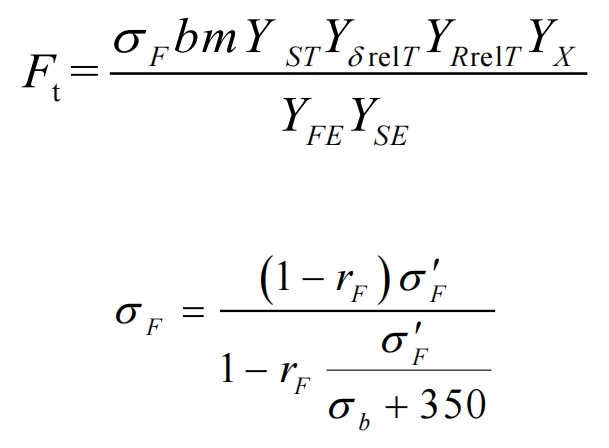
The determined level III tooth root stress, which is 544.76 MPa, is selected for the experimental tooth root stress. The loading load of the testing machine can be calculated according to the formula:
| Coefficient | YSE | YFE | YßrelT | YRrelT | YX | YST |
| Numerical value | 1.765 | 2.25 | 1 | 1.063 | 1 | 2 |
The loading frequency of the testing machine is about 150 Hz. When the vibration frequency decreases by 8%, the test pauses. Record the number of cycles at this time as the crack initiation life Ni. Observe the cracks along the end face of the cylindrical gears and along the tooth width direction. Measure the crack length using a handheld graduated microscope, denoted as ai and ai *, respectively.
Set the fatigue testing machine to displacement protection and continue the test until the tooth fractures. At this stage, the crack propagates slowly along the end face direction and rapidly along the tooth width direction. Record the number of cycles at fracture as the fatigue life N of the specimen. According to the formula, the propagation life Ns during crack propagation can be calculated.
The experiment was conducted in three groups, and the experimental data is shown in Table 3.
| Test number | Birth lifespan Ni/104cyc | End face crack length ai/mm | Tooth width crack length ai */mm | Extended lifespan Ns/104cyc | Fatigue life N/104cyc |
| 1 | 280.62 | 0.73 | 0.49 | 23.29 | 303.91 |
| 2 | 310.70 | 0.91 | 0.58 | 16.79 | 327.49 |
| 3 | 263.39 | 0.82 | 0.56 | 19.27 | 282.66 |
According to experimental data, the initiation life of the specimen accounts for more than 92.33% of the fatigue life of the specimen, while the extended life only accounts for a small part of the fatigue life, accounting for less than 7.66% of the fatigue life. When the frequency of the testing machine decreased to 10% of the original frequency, visible cracks appeared at the tooth roots of all three groups of specimens, and the length of the cracks along the end face direction was greater than that along the tooth width direction. The size of the cracks along the end root end face was less than 1 mm, and the length of the cracks along the tooth width direction was less than 0.6 mm.
The grayscale image of the fracture surface of the cylindrical gears specimen is shown in Figure 2. Within the red dotted box, the cross-section is relatively smooth with wavy patterns, which conform to the characteristics of the fatigue fracture initiation zone. The width of this area is about 1.2 mm; Within the yellow dashed box, the fracture surface appears grain like and relatively rough, consistent with the characteristics of the fatigue fracture transient zone.
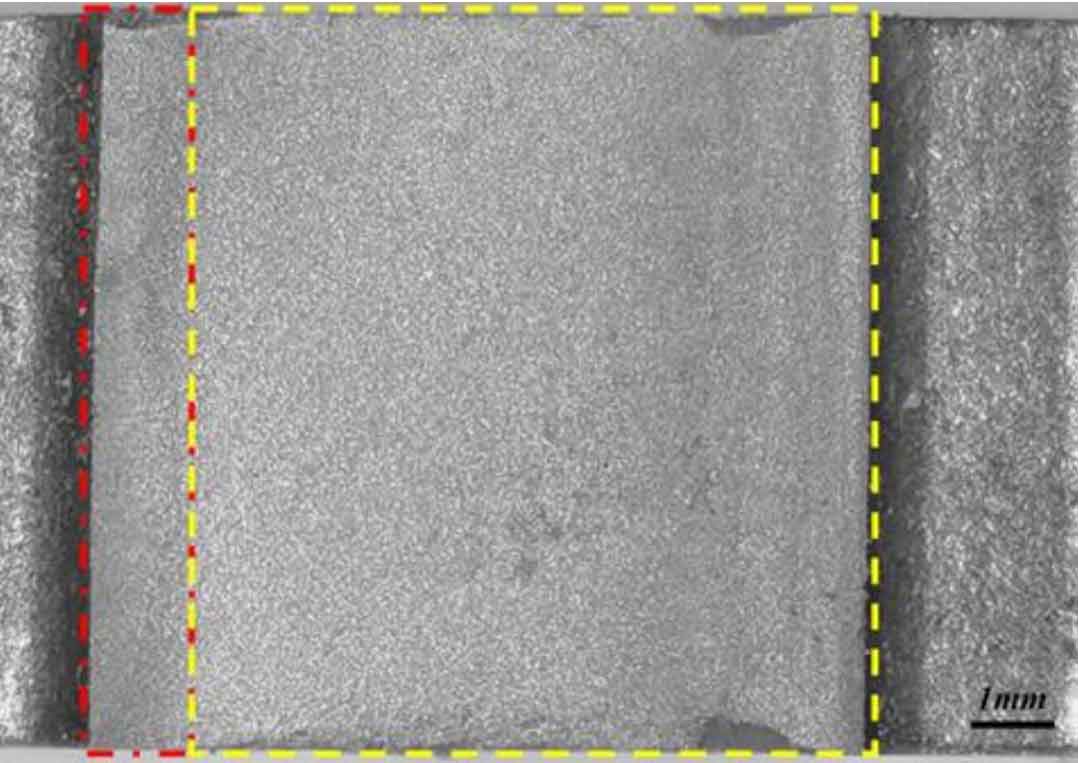
It is explained that gear tooth fracture is caused by tensile stress on one side of the loaded tooth root, which leads to the initiation of open cracks at the tooth root, ultimately resulting in gear tooth fracture.
2. Single tooth finite element simulation of cylindrical gears
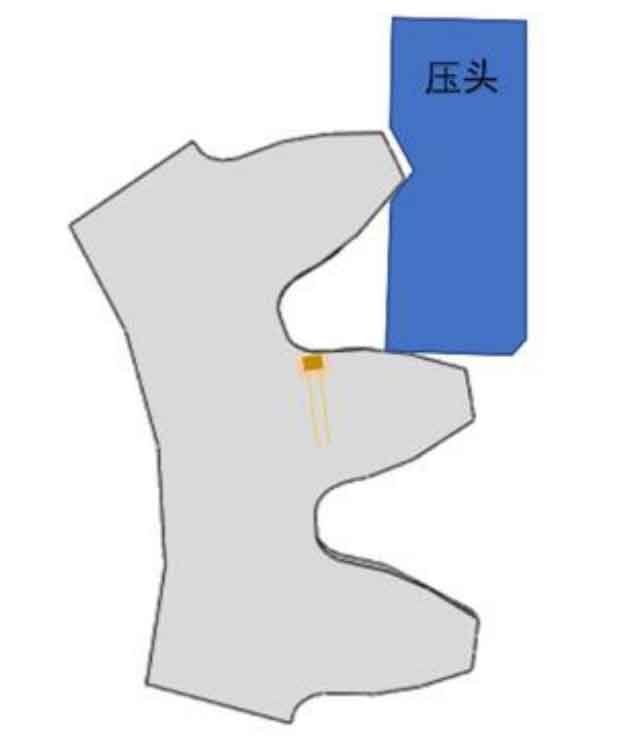
To meet the actual working conditions of single tooth bending fatigue test, considering the balance between calculation cost and accuracy, only the single tooth mesh on the cylindrical gears is divided to reduce the calculation scale. Perform static analysis on the single tooth finite element model, fix the single tooth model, and ensure that the loading area is consistent with the loading area of the single tooth bending fatigue test. The model has 82213 grids and a total of 119208 nodes, calculated using tetrahedral integral elements (C3D10).
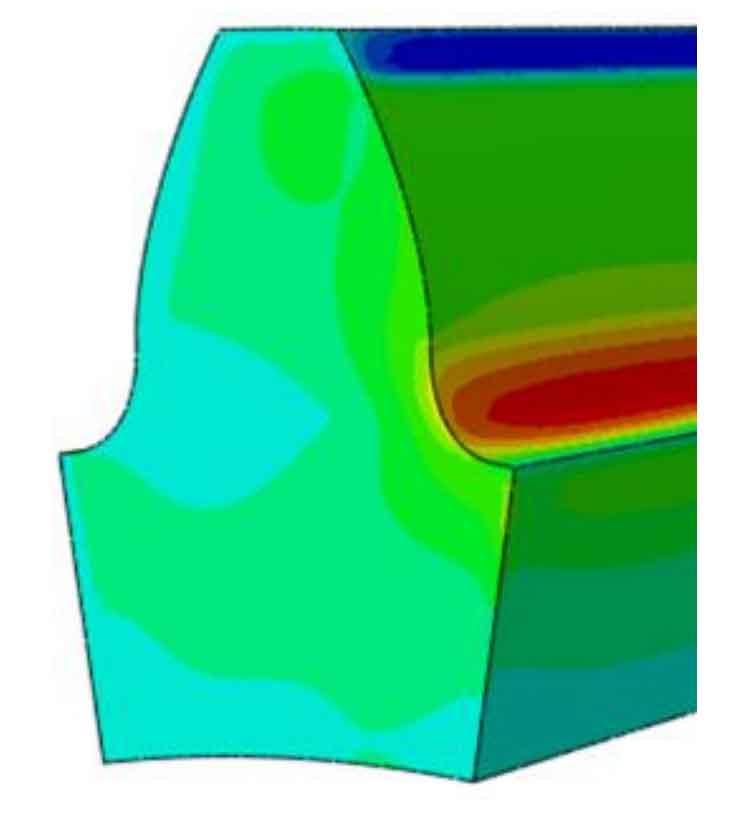
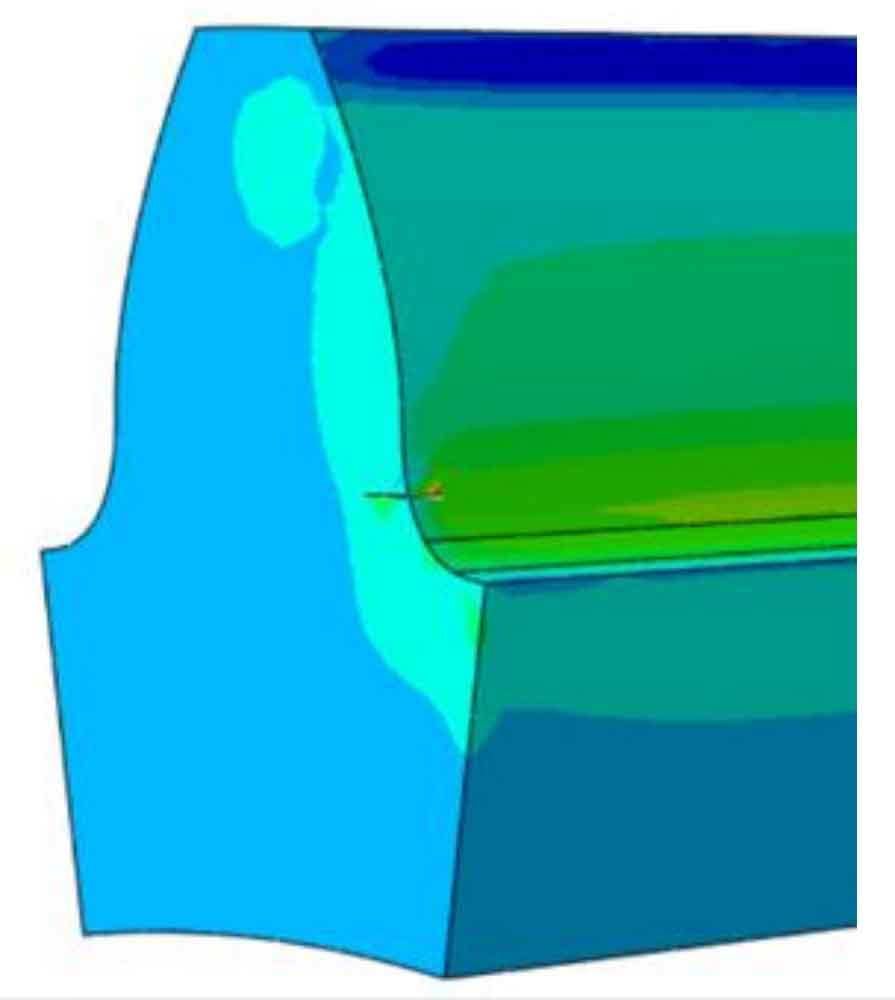
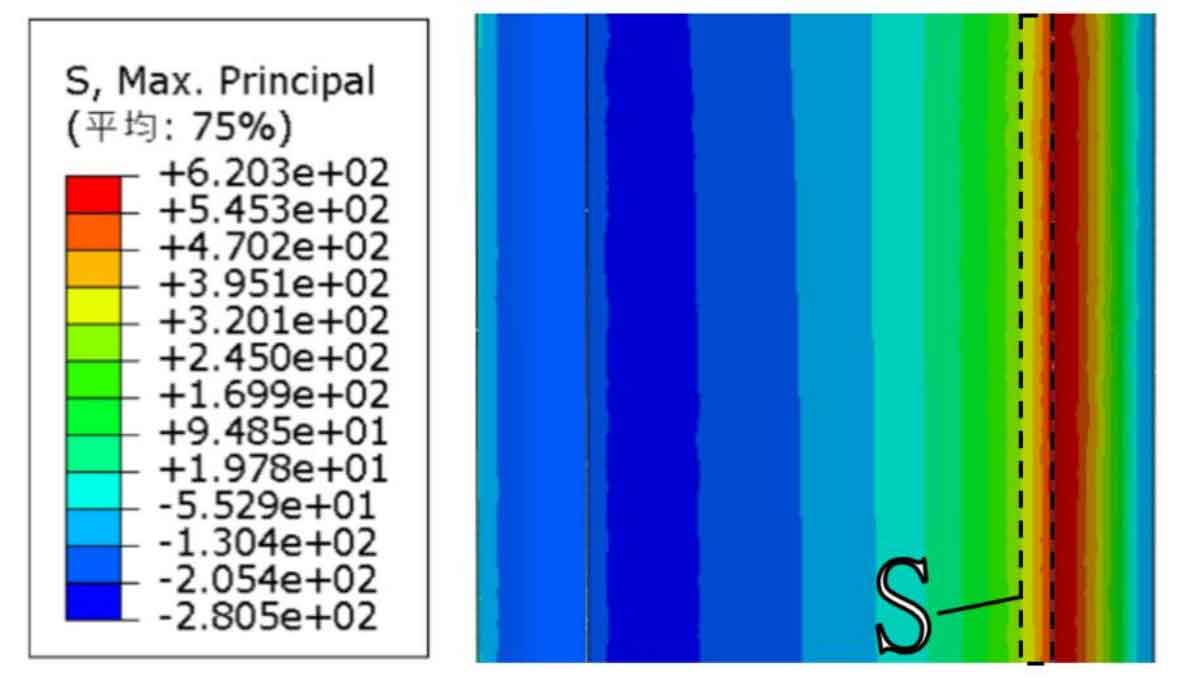
The stress distribution cloud map at the root of the tooth can be simulated through single tooth static finite element analysis when the testing machine is loaded. The stress distribution cloud map at the root of the tooth is shown in Figure 3, and the cross-sectional stress cloud map at the root of the tooth is shown in Figure 5.
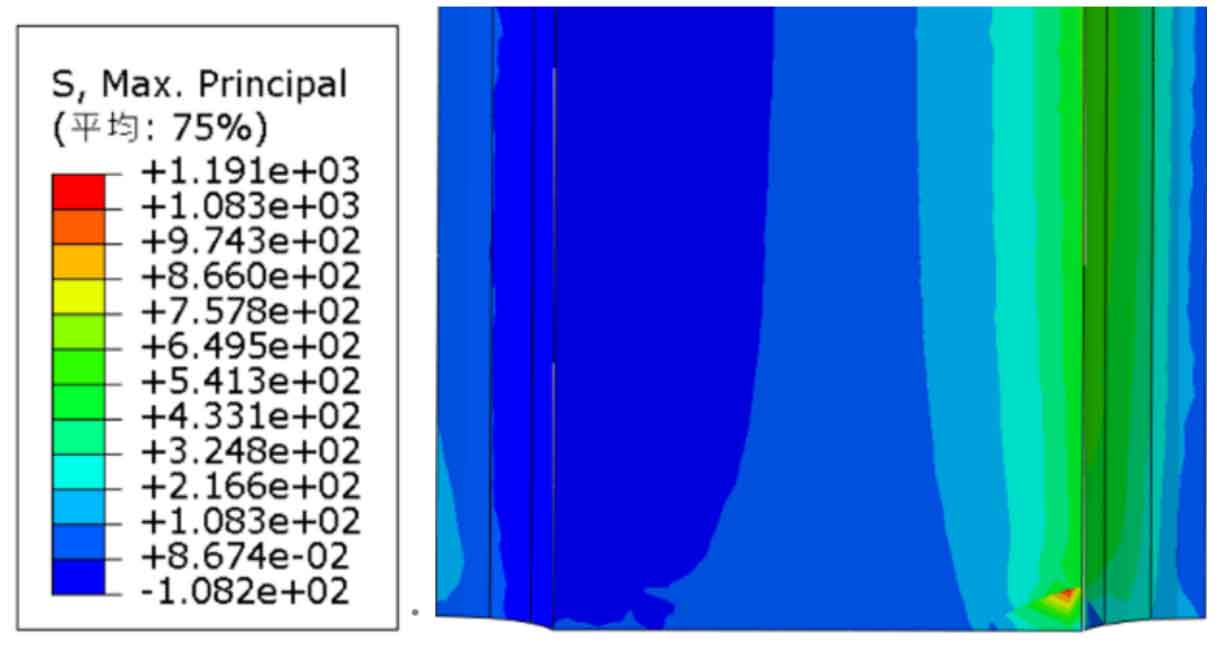
The stress distribution cloud map at the root of the preset tooth crack (1 × 0.5) is shown in Figure 4, and the cross-sectional stress cloud map at the root of the tooth is shown in Figure 6.
Based on the finite element results, it can be concluded that:
In the early stage of crack propagation, the stress at the crack tip of the tooth root is relatively high, which is about twice the maximum surface stress of the tooth root; Small cracks (1 × 0.5) have little effect on the stress at the root of the tooth, and only large stress exists at the crack tip area. The stress values at the rest of the surface of the tooth root are very small compared to the finite element model without cracks; Large cracks (exceeding the above dimensions) have a significant impact on the stress at the root of the tooth due to the influence of the crack cross-sectional area. However, the fatigue life corresponding to the propagation stage of large cracks is often less than 10%. Therefore, this chapter only predicts the initiation life of cylindrical gears and uses this as the fatigue life of cylindrical gears.
The stress distribution on the end face of cylindrical gears is uniform along the Z-axis direction, and the distribution changes along the X-axis direction. Therefore, when calculating the mean stress amplitude in the energy accumulation zone, the stress trend of different nodes on the end face of cylindrical gears inward along the X-axis direction is mainly studied. By comparing with the bending fatigue test, the position of the node with the highest principal stress in the simulation is consistent with the location of crack initiation in the bending fatigue test, proving that the finite element simulation method can accurately calculate the stress field distribution of cylindrical gears.
3. Bending fatigue test of cylindrical gears under single stage load
According to previous research, the root stress of this type of cylindrical gears corresponding to a fatigue life of 105 levels is 639.60 MPa. Conduct single stage bending fatigue tests on cylindrical gears within the high cycle fatigue range. Experiments were conducted on cylindrical gears specimens at 5 root stress levels. The stress level and loading load are shown in Table 4.
| Stress level | Loading load of testing machine (kN) |
| 510.00 | 79.18 |
| 541.25 | 84.12 |
| 572.50 | 89.08 |
| 603.75 | 94.04 |
| 635.00 | 99.02 |
Before starting the cylindrical gears, sand the cylindrical gears with sandpaper. According to previous experiments, strain gauges should be attached as close as possible to the tooth profile surface position on the crack propagation path, as shown in Figure 7. The strain gauge is a 1AA high-precision resistance type strain gauge, with a sensitive gate size of 3.6 mm x 3.9 mm. The strain gauge is connected to a signal acquisition instrument through enameled wire. The acquisition instrument model is MDR 80 data acquisition instrument, and the acquisition frequency is 2000 Hz. The loading frequency of the testing machine is about 150 Hz. According to the crack propagation test data mentioned earlier, when the frequency of the testing machine drops to 92% of the original frequency, it is considered that a tooth root crack is initiated. At this point, the test is stopped and the number of cycles is recorded as the bending fatigue life of the cylindrical gears specimen.
The test results of cylindrical gears are shown in Table 5.
| Stress level | Fatigue life 10 ^ 4 |
| 510.00 | 890.06 |
| 541.25 | 356.53 |
| 572.50 | 92.11 |
| 603.75 | 39.95 |
| 635.00 | 11.60 |
The collected strain signal was filtered and peak extracted. The strain load cycle curve at the tooth root of the cylindrical gears under a stress level of 572.50 MPa is shown in Figure 8.
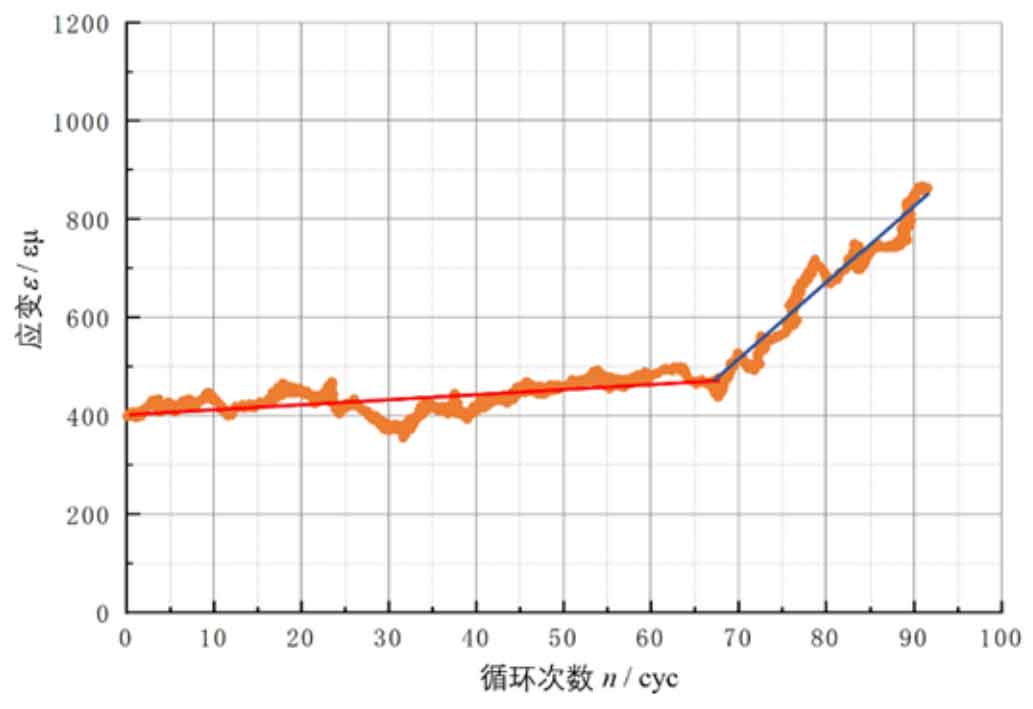
It can be seen from the graph that when the number of cycles is within the first 70% range of the fatigue life, the strain increases slowly with the increase of the number of cycles; When the number of cycles crosses the 70% boundary point, the strain increases with the increase of the number of cycles.