
I investigate large-module rack and pinion gears used in heavy vertical hoisting mechanisms, ship lifts, offshore lifting platforms, and other high-load transmission systems. In these applications, rack and pinion gears operate under complex service conditions, and the interactions among the motor, reducer, hydraulic loader, rack, pinion, and support structure become strongly coupled. During one complete meshing cycle, the contact pattern alternates among multi-tooth meshing, single-tooth meshing, and multi-tooth meshing. The single-tooth interval is especially important because the load is carried by fewer teeth, so the contact stress, root bending stress, and local deformation are usually higher than those in the multi-tooth interval. I therefore focus on the strength and stiffness of rack and pinion gears during single-tooth meshing and combine theoretical calculation, finite element simulation, and experimental verification.
The main variables I examine are root bending stress, tooth surface contact stress, single-tooth meshing stiffness, rotation angle, applied torque, and working load. I use six representative working conditions to represent acceleration, constant-speed motion, deceleration, upward motion, downward motion, headwind, tailwind, and different misload depths. The results show that the strength and stiffness of rack and pinion gears increase with rotation angle and load, and the theoretical, simulated, and experimental values agree within approximately ten percent in most cases.
Experimental System for Rack and Pinion Gears
I built a vertical rack and pinion gears hoisting test bench to reproduce the working conditions of a large hoisting mechanism. The test bench contains two rack and pinion gears transmission systems. Each transmission chain consists of a motor, a torque and speed meter, and a bevel gear planetary reducer. A bevel gear shaft rigidly connects the two transmission systems so that the two sides remain synchronized. The hydraulic loading device is installed in the middle of the lifting platform. A tension sensor and a pressure sensor are installed at the top of the hydraulic cylinder to measure the real-time force in the hydraulic system. The motor speed, rotation direction, hydraulic cylinder extension direction, and hydraulic pressure are controlled by a PLC cabinet. The rack support columns are reinforced by triangular truss steel structures, and the top of the columns is connected by a box beam. This layout increases the global stiffness and stability of the rack and pinion gears test bench.
The geometric parameters of the rack and pinion gears are listed in Table 1. The values in parentheses correspond to a large-scale ship lift application. The test bench uses a smaller module and face width than the full-scale rack and pinion gears, but the pressure angle, addendum coefficient, and clearance coefficient are kept consistent so that the single-tooth meshing behavior remains comparable.
| Parameter | Test bench value | Large-scale rack and pinion gears value |
|---|---|---|
| Module m (mm) | 18 | 62.667 |
| Pinion teeth Z1 | 17 | 16 |
| Pitch diameter d1 (mm) | 306 | 1002.672 |
| Pressure angle alpha (deg) | 20 | 20 |
| Pinion face width b1 (mm) | 100 | 610 |
| Rack face width b2 (mm) | 150 | – |
| Rack height H (mm) | 80 | – |
| Addendum coefficient ha* | 1 | 1 |
| Clearance coefficient c* | 0.25 | 0.25 |
| Center-to-rack datum distance L (mm) | 153 | – |
The material parameters of the rack and pinion gears are listed in Table 2. Both the pinion and the rack are made of the same alloy steel, which simplifies the elastic contact analysis and ensures that the elastic modulus and Poisson ratio are identical on both sides of the meshing pair.
| Parameter | Value |
|---|---|
| Elastic modulus E (N/mm2) | 2.11 x 10^5 |
| Poisson ratio mu | 0.29 |
| Density rho (g/mm3) | 7.85 x 10^-3 |
| Ultimate strength sigma_b (MPa) | 710 |
| Yield strength sigma_s (MPa) | 510 |
| Hardness | 280 HBS |
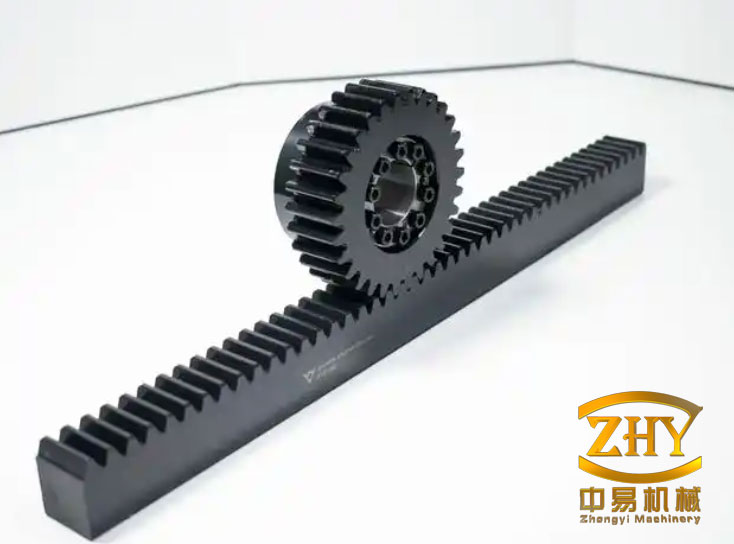
Theoretical Strength of Rack and Pinion Gears
I first calculate the root bending fatigue strength of the rack and pinion gears. The dangerous section is determined by the thirty-degree tangent method. The root bending stress of the pinion tooth is expressed as
$$ \sigma_F = \frac{K_F F’_n Y_{Fa} Y_{Sa} Y_\epsilon}{b_1 m} $$
where K_F is the load factor, F’_n is the equivalent applied force on the rack and pinion gears, Y_Fa is the tooth form factor, Y_Sa is the stress correction factor when the load is applied at the tooth tip, Y_epsilon is the contact ratio factor, b1 is the pinion face width, and m is the module. For the present rack and pinion gears, I take K_F = 1.95, Y_Fa = 2.22, Y_Sa = 1.53, and Y_epsilon is calculated from the contact ratio.
The contact ratio factor is
$$ Y_\epsilon = 0.25 + \frac{0.75}{\epsilon_\alpha} $$
For the rack and pinion gears analyzed here, the contact ratio is epsilon_alpha = 1.7478. Therefore,
$$ Y_\epsilon = 0.25 + \frac{0.75}{1.7478} = 0.679 $$
To relate the test bench to the large-scale rack and pinion gears, I use a scaling method. When the product b1 m of the test bench is smaller than that of the full-scale rack and pinion gears by a factor a, the applied load should be reduced by the same factor so that the root bending stress remains similar. The scaling relation is
$$ F’_n = \frac{F_n}{a} = \frac{F_n}{6.1 \times 3.4815} = 0.047 F_n $$
where F_n is the working load on the large-scale rack and pinion gears. Substituting this equivalent load into the bending stress formula gives the root bending stress of the test bench under the same stress level as the full-scale rack and pinion gears.
The contact fatigue strength of the rack and pinion gears is calculated from an improved Hertz contact model. The contact stress is
$$ \sigma_H = Z_E Z_H Z_\epsilon \sqrt{\frac{v+1}{v}\frac{2K_H T_1}{b d_1^2}} $$
where Z_E is the elastic coefficient, Z_H is the zone factor, Z_epsilon is the contact ratio factor, v is the gear ratio, K_H is the load factor for contact strength, T1 is the torque on the pinion, b is the face width, and d1 is the pitch diameter. For rack and pinion gears, the rack can be treated as a gear with infinite radius, so the gear ratio v approaches infinity. The contact stress expression therefore reduces to
$$ \sigma_H = Z_E Z_H Z_\epsilon \sqrt{\frac{K_H F”_n}{b d_1}} $$
where F”_n is the equivalent contact load. The elastic coefficient for two steel bodies with the same elastic modulus and Poisson ratio is
$$ Z_E = \sqrt{\frac{1}{\pi \left(\frac{1-\mu_1^2}{E_1}+\frac{1-\mu_2^2}{E_2}\right)}} = 191.482 $$
The zone factor at the pitch point is
$$ Z_H = \frac{1}{\sqrt{\sin\alpha \cos\alpha}} = 1.764 $$
The contact ratio factor is
$$ Z_\epsilon = \sqrt{\frac{4-\epsilon_\alpha}{3}} = 0.86645 $$
The torque on the pinion is related to the contact force by
$$ T_1 = F”_n \frac{d_1}{2} $$
For the large-scale rack and pinion gears, the equivalent contact load on the test bench is scaled as
$$ F”_n = \frac{F_n}{u} = \frac{F_n}{6.1 \times 3.28} = 0.05 F_n $$
This scaling ensures that the contact stress in the test bench rack and pinion gears is close to that in the full-scale rack and pinion gears under the same working condition. The six working conditions and the corresponding loads are summarized in Table 3. For upward motion, a positive value indicates that the upper tooth flank is loaded, while a negative value indicates that the lower tooth flank is loaded. For downward motion, a positive value indicates that the lower tooth flank is loaded, while a negative value indicates that the upper tooth flank is loaded.
| Condition | Working description for rack and pinion gears | Large-scale load F_n (kN) | Bending load F’_n (kN) | Contact load F”_n (kN) |
|---|---|---|---|---|
| 1 | -10 cm misload, headwind acceleration upward | 396 | 18.65 | 19.81 |
| 2 | +10 cm misload, headwind constant speed downward | -583 | -27.45 | -29.16 |
| 3 | -5 cm misload, tailwind constant speed upward | -770 | -36.25 | -38.52 |
| 4 | +5 cm misload, headwind acceleration downward | 957 | 45.06 | 47.87 |
| 5 | +5 cm misload, tailwind deceleration upward | -1207 | -56.83 | -60.38 |
| 6 | -5 cm misload, tailwind deceleration downward | 1362 | 64.13 | 68.14 |
Stiffness Theory for Rack and Pinion Gears
The meshing stiffness of rack and pinion gears represents the ability to resist elastic deformation under external load. I define the single-tooth stiffness as
$$ k = \frac{F”_n}{\delta} $$
where delta is the total deformation along the line of action. Because the contact ratio of the rack and pinion gears is epsilon_alpha = 1.7478, the single-tooth working interval is
$$ \theta = \frac{360^\circ}{Z_1}(2-\epsilon_\alpha) = 5.34^\circ $$
This interval is the core region for single-tooth meshing of rack and pinion gears. To calculate the stiffness accurately, I use an energy method. During meshing, five energy components are considered: Hertz contact energy, bending energy, shear energy, axial compression energy, and fillet foundation deformation energy. The total energy is
$$ U_t = \frac{F_n”^2}{2k_t} = U_h + U_b + U_s + U_a + U_f = \frac{F_n”^2}{2}\left(\frac{1}{k_h}+\frac{1}{k_b}+\frac{1}{k_s}+\frac{1}{k_a}+\frac{1}{k_f}\right) $$
The comprehensive meshing stiffness is therefore
$$ k_t = \frac{1}{\frac{1}{k_h}+\frac{1}{k_b}+\frac{1}{k_s}+\frac{1}{k_a}+\frac{1}{k_f}} $$
The Hertz contact stiffness is nearly constant over the meshing cycle and is written as
$$ k_h = \frac{\pi E b_1}{4(1-\mu^2)} $$
For the bending, shear, and axial compression stiffnesses, I treat the tooth as a variable-section cantilever beam fixed at the root circle. The meshing force is decomposed into an axial component and a transverse component:
$$ F_X = F”_n \sin\alpha_1 $$
$$ F_Y = F”_n \cos\alpha_1 $$
These two components produce an additional bending moment after translation to the tooth centerline:
$$ M = F_Y h – F_X d $$
The distances d and h are
$$ d = r_b\left[(\alpha_1+\theta_f)\sin\alpha_1 + \cos\alpha_1 – \cos\theta_f\right] $$
$$ h = r_b\left[(\alpha_1+\theta_f)\cos\alpha_1 – \sin\alpha_1\right] $$
The half-angle of the root circle is
$$ \theta_f = \frac{2\pi}{2Z_1} = 10.588^\circ $$
The bending stiffness of a single tooth in the rack and pinion gears is calculated from
$$ \frac{1}{k_b} = \int_{-\alpha_1}^{\theta_f} \frac{3\left\{1+\cos\alpha_1\left[(\theta_f-\alpha)\sin\alpha-\cos\alpha\right]\right\}^2(\theta_f-\alpha)\cos\alpha}{2Eb\left[\sin\alpha+(\theta_f-\alpha)\cos\alpha\right]^3} d\alpha $$
The shear stiffness is
$$ \frac{1}{k_s} = \int_{-\alpha_1}^{\theta_f} \frac{1.2(1+\mu)(\theta_f-\alpha)\cos\alpha \cos^2\alpha_1}{Eb\left[\sin\alpha+(\theta_f-\alpha)\cos\alpha\right]} d\alpha $$
The axial compression stiffness is
$$ \frac{1}{k_a} = \int_{-\alpha_1}^{\theta_f} \frac{(\theta_f-\alpha)\cos\alpha \sin^2\alpha_1}{2Eb\left[\sin\alpha+(\theta_f-\alpha)\cos\alpha\right]} d\alpha $$
The fillet foundation stiffness is
$$ k_f = \frac{F”_n}{\delta_f} $$
where the foundation deformation is
$$ \delta_f = \frac{F”_n \cos^2\alpha_1}{b_1 E}\left[L^*\left(\frac{u_f}{S_f}\right)^2 + M^*\left(\frac{u_f}{S_f}\right) + P^*(1+Q^*\tan\alpha_1)\right] $$
Therefore,
$$ \frac{1}{k_f} = \frac{\cos^2\alpha_1}{b_1 E}\left[L^*\left(\frac{u_f}{S_f}\right)^2 + M^*\left(\frac{u_f}{S_f}\right) + P^*(1+Q^*\tan\alpha_1)\right] $$
The coefficients L*, M*, P*, and Q* are obtained from polynomial functions of the form
$$ F_i^*(h_i,\theta_f) = \frac{A_i}{\theta_f^2} + B_i h_i^2 + \frac{C_i h_i}{\theta_f} + \frac{D_i}{\theta_f} + E_i h_i + F_i $$
where i = 1, 2, 3, 4. The polynomial coefficients are listed in Table 4, and the calculated coefficients are listed in Table 5.
| i | A_i | B_i | C_i | D_i | E_i | F_i |
|---|---|---|---|---|---|---|
| 1 | -5.574 x 10^-5 | -1.9986 x 10^-3 | -2.3015 x 10^-4 | 4.7702 x 10^-3 | 0.0271 | 6.8045 |
| 2 | 60.111 x 10^-5 | 28.100 x 10^-3 | -83.431 x 10^-4 | -9.9256 x 10^-3 | 0.1624 | 0.9086 |
| 3 | -50.952 x 10^-5 | 185.50 x 10^-3 | 0.0538 x 10^-4 | 53.3 x 10^-3 | 0.2895 | 0.9236 |
| 4 | -6.2042 x 10^-5 | 9.0889 x 10^-4 | -4.0964 x 10^-4 | 7.8297 x 10^-3 | -0.1472 | 0.6904 |
| Coefficient | L* | M* | P* | Q* |
|---|---|---|---|---|
| Calculated value | 6.8826 | 1.3699 | 3.2166 | 0.3472 |
The geometric quantities used in the foundation stiffness are
$$ S_f = 2\theta_f r_f = 48.23 \text{ mm} $$
$$ u_f = \frac{r_b}{\cos\alpha_1} – r_f $$
$$ h_i = \frac{r_f}{r_{int}} = \frac{130.5}{50} = 2.61 $$
For the single-tooth meshing interval, the critical radii are
$$ r_{OC} = \sqrt{l_{ON1}^2 + l_{N1C}^2} $$
$$ r_{OD} = \sqrt{l_{ON1}^2 + l_{N1D}^2} $$
where
$$ l_{N1C} = \sqrt{r_a^2 – r_b^2} – P_b = 39.438 \text{ mm} $$
$$ l_{N1D} = l_{N1C} + l_{CD} = 85.838 \text{ mm} $$
$$ l_{CD} = (2-\epsilon_\alpha)\epsilon_\alpha P_b = 46.40 \text{ mm} $$
The corresponding angular limits are
$$ \alpha_{1C} = \alpha_C – \theta_C $$
$$ \alpha_{1D} = \alpha_D – \theta_D $$
with
$$ \alpha_C = \arccos\left(\frac{r_b}{r_{OC}}\right) $$
$$ \alpha_D = \arccos\left(\frac{r_b}{r_{OD}}\right) $$
Solving these relations gives the single-tooth meshing interval of the rack and pinion gears as
$$ \alpha_1 \in [11.27^\circ, 29.767^\circ] $$
This interval is used to evaluate the variation of stiffness and strength during the single-tooth phase of the rack and pinion gears.
Finite Element Simulation of Rack and Pinion Gears
I built the solid model of the rack and pinion gears and assembled the meshing pair in a CAD environment. The model was then imported into finite element software. Because the pinion and rack are made of the same material, the same elastic modulus, Poisson ratio, and density were assigned to both bodies. The global mesh size was set to 10 mm, and the contact region was refined to 5 mm. The resulting mesh contained 50,264 elements and 10,732 nodes. A rotary support was applied to the inner cylindrical surface of the pinion, and a torque was applied to the pinion shaft. The bottom of the rack was fixed. The boundary conditions and mesh arrangement were designed to capture the contact and root bending behavior of the rack and pinion gears during single-tooth meshing.
The torque values applied to the pinion shaft are listed in Table 6. The bending strength cases and contact strength cases use slightly different torque values because the equivalent loads are scaled differently for root bending and surface contact. The signs follow the load direction of the rack and pinion gears in the six working conditions.
| Condition | Bending torque (10^6 N mm) | Contact torque (10^6 N mm) |
|---|---|---|
| 1 | 2.68 | 2.85 |
| 2 | -3.94 | 4.19 |
| 3 | -5.20 | 5.54 |
| 4 | 6.46 | 6.88 |
| 5 | -8.15 | 8.68 |
| 6 | 9.20 | 9.80 |
The static simulation results for bending stress and contact stress are compared with the theoretical calculations in Table 7. The bending stress increases as the rotation angle increases. This behavior occurs because the meshing point moves farther from the root as the meshing process proceeds. If the tooth is treated as a cantilever beam, the bending moment at the fixed root increases with the distance between the load application point and the root. The simulation results and theoretical results differ by only about 2.4 percent to 4.0 percent, which indicates that the theoretical model captures the root bending behavior of the rack and pinion gears well.
The contact stress is relatively stable over the single-tooth interval, with a small transient near the initial engagement position. The theoretical and simulated contact stresses differ by less than about 5.4 percent in the six conditions. The small discrepancies come from mesh discretization, local contact stiffness, and the idealized assumptions used in the Hertz model. The contact stress results show that surface strengthening, proper lubrication, and profile modification are important for avoiding pitting and wear in rack and pinion gears.
| Condition | Bending stress theory (MPa) | Bending stress simulation (MPa) | Bending error (%) | Contact stress theory (MPa) | Contact stress simulation (MPa) | Contact error (%) |
|---|---|---|---|---|---|---|
| 1 | 46.50 | 47.64 | 2.40 | 258.15 | 244.28 | 5.37 |
| 2 | 68.46 | 65.84 | 3.82 | 313.22 | 329.91 | 5.32 |
| 3 | 90.42 | 86.87 | 3.92 | 359.97 | 355.37 | 1.28 |
| 4 | 112.38 | 107.88 | 4.00 | 401.31 | 391.70 | 2.39 |
| 5 | 141.74 | 136.05 | 4.01 | 450.68 | 433.88 | 3.73 |
| 6 | 159.94 | 153.53 | 4.01 | 478.74 | 498.29 | 4.08 |
Stiffness Simulation of Rack and Pinion Gears
I used structural static analysis to evaluate the single-tooth stiffness of the rack and pinion gears. A torque was applied to the inner cylindrical surface of the pinion, and a fixed support was applied to the bottom of the rack. The stiffness was calculated from the torque and the angular deformation. The relation is
$$ k = \frac{T_1}{r_b^2 \Delta\theta} $$
where T1 is the torque applied to the pinion, r_b is the base circle radius, and Delta theta is the angular deformation at the selected meshing position. Because finite element analysis cannot directly produce a continuous stiffness curve over time, I selected nine equally spaced meshing positions within the single-tooth interval and recalculated the deformation at each position. The rotational deformation was obtained from the Z-direction displacement of the pinion and converted to an angle by dividing by the pitch radius.
The simulation settings for stiffness evaluation are summarized in Table 8. The same six working conditions were used. The results show that the single-tooth stiffness of the rack and pinion gears increases as the rotation angle increases. In addition, for the same meshing position, a higher working load produces a larger stiffness. This trend is consistent with the strength variation. The reason is that the initial engagement stage contains impact and vibration, which increases the local deformation. As the meshing position moves toward the later part of the single-tooth interval, the contact becomes more stable and the comprehensive deformation decreases. Therefore, the stiffness of the rack and pinion gears rises. This behavior is important for the dynamic response of rack and pinion gears because a time-varying stiffness can excite vibration and noise.
| Parameter | Value or description |
|---|---|
| Torque application | Pinion shaft, as listed in Table 6 |
| Support condition | Rotary support on pinion inner surface, fixed rack bottom |
| Meshing positions | Nine equally spaced positions in the single-tooth interval |
| Deformation output | Z-direction displacement divided by pitch radius |
| Stiffness equation | k = T1 / (r_b^2 Delta theta) |
Experimental Verification of Rack and Pinion Gears
I performed static and dynamic tests on the rack and pinion gears test bench. The working conditions are listed in Table 9. A positive platform load indicates upward motion, while a negative platform load indicates downward motion. The hydraulic loading device was used to apply the required load, and the pressure sensor was used to monitor the force. A multi-channel static strain test analysis system was used to collect strain data from the pinion root. Because the tooth surface is in rolling and sliding contact, direct measurement of contact stress with strain gauges is difficult and may damage the gauges. Therefore, the experimental verification focused on the root bending stress of the rack and pinion gears.
I attached strain gauges at two types of locations. The first location was the center of the pinion root, where the finite element analysis predicted the maximum bending stress. The second location was the edge of the pinion root. The strain gauges were oriented along the tooth profile direction to measure the bending strain corresponding to the theoretical root stress. The data were averaged over a ten-second interval to reduce the influence of electrical noise and short-term fluctuations. The experimental bending stresses are compared with the theoretical and simulated values in Table 10.
| Condition | Working description for rack and pinion gears | Platform load (10^4 N) |
|---|---|---|
| 1 | -10 cm misload, headwind acceleration upward | 0 + 1.9 |
| 2 | +10 cm misload, headwind constant speed downward | -(0.9 + 1.9) |
| 3 | -5 cm misload, tailwind constant speed upward | -(1.8 + 1.9) |
| 4 | +5 cm misload, headwind acceleration downward | 2.7 + 1.9 |
| 5 | +5 cm misload, tailwind deceleration upward | -(3.6 + 1.9) |
| 6 | -5 cm misload, tailwind deceleration downward | 4.5 + 1.9 |
| Condition | Theory (MPa) | Simulation (MPa) | Experiment (MPa) | Theory-experiment error (%) | Simulation-experiment error (%) |
|---|---|---|---|---|---|
| 1 | 46.50 | 47.64 | 50.02 | 7.57 | 5.00 |
| 2 | 68.46 | 65.84 | 74.48 | 8.79 | 13.12 |
| 3 | 90.42 | 86.87 | 96.76 | 7.01 | 11.38 |
| 4 | 112.38 | 107.88 | 103.38 | 8.01 | 4.17 |
| 5 | 141.74 | 136.05 | 141.68 | 0.04 | 4.14 |
| 6 | 159.94 | 153.53 | 167.56 | 4.76 | 9.14 |
The experimental results show that the root bending stress of the rack and pinion gears increases with load and rotation angle. The theoretical and experimental values differ by approximately 0.04 percent to 8.79 percent. The simulated and experimental values differ by approximately 4.14 percent to 13.12 percent. The larger deviations in some conditions are likely caused by the loading time of the hydraulic cylinder, the early acquisition of strain data, the local stiffness of the support structure, and the installation position of the strain gauges. Overall, the experimental data confirm that the theoretical and finite element models are accurate enough for engineering evaluation of rack and pinion gears.
Discussion of Strength and Stiffness Behavior
The single-tooth meshing interval is the most critical part of the working cycle for rack and pinion gears. In the multi-tooth interval, the load is shared by two or more teeth, so the contact stress and root bending stress are lower. In the single-tooth interval, the entire normal load is carried by one tooth pair, which increases the local contact pressure and the root bending moment. This is why I focus on the single-tooth interval rather than only on the average meshing behavior. The results confirm that both the strength and stiffness of rack and pinion gears are load-dependent and angle-dependent.
For bending strength, the root stress increases approximately linearly with the applied load in the range studied. This trend is expected from the bending stress formula, where the stress is proportional to the applied force and the tooth form factors, and inversely proportional to the face width and module. For large-module rack and pinion gears, the module is large, so the root stress can be reduced by increasing the module. However, increasing the module also changes the contact ratio, the sliding velocity, and the dynamic behavior. Therefore, module selection must be balanced with contact strength, bending strength, manufacturing cost, and installation space.
For contact strength, the tooth surface stress is influenced by the equivalent contact load, the face width, the pitch diameter, the elastic coefficient, and the contact ratio factor. The simulation results show that the contact stress remains relatively stable after the initial engagement transient. This stability means that the contact fatigue life of rack and pinion gears is mainly controlled by the steady contact stress level and the number of load cycles. Surface hardening, shot peening, and proper lubrication can improve the contact fatigue resistance. In addition, tooth profile modification can reduce the impact at the beginning of single-tooth meshing and smooth the transition between multi-tooth and single-tooth contact.
For stiffness, the single-tooth stiffness increases with rotation angle because the contact point moves away from the root and the deformation pattern changes. The stiffness also increases with load because the real contact area and the number of micro-contacts increase as the load rises, which increases the effective contact stiffness. The time-varying stiffness of rack and pinion gears is an important excitation source for vibration. A sudden change in stiffness at the transition from multi-tooth to single-tooth meshing can produce impact and noise. Therefore, the design of rack and pinion gears should consider not only static strength but also dynamic stiffness variation.
The theoretical, simulated, and experimental results all point to the same conclusion: the single-tooth meshing strength and stiffness of rack and pinion gears increase with rotation angle and load. The consistency among the three methods supports the reliability of the modeling approach. The finite element model can capture the stress concentration at the root and the contact pressure distribution on the tooth surface, while the theoretical model provides a fast estimation tool. The experimental results provide the necessary validation for both methods.
Engineering Implications for Rack and Pinion Gears
Several engineering implications can be drawn for the design and maintenance of rack and pinion gears. First, the root fillet should be carefully designed to reduce stress concentration. A larger fillet radius, a smooth transition curve, and appropriate heat treatment can improve the bending fatigue strength. Second, the tooth surface should be strengthened by carburizing, nitriding, induction hardening, or shot peening to increase contact fatigue resistance. Third, the lubrication condition should be controlled because the contact stress in rack and pinion gears can be high, and inadequate lubrication can lead to scuffing, pitting, and wear. Fourth, the alignment of the rack and pinion gears should be maintained during installation because misalignment can cause edge contact and a significant increase in local stress. Fifth, condition monitoring should focus on the single-tooth meshing phase because damage often initiates in this phase.
I also note that the working conditions of rack and pinion gears are not limited to the six cases studied here. In real service, the load may vary continuously, the speed may change, and the environmental conditions may introduce additional effects such as temperature variation, contamination, and corrosion. Therefore, the strength and stiffness analysis should be extended to random load spectra and dynamic operating conditions. A probabilistic fatigue model could be used to evaluate the reliability of rack and pinion gears under uncertain loads. A dynamic model with time-varying stiffness could be used to predict vibration and noise. A thermal-mechanical coupling model could be used to evaluate the effect of friction heating on contact fatigue.
Conclusions
I have analyzed the single-tooth meshing strength and stiffness of large-module rack and pinion gears through theoretical calculation, finite element simulation, and experimental verification. The following conclusions can be drawn.
First, the root bending stress and contact stress of rack and pinion gears increase with load. The bending stress increases with rotation angle because the meshing point moves away from the root. The contact stress remains relatively stable after the initial engagement transient, but the peak value increases with load. The theoretical and simulated stresses agree within about ten percent for all six working conditions.
Second, the single-tooth meshing stiffness of rack and pinion gears increases with rotation angle and load. This trend is consistent with the strength variation. The stiffness is lower at the beginning of the single-tooth interval because of impact and vibration, and it becomes higher as the meshing becomes more stable. The time-varying stiffness should be considered in dynamic analysis and vibration control of rack and pinion gears.
Third, the experimental root bending stresses agree with the theoretical and simulated values within approximately ten percent. The small discrepancies are attributed to measurement noise, hydraulic loading time, support flexibility, and gauge placement. The experimental verification confirms that the proposed theoretical and finite element models are suitable for engineering evaluation of rack and pinion gears.
Fourth, the single-tooth interval is the most critical phase for the strength and stiffness of rack and pinion gears. Design improvements such as root fillet optimization, surface strengthening, profile modification, and proper lubrication can improve the load-carrying capacity and service life of rack and pinion gears. The results provide a useful basis for the static and dynamic analysis of large-module rack and pinion gears in heavy hoisting mechanisms.
Overall, my study shows that the strength and stiffness of rack and pinion gears are strongly influenced by the single-tooth meshing condition. A combined theoretical, numerical, and experimental approach is effective for evaluating the load-carrying behavior of rack and pinion gears. The findings can support the design, manufacturing, installation, and maintenance of high-load rack and pinion gears in complex working environments.