In my research, I aimed to investigate the specific influence of backlash on the dynamic characteristics of marine herringbone gears. I established a dynamic model of herringbone gears in the simulation software Adams, and the error between simulation results and theoretical values was controlled within 1.5%. By comprehensively comparing the motion parameters and stability performance of herringbone gears under different backlash values and different motion states, I found that the presence of backlash affects the system under all conditions. During the starting phase, backlash intensifies the impact of tooth surface collisions, while during the steady-speed phase, backlash further aggravates the time-varying stiffness impact caused by changes in the contact ratio. This provides a reference for optimizing vibration and noise reduction performance of herringbone gears.
Introduction
Gear transmission is one of the main forms of mechanical operation and energy transfer, widely used in automobiles, energy, aerospace, wind power, ship transportation, and many other engineering fields. Compared with belt and chain drives, gear drives have many advantages such as long life, smooth transmission, compact structure, high power transmission, and wide application range. For large ships, which feature long spans, heavy loads, high precision, multiple inputs, and multiple outputs, marine gearboxes not only need to bear the thrust of the shaft system and transfer the prime mover energy to the propeller at the stern but also need to realize functions such as forward, reverse, clutch, and deceleration. These gearboxes are critical components in the entire power system. Due to the high-speed and heavy-load working environment, large marine gearboxes often adopt herringbone gear transmission to ensure smooth and reliable system operation. Typically, to provide sufficient space for tooth surface lubrication, considering manufacturing and assembly errors, as well as wear during operation, a certain backlash exists between meshing gear pairs. This backlash causes periodic impact vibration processes of contact, separation, and re-contact during gear meshing, generating noise and adversely affecting the system. Previous studies have used finite element models considering time-varying meshing stiffness, backlash, bearing clearance, transmission errors, and tooth surface friction to explore nonlinear characteristics such as single/double impact, chattering, and chaos. Other researchers have analyzed the numerical relationship between impact velocity and impact force during gear meshing by considering out-of-line meshing due to clearance. Some have established dynamic models of gear-rotor-bearing systems considering time-varying meshing stiffness, bearing support stiffness, and bearing clearance, obtaining gear dynamics conclusions from simulation results. In this work, I focused on a large marine herringbone gearbox, built a herringbone gear transmission system model on the Adams platform, studied the impact of different backlash values on the impact and vibration of the herringbone gear system, and further established the relationship between backlash and the dynamic characteristics of herringbone gear operation. This provides a basis for future design and production.
Herringbone Gear Transmission Coupling Model
To study the herringbone gear transmission system with backlash, I first needed to establish a reasonable and accurate three-dimensional model. By discussing the calculation relationship between the actual center distance and the meshing tooth surfaces, I controlled the backlash size reasonably. I then compared the theoretical calculation values with the simulation results to verify the reliability and scientificity of the model.
Relationship between Backlash and Center Distance
For a pair of meshing gears, the difference between the tooth space width and the tooth thickness on the pitch circle is the backlash of the pair. In practical engineering, backlash can be further classified into normal backlash \(j_{bn}\), circumferential backlash \(j_{wn}\), and radial backlash \(j_r\). The center distance for involute gears can be calculated as follows:
$$
\operatorname{inv}\alpha’ = \frac{2(x_1+x_2)}{z_1+z_2}\tan\alpha + \operatorname{inv}\alpha
$$
$$
a’ = r_1′ + r_2′ = (r_1+r_2)\frac{\cos\alpha}{\cos\alpha’}
$$
where \(z_1, z_2\) are the number of teeth, \(x_1, x_2\) are the modification coefficients, \(\alpha\) is the pressure angle, \(\alpha’\) is the meshing angle, \(r_1, r_2\) are the pitch circle radii, \(a’\) is the actual center distance, and \(r_1′, r_2’\) are the pitch circle radii of the two gears.
The normal backlash \(j_{bn}\) can be expressed as:
$$
j_{bt} = p_b – (s_{b1} – s_{b2}) + 2(r_{b1}+r_{b2})\operatorname{inv}\alpha_{wt}
$$
where \(r_{b1}, r_{b2}\) are the base circle radii of gears 1 and 2, \(\alpha_{wt}\) is the meshing angle, \(s_{b1}, s_{b2}\) are the base circle tooth thicknesses, and \(p_b\) is the base circle pitch.
For helical gears, the normal backlash \(j_{bn}\) is derived as:
$$
j_{bn} = j_{bt} \times \cos\beta_b
$$
Substituting the previous equation yields:
$$
j_{bn} = P_{bn} – (s_{bn1}+s_{bn2}) + 2(r_{b1}+r_{b2})\operatorname{inv}\alpha_{wt} \times \cos\beta_b
$$
where \(P_{bn}\) is the base normal pitch, \(s_{bn}\) is the base normal tooth thickness, and \(\beta_b\) is the base helix angle.
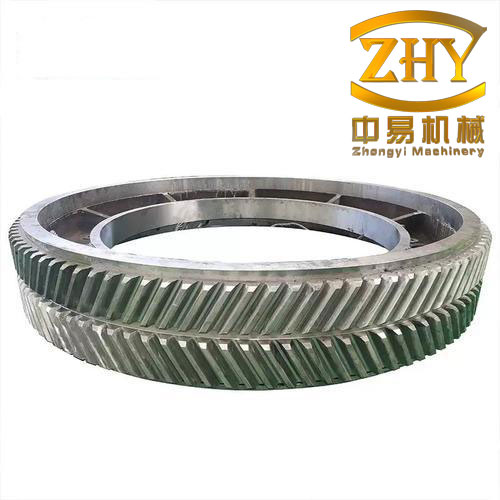
I used parametric modeling software to establish a meshing herringbone gear pair. The specific parameters are listed in Table 1.
| Parameter | Pinion | Gear |
|---|---|---|
| Number of teeth | 48 | 80 |
| Module (mm) | 2 | 2 |
| Helix angle (°) | 18 | 18 |
| Pressure angle (°) | 20 | 20 |
Table 1: Geometric parameters of the herringbone gear pair.
By applying Equation (4), I obtained the center distances corresponding to specific backlash values, as shown in Table 2.
| Backlash (mm) | 0 | 0.1 | 0.2 |
|---|---|---|---|
| Center distance (mm) | 67.2942 | 67.4393 | 67.5824 |
Table 2: Center distance corresponding to different backlash values.
Model Establishment and Reliability Verification
I imported the geometric model into Adams and set the corresponding boundary conditions and constraints to establish the simulation model of the herringbone gear system. To avoid system oscillation divergence due to sudden changes in speed and load, I used the STEP function to gradually apply torque and speed. The pinion was gradually accelerated from rest to 60 r/min within 0–0.02 s, and the load torque on the gear was gradually increased to 10,000 N·mm within 0–0.04 s. I selected the GSTIFF integrator, S12 integration format, and an integration error of 0.0001. The simulation time was set to 0.5 s with 10,000 steps. Based on the simulation results, I obtained the variation curves of the mesh force components on the tooth surfaces.
After 0.04 s, the applied load reached a steady value. The average mesh force fluctuated around its mean, which aligns with the vibration impact caused by gear meshing and dismeshing in actual conditions. The axial resultant force \(F_a\) exhibited symmetric fluctuations, which is due to transient left-right imbalance caused by tooth shape factors during transmission. Within 0–0.5 s, the average axial force \(F_a\) was about 1.2833 N, accounting for 1.68% of the single-sided peak axial force. This indicates that during steady transmission, the axial forces almost cancel each other out, which is consistent with the structural characteristic of herringbone gears having opposite axial directions on both sides, reflecting their smooth transmission property.
According to the helical gear force calculation formula, I computed the theoretical values of tangential force \(F_t\), radial force \(F_r\), axial force \(F_a\), and normal force \(F_n\):
$$
F_t = \frac{2T_1}{d_1}
$$
$$
F_r = \frac{F_t \tan\alpha_n}{\cos\beta}
$$
$$
F_a = F_t \tan\beta
$$
$$
F_n = \frac{F_t}{\cos\alpha_n \cos\beta} = \frac{F_t}{\cos\alpha_t \cos\beta_b}
$$
where \(T_1\) is the torque on the pinion (N·mm), \(d_1\) is the pitch circle diameter of the pinion (mm), \(\beta\) is the pitch helix angle, \(\beta_b\) is the base helix angle, \(\alpha_n\) is the normal pressure angle, and \(\alpha_t\) is the transverse pressure angle.
Based on the gear parameters and load conditions, the comparison between theoretical calculation values and actual simulation values is shown in Table 3.
| Parameter | Theoretical value (N) | Simulation average (N) | Error (%) |
|---|---|---|---|
| Tangential force \(F_t\) | 237.7641 | 235.1295 | 1.1081 |
| Radial force \(F_r\) | 90.9926 | 90.0409 | 1.0459 |
| Axial force \(F_a\) | 77.2542 | 76.2267 | 1.3301 |
| Total normal force \(F_n\) | 266.0444 | 263.8335 | 0.8310 |
Table 3: Comparison between theoretical and simulation values of mesh forces.
The analysis shows that the maximum error is 1.3301%, the minimum error is 0.8310%, and the average error is 1.1081%, all within 1.5%. Therefore, the simulation values are in good agreement with the theoretical calculations, indicating that the model has high reliability and stability, meeting the simulation accuracy requirements.
Dynamic Characteristics During the Starting Phase
When gear transmission occurs, the presence of backlash causes impact and vibration in the system. In this section, I will discuss the relationship between the backlash magnitude and the impact and vibration states of the gear system during the starting and steady-speed phases, providing a reference for design optimization.
Speed Fluctuation
After simulation, I obtained the speed variation of the driven gear (large gear) under different backlash values. All speed curves exhibit three common stages:
- Stage 1: Before contact occurs, the large gear slowly accelerates in the reverse direction under the applied load.
- Stage 2: Contact and collision occur. The large gear interacts with the pinion, causing a drastic change in its rotational speed in the reverse direction. The speed oscillates back and forth due to contact stiffness.
- Stage 3: The oscillation amplitude is significantly reduced, and the speed increases approximately linearly, indicating that the large gear motion begins to stabilize.
With increasing backlash, the speed fluctuation amplitude in Stage 2 increases significantly. For 0 mm backlash, the maximum speed difference is 18.36 °/s; for 0.1 mm, it is 111.22 °/s; for 0.2 mm, it is 173.11 °/s. The increments are 92.86 °/s and 61.89 °/s, respectively. Moreover, as backlash increases, the duration of speed oscillation also becomes longer. The time to enter the stable Stage 3 is 0.0306 s for 0 mm, 0.0340 s for 0.1 mm, and 0.051 s for 0.2 mm. This clearly shows that the presence of backlash directly affects the smooth operation of the system, and the oscillation intensifies with larger backlash.
Mesh Force Fluctuation
I further analyzed the mesh force variation curves for backlash values of 0, 0.1, and 0.2 mm. The mesh force changes can also be divided into stages:
- Stage 1: At the very beginning, due to the initial clearance and insufficient contact, the pinion and gear do not actually contact, and the mesh force is zero.
- Stage 2 (semi-stable stage): As the load is gradually applied, the clearance reduces, the first contact occurs, causing collision impact, and the mesh force rapidly increases, forming a sharp peak. Due to surface stiffness, the contacting teeth bounce apart and then re-contact. This collision-bounce-re-collision process causes the mesh force amplitude to decay over time.
- Stage 3 (stable stage): The mesh force remains always positive, indicating that the contacting teeth are in continuous contact without separation. The mesh force fluctuates within a limited range, gradually narrowing into a spindle-shaped pattern, and finally increases linearly over time, indicating stable starting.
With increasing backlash, the collision impact becomes more severe, and the peak mesh force rises sharply. For example, in the time interval 0.028–0.030 s: at 0 mm backlash, the system is already in the late Stage 2; at 0.1 mm, it is in the transition between Stage 1 and Stage 2; at 0.2 mm, it is still in Stage 1. Larger backlash requires more time to enter the stable state and causes longer oscillation.
Dynamic Characteristics During the Steady-Speed Phase
In the previous section, I discussed the influence of backlash during the starting phase. In practice, ships usually operate at constant speed, so the effect of backlash on the herringbone gear system during steady speed also deserves attention. In this section, I further analyze this aspect.
Speed Fluctuation
I set the herringbone gear transmission pairs with three different backlash values to accelerate steadily to 60 r/min and maintain that speed. Assuming constant load and power during steady speed, I set the simulation time to 0.5 s, selected the GSTIFF integrator, S12 integration format, and 5000 simulation steps. The speed fluctuation curves show that the large gear speed exhibits periodic fluctuations around the theoretical value. The speed variation curve is a periodic function; within each period, the speed increases linearly within a small range and then rapidly drops, forming a sawtooth shape. Each small period experiences a sudden change with large fluctuations. I calculated the speed fluctuation frequency to be 24.096 Hz, which matches the gear meshing frequency of 24 Hz. This indicates that the periodic gear meshing causes the speed periodic variation. Specifically, due to the time-varying contact ratio, the number of tooth pairs in contact changes periodically, leading to periodic changes in the transmission state.
With increasing backlash, the periodic speed fluctuation amplitude increases significantly. For 0 mm backlash, the maximum speed difference is 24.14 °/s; for 0.1 mm, it is 41.44 °/s; for 0.2 mm, it is 75.96 °/s. The presence of backlash exacerbates the periodic fluctuation caused by the time-varying contact ratio, and larger backlash leads to greater speed oscillation, further damaging system stability.
| Backlash (mm) | Minimum speed (°/s) | Maximum speed (°/s) | Maximum difference (°/s) |
|---|---|---|---|
| 0 | 202.06 | 226.20 | 24.14 |
| 0.1 | 195.18 | 236.62 | 41.44 |
| 0.2 | 184.06 | 260.02 | 75.96 |
Table 5: Speed values and fluctuation differences under different backlash.
Mesh Force Fluctuation
I obtained the mesh force variation curves during the steady-speed phase under the influence of backlash. The mesh force also exhibits periodic fluctuations around a steady value, similar to the speed fluctuation. At certain intervals, there is a pronounced mesh force spike corresponding to the periodic change in contact ratio. The time points of these spikes are roughly consistent across different backlash values, and the frequency is 24 Hz, matching the speed mutation frequency. This shows that the periodic fluctuation of mesh force directly affects the speed transmission process, and the periodic changes in contact ratio keep the meshing parameters at the same frequency.
Furthermore, the backlash value directly affects the peak-to-peak range of mesh force fluctuation. At 0.1 mm and 0.2 mm backlash, the mesh force occasionally drops to 0 N, indicating that when oscillation becomes severe, the contacting tooth surfaces may separate. For 0 mm backlash, the minimum mesh force is 53.60 N, while for 0.1 mm and 0.2 mm, zero-force points appear. The presence of backlash also increases the frequency and severity of mesh force surges, making the force curve more irregular. As backlash increases, the system stability deteriorates.
| Backlash (mm) | Minimum mesh force (N) | Maximum mesh force (N) | Fluctuation amplitude (N) |
|---|---|---|---|
| 0 | 53.60 | 469.67 | 413.07 |
| 0.1 | 0 | 688.73 | 688.73 |
| 0.2 | 0 | 1163.84 | 1163.84 |
Table 6: Mesh force parameters under different backlash values.
Conclusion
My research led to the following conclusions:
- I established a parametric meshing model of herringbone gears with multiple backlash values, and verified the scientific nature and simulation accuracy of the model through theoretical calculations.
- By analyzing and comparing the speed fluctuation and mesh force variation of meshing herringbone gears during the starting phase, simulation data showed that the presence of backlash divides the meshing parameters into three stages. Increasing backlash intensifies the oscillation and prolongs the time required for the system to enter the steady state.
- By analyzing the speed and mesh force fluctuations during the steady-speed phase, simulation results indicated that both speed and mesh force exhibit periodic large fluctuations, consistent with the gear meshing frequency. Further analysis revealed that backlash aggravates the time-varying stiffness impact caused by the periodic change of contact ratio. Larger backlash leads to more severe impact oscillation and reduced system stability.
This study provides a theoretical basis for optimizing the vibration and noise reduction performance of marine herringbone gears.